

If you’ve ever tried to make sense of REIT reports, you know how confusing all the financial terms can get. I remember looking at “net income” once and wondering why it showed a loss even though the properties were thriving.
That’s when I learned about Funds From Operations (FFO), the number that actually shows how much a REIT earns from its real estate, not accounting adjustments.
In this blog, I’ll walk you through FFO’s meaning, how it’s calculated, and why it matters if you want to go beyond real estate investing basics. By the end, you’ll know exactly how to read FFO and spot which REITs are truly performing well.
What Does FFO Mean?
Funds From Operations (FFO) is the income a real estate investment trust (REIT) earns from its core business, after stripping out non-cash and one-time accounting items.
It’s a non-GAAP measure designed to show a clearer view of how much money a REIT makes from its regular operations. Unlike net income, which includes depreciation and other adjustments, FFO adds those back because real estate typically appreciates over time.
Depreciation can make a REIT’s profits look smaller than they really are. That’s why FFO helps investors understand the real performance of a REIT’s assets, much like how tracking open interest in options trading helps traders gauge true market activity beneath the surface.
FFO Formula (Nareit Standard): FFO = Net Income + Depreciation + Amortization minus Gains on Sales of Property
(Optional additions: + Losses on sales minus Interest income if non-operating)
You can usually find a REIT’s FFO in its quarterly or annual filings, specifically the 10-K or 10-Q under “Reconciliation of Net Income to FFO.” Some companies also include this figure in their investor presentation footnotes, giving shareholders a clear breakdown of how it’s calculated.
Step-by-Step Guide to Calculating FFO
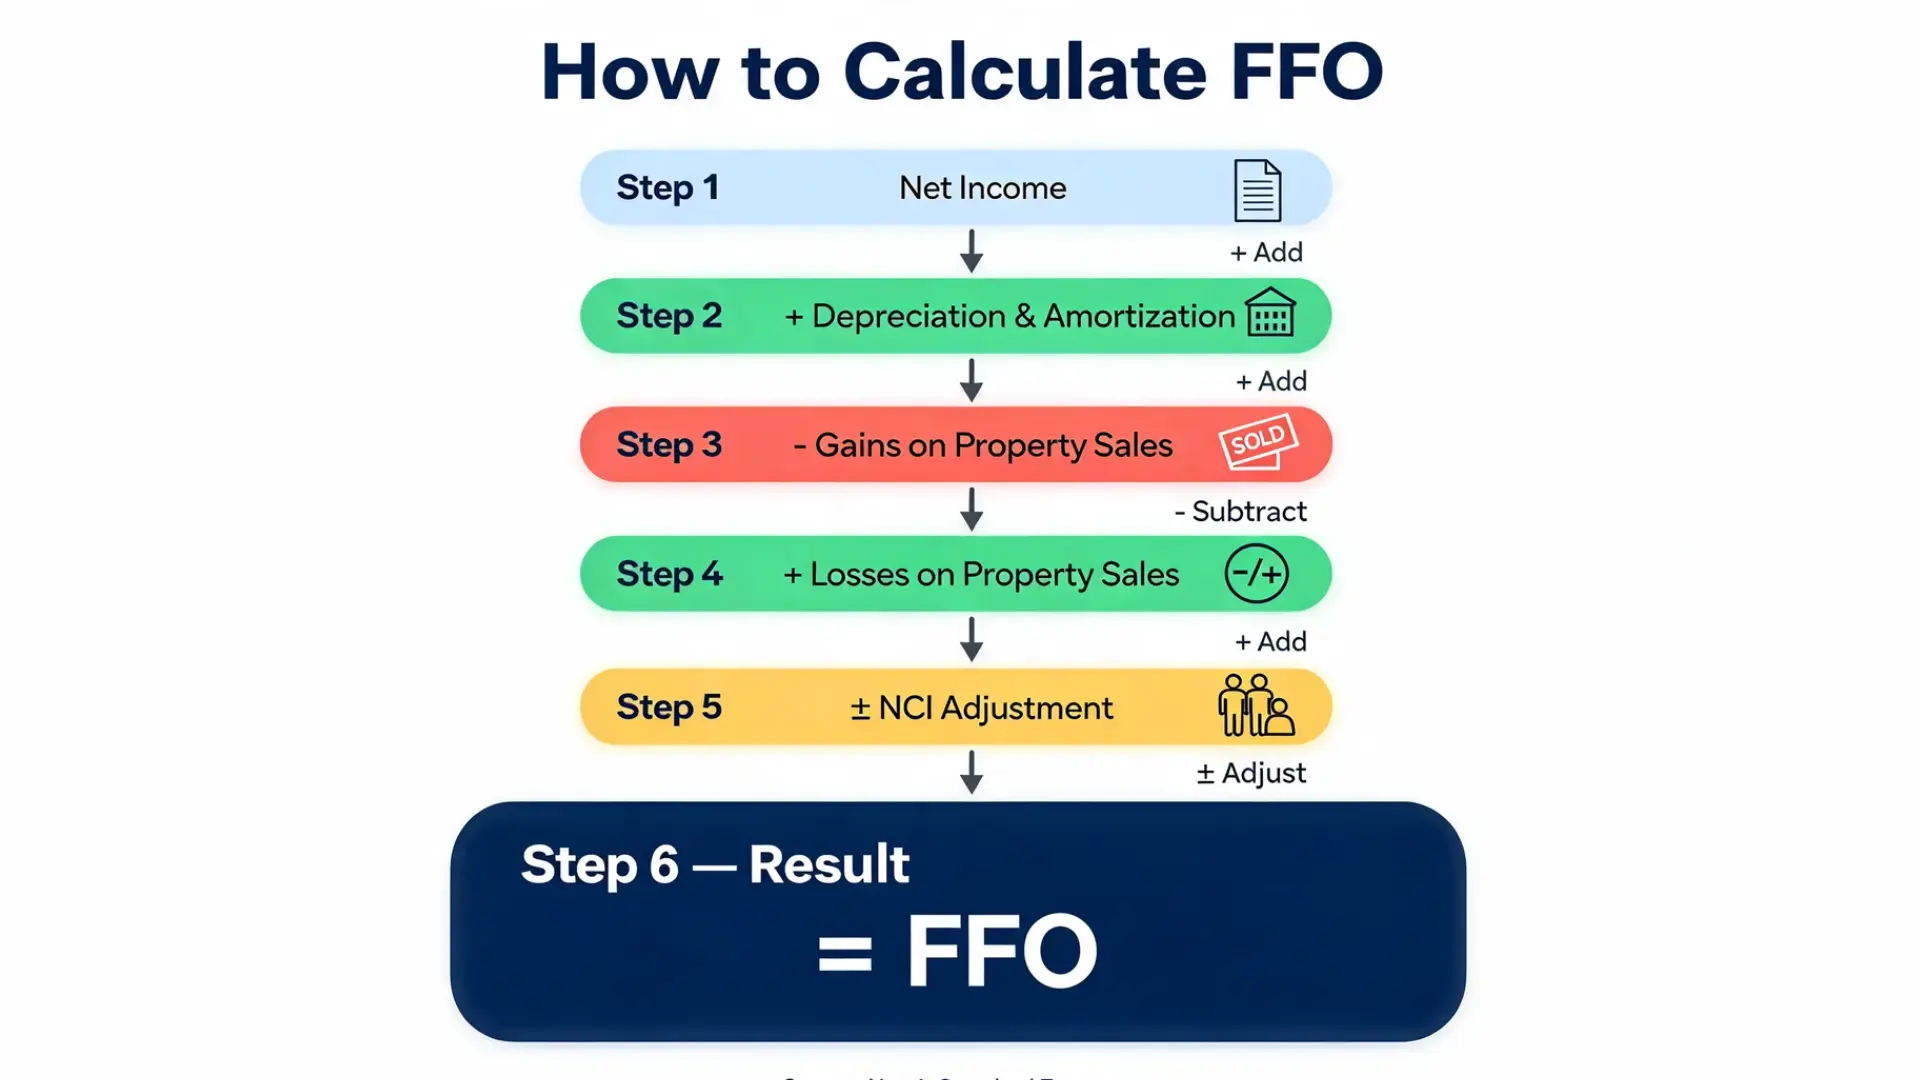
Follow these six steps to calculate FFO and understand a REIT’s actual operating performance beyond standard accounting figures.
Step 1: Start with net income from the income statement. This is the REIT’s reported profit before adjustments, serving as the base figure before you strip out accounting distortions.
Step 2: Add back depreciation and amortization. These are non-cash expenses that reduce reported profit but not actual cash flow, so adding them back reveals the property’s real earnings potential.
Step 3: Subtract gains on property sales. These one-time profits inflate net income and don’t represent ongoing business operations, so they must come out to show recurring earnings accurately.
Step 4: Add back losses on property sales. Losses are also non-recurring and should be reversed so one-time events don’t make recurring performance look weaker than it is.
Step 5: Adjust for non-controlling interests (NCI). This ensures only income attributable to common shareholders is reflected, keeping FFO consistent for investor comparisons.
Step 6: The result is Funds From Operations (FFO). This figure shows a REIT’s true earnings from its core properties and helps investors evaluate dividend strength and operational efficiency.
| Line Item | Source | FFO Treatment | Example ($000) |
|---|---|---|---|
| Net Income | Income Statement | Starting point | 100,000 |
| Depreciation | Cash Flow | Add back | +20,000 |
| Gain on Property Sale | Notes | Subtract | -5,000 |
| NCI Adjustment | Notes | Add | +2,000 |
| FFO | — | — | 117,000 |
Use this format every quarter to compare REIT performance consistently and evaluate long-term income stability.
Why FFO Matters in Real Estate Investing
FFO cuts through the noise that GAAP accounting creates when evaluating REITs. Here’s what makes it one of the most trusted measures in real estate analysis:
- Reflects true operational performance, not accounting noise.
- Better gauge for dividend sustainability.
- Enables comparisons across REITs.
- Core metric for valuation ratios (P/FFO).
Analysts track FFO per share to spot earnings growth, compare companies, and evaluate management efficiency. REIT boards depend on it to plan dividend payouts that align with recurring income rather than temporary profits.
Investors also review P/FFO ratios to identify undervalued or overvalued REITs compared to peers, making FFO a central benchmark for judging both income potential and overall portfolio strength. If you’re also thinking about REITs, stocks, and bonds, FFO is the number that helps you make that comparison honestly.
Comparing FFO With Other Metrics
Each financial metric answers a different question. Knowing which one to reach for in a given situation makes analysis a lot faster.
FFO vs. CFO (Cash Flow From Operations)
| Metric | What It Includes | What It Shows | Use in Analysis |
|---|---|---|---|
| FFO (Funds From Operations) | Adds back depreciation and amortization; excludes gains on property sales and non-operating income | Operational profitability | Measures true earnings power from recurring property operations |
| CFO (Cash Flow From Operations) | Working capital changes, all cash inflows and outflows from operations | Liquidity | Tracks actual cash generated to meet expenses and reinvest in the business |
FFO focuses on profitability after adjusting for non-cash items, while cash flow from operations reflects the company’s cash health and liquidity position.
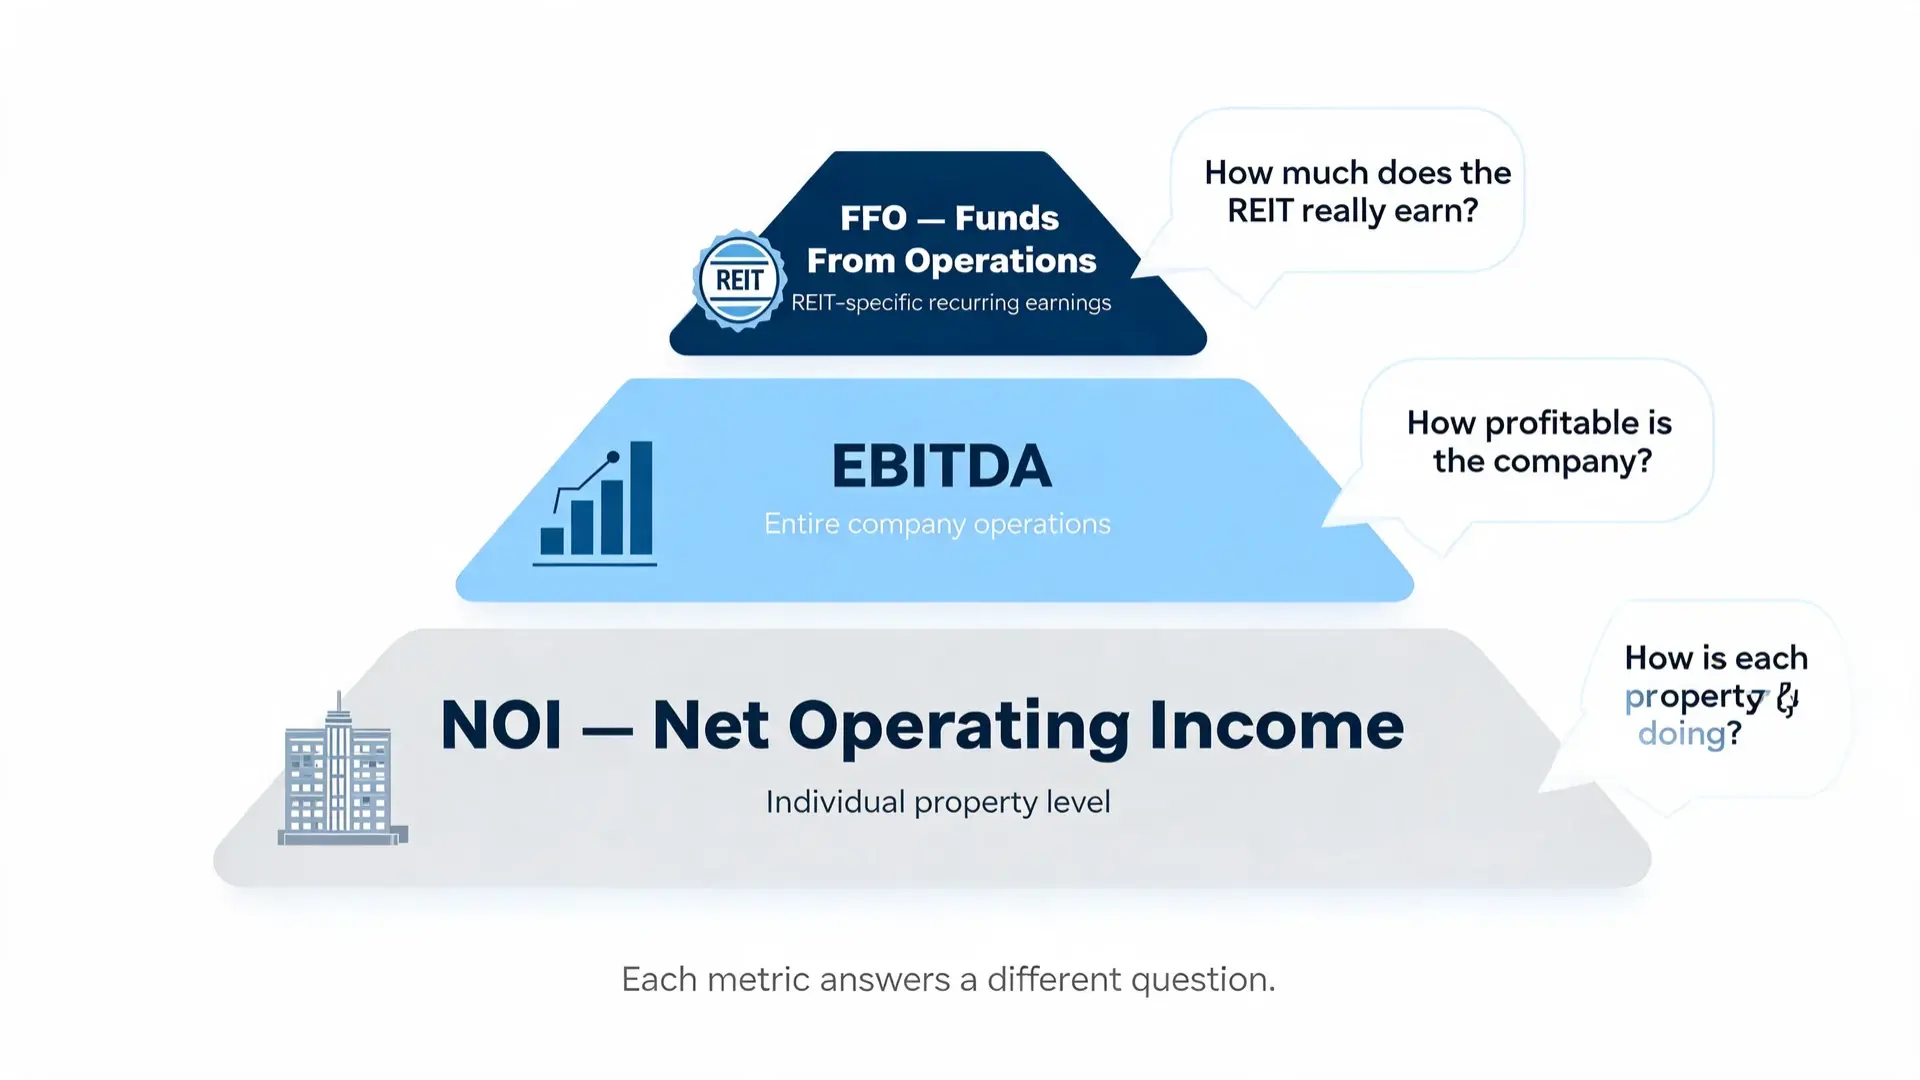
FFO vs. EBITDA and NOI
| Metric | Definition | Focus Area | Primary Use |
|---|---|---|---|
| EBITDA | Measures general profitability before accounting and financing effects | Overall company operations | Used across industries to assess core profitability without accounting distortions |
| NOI (Net Operating Income) | Income from property-level operations before corporate overhead, interest, and taxes | Individual properties | Evaluates property efficiency and performance for valuation and management decisions |
| FFO (Funds From Operations) | Net income adjusted for depreciation, amortization, and property sales gains or losses | Entire REIT portfolio | Indicates recurring earnings power and helps compare REITs consistently |
Together, these metrics give a full view: NOI shows how each property performs, EBITDA reveals corporate profitability, and FFO shows overall operational strength specific to REITs.
Adjusted Funds From Operations (AFFO): The Refined Metric
Adjusted Funds From Operations (AFFO) builds on FFO to show the actual cash a REIT has available to pay dividends. While FFO adjusts for non-cash accounting items like depreciation, AFFO goes further by accounting for recurring costs that affect real cash flow.
It deducts maintenance capital expenditures, straight-line rent adjustments, and other recurring expenses that don’t appear in FFO.
AFFO = FFO minus Maintenance CapEx minus Straight-Line Rent Adjustments +/- Recurring Items
AFFO gives a more realistic version of a REIT’s ability to sustain and grow dividends over time. Because it reflects true cash availability, investors and analysts often rely on AFFO when judging dividend coverage, payout safety, and overall financial stability.
FFO and Valuation Metrics Terms You Should Know
FFO Per Share
FFO per share shows how much profit each share generates from a REIT’s core operations. It’s similar to earnings per share (EPS) but more accurate for real estate because it excludes non-cash and one-time accounting items. Investors use this figure to track earnings growth, measure dividend-paying capacity, and compare performance among REITs.
A rising FFO per share suggests improved efficiency, better property income, or effective cost control. It’s one of the most-watched indicators when assessing a REIT’s long-term health and income potential.
Price-to-FFO (P/FFO) Ratio
The Price-to-FFO (P/FFO) ratio works like the price-to-earnings (P/E) ratio used for other companies. It compares a REIT’s stock price to its FFO per share, helping investors decide if it’s undervalued or overvalued. A lower P/FFO may signal a buying opportunity, while a higher one can indicate premium pricing or strong growth expectations.
Comparing this ratio against sector averages gives a better context. Ideally, investors look for consistent FFO growth supported by a reasonable P/FFO, balancing value with long-term stability across real estate sectors.
FFO in Credit Analysis

FFO is also useful for evaluating a REIT’s credit strength. It helps lenders and investors understand how well a company can handle its debt obligations using cash from operations.
1. FFO-to-Total Debt Ratio
The FFO-to-Total Debt ratio measures a REIT’s ability to repay debt using its operating income:
Formula = FFO / Total Debt
This ratio shows how many times a REIT’s annual operational funds can cover its total outstanding debt. A higher value means stronger repayment capacity and lower financial risk. According to S&P benchmarks:
- 0.6 or higher = Low risk
- 0.3 to 0.45 = Intermediate risk
- Below 0.2 = High risk
2. Complementary Ratios
In addition to FFO-to-Debt, analysts review:
- Debt/EBITDA: Shows how many years of earnings it would take to repay debt.
- Fixed-Charge Coverage: Measures how easily a REIT can meet interest and lease payments.
- Debt/Capital: Indicates what percentage of total financing comes from debt versus equity.
Together, these debt ratios give a balanced view of a REIT’s financial health and borrowing strength.
Common Pitfalls When Using FFO
FFO is a reliable indicator for REITs, but it can still be misread when investors overlook key accounting and operational details. Watch out for these:
Treating FFO as cash flow is a common mistake. It measures profitability, not actual liquidity or available cash.
Ignoring recurring maintenance CapEx leads to overstated AFFO and unrealistic dividend expectations.
Using FFO figures from different REIT sectors without normalizing for sector-specific factors like lease terms or capital intensity can give a false comparison.
Not checking for recurring “nonrecurring” add-backs can distort reported FFO and mislead performance analysis.
Relying only on P/FFO ratios without considering growth, leverage, or risk profile differences among comparable REITs misses important context.
Case Study: Prologis — Scaling FFO Through Operational Discipline
Current State and Outlook: Prologis (NYSE: PLD), a global leader in industrial logistics real estate, shows how disciplined portfolio management drives FFO growth. Despite fluctuating interest rates and supply chain shifts, the company maintained stable rental income and used scale to expand margins. Analysts now view Prologis as a benchmark for transparent and sustainable FFO reporting.
Implementation Strategy
Phase 1: Strengthening Core Operations (2021 to 2022)
Prologis focused on optimizing its logistics assets across urban hubs, securing long-term leases with reliable tenants. High occupancy (above 97%) and rent escalations supported double-digit cash flow growth.
Phase 2: Improving FFO Transparency (2023)
The company refined its reporting by clearly detailing depreciation add-backs, property gains, and joint-venture adjustments in its filings. This clarity improved investor confidence and made its FFO data comparable across global REIT peers.
Phase 3: Aligning FFO with AFFO and Dividends (2024 to Present)
Prologis linked its dividend policy directly to AFFO, maintaining a payout ratio near 75%. This ensured both strong shareholder returns and room for reinvestment.
Key Results
| Focus Area | Outcome |
|---|---|
| FFO Growth | Rose from $4.8B (2022) to $5.5B (2024), up 15% annually |
| FFO per Share | Increased by 10%, reflecting improved rent renewals and efficient cost control |
| Dividend Payout | Stayed below 80% of AFFO, signaling sustainability |
| Leverage Health | FFO-to-Debt ratio remained above 0.6, maintaining low risk |
| Market Valuation | P/FFO multiple averaged 21x, indicating strong investor confidence |
Challenges and Lessons Learned
Despite strong results, Prologis faced pressure from rising interest expenses and inflation-driven maintenance costs. It addressed these by:
- Structuring long-term leases with annual rent escalations.
- Prioritizing FFO-based debt coverage monitoring.
- Maintaining transparency to avoid overstated “adjusted” earnings.
Looking Forward
Prologis is now investing in AI-based property management to optimize maintenance costs and improve AFFO predictability. It’s also working with global REIT associations to standardize FFO definitions across regions, promoting cross-border comparability. By combining strong fundamentals and consistent FFO growth, the company shows how disciplined reporting can drive long-term investor trust.
Sector-by-Sector Cheat Sheet: FFO and AFFO by Property Type
Different real estate sectors have distinct operating patterns, costs, and lease terms that directly affect FFO and AFFO calculations. Use this table for a quick comparison.
| Sector | Typical Maintenance CapEx | Lease Tenor | Common AFFO Adjustments | Key Note |
|---|---|---|---|---|
| Industrial | Low | 5 to 10 years | Minor | Low volatility, steady rental income, and low upkeep needs |
| Retail | Moderate | ~5 years | Tenant improvements, rent abatements | Sensitive to consumer spending and tenant turnover |
| Office | High | 7 to 15 years | Heavy tenant improvements, higher CapEx | Vacancy risk increases during market slowdowns |
| Multifamily | Medium | 1-year leases | Releasing costs, turnover expenses | Stable cash flow due to quick lease cycles |
| Healthcare | Variable | 10 to 20 years | NNN lease offsets, property upgrades | Long-term leases, but exposure to regulatory shifts |
Global Perspective: IFRS vs. Nareit FFO
U.S. REITs use the Nareit definition of FFO under GAAP. International property companies reporting under IFRS use a similar measure called EPRA Earnings. Both aim to capture recurring operating performance by excluding non-cash and one-time items, but there are key differences.
IFRS allows revaluation gains, impairment reversals, and deferred tax adjustments that GAAP-based FFO typically excludes. These differences can cause notable variations in reported earnings between regions. For accurate global comparisons, investors must normalize metrics by adjusting for these accounting treatments.
Aligning FFO and EPRA Earnings ensures fair performance evaluation, particularly when comparing U.S., European, or Asia-Pacific REITs that follow different reporting standards but share similar business models.
Lease Accounting Updates (ASC 842) and How They Affect REITs
The ASC 842 lease accounting standard changed how REITs record leases and recognize rental income. Under this rule, most leases now appear on balance sheets, which increases transparency but slightly affects reported figures.
Rent is recognized on a straight-line basis, meaning income is spread evenly across the lease term rather than matching actual cash receipts. This creates timing differences between reported and received rent.
When calculating FFO or AFFO, review straight-line rent adjustments to make sure they’re handled consistently and don’t distort operational performance. Always check the footnotes in financial statements, where REITs disclose lease details, rent adjustments, and variable lease components that influence both reported income and true cash flow. It’s worth building a basic risk management framework around these disclosures before committing to any position.
Frequently Asked Questions About FFO in REITs
What is a good FFO per share for a REIT?
There is no single “good” FFO per share number because it varies widely by REIT size, sector, and property type. What matters more is whether FFO per share is growing year over year and whether it covers the dividend comfortably.
As a general rule, if a REIT’s annual dividend per share is consistently below its FFO per share, that’s a reasonable sign the payout is sustainable.
Is FFO the same as free cash flow for a REIT?
No, FFO is not the same as free cash flow. FFO is an earnings measure that adjusts net income for non-cash items like depreciation, but it does not account for capital expenditures or actual cash leaving the business. Free cash flow, by contrast, reflects what’s left after maintenance spending and reinvestment. AFFO (Adjusted Funds From Operations) gets closer to free cash flow by subtracting recurring maintenance CapEx and straight-line rent adjustments, which is why analysts often prefer AFFO when evaluating dividend safety.
Why do REITs use FFO instead of net income?
REITs are required by GAAP to depreciate their properties over time, which reduces net income even when the properties are appreciating in value. This makes net income a poor measure of a REIT’s actual earning power.
FFO corrects for this by adding depreciation back, giving a figure that better reflects the recurring cash income generated by the portfolio. The Nareit organization formally defined FFO in the 1990s specifically to address this distortion and create a consistent standard for comparing REITs.
Can FFO be negative, and what does that mean for investors?
Yes, FFO can be negative, though it is relatively rare for a mature, well-managed REIT. A negative FFO typically signals that operating expenses, interest costs, or large one-time charges have exceeded property income even after depreciation is added back.
For investors, a negative FFO is a serious warning sign about dividend sustainability, since dividends should ideally be funded by recurring earnings rather than asset sales or borrowing.
Conclusion
Now that you know what Funds From Operations (FFO) means, you can read REIT reports with more confidence. It helps you look past accounting details and focus on what matters most: steady income and real performance.
When you understand FFO, you can quickly spot which REITs manage their properties well and pay reliable dividends. If you’re comparing investment options, keep this metric in mind before making any decision. It’s a simple habit that can lead to smarter financial choices.
I hope this guide gave you a clear image of how FFO works and why it matters. Check out my other finance blogs for more easy breakdowns like this one.