
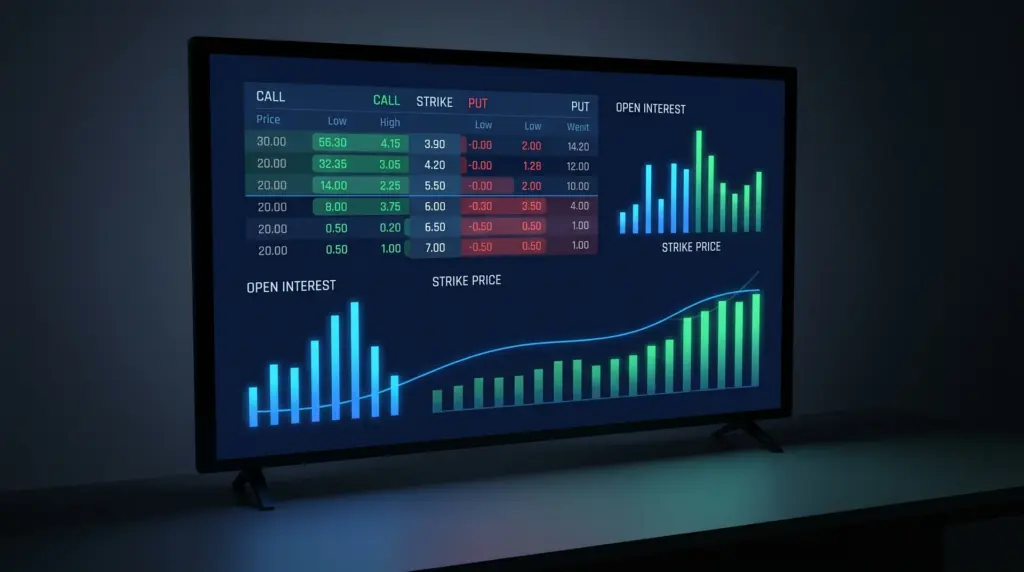
What is Open Interest in Options trading? Open Interest is the total number of options contracts that are still active in the market, meaning they have not been closed, exercised, or expired.
| Pattern Type | Sentiment and liquidity indicator |
| Best Timeframe | Daily review (OI updates after market close) |
| Signal | Market participation, trend strength, and liquidity depth |
| Reliability | Moderate to high, best when confirmed with price and volume |
| Confirmation Indicator | Volume, price direction, put/call OI ratio |
| ⚠️ Disclaimer: This article is for educational purposes only and does not constitute financial or investment advice. Always consult a qualified financial advisor before making investment decisions. |
Open Interest tells you how many contracts are still “alive” at any given strike price or expiration date. It is not the same as volume. Volume resets to zero every morning. Open Interest is cumulative: it reflects all contracts still outstanding across all previous sessions.
Volume is how many cars passed through an intersection today. Open Interest is the number of cars still parked in the lot. One tells you activity; the other tells you commitment.
When I check the options chain on a stock, high Open Interest at a specific strike tells me traders have taken real positions there.
Low Open Interest tells me I might be trading alone, which means wider bid-ask spreads and more slippage. That distinction alone is worth understanding before you place a single trade.
How Open Interest in Options Works
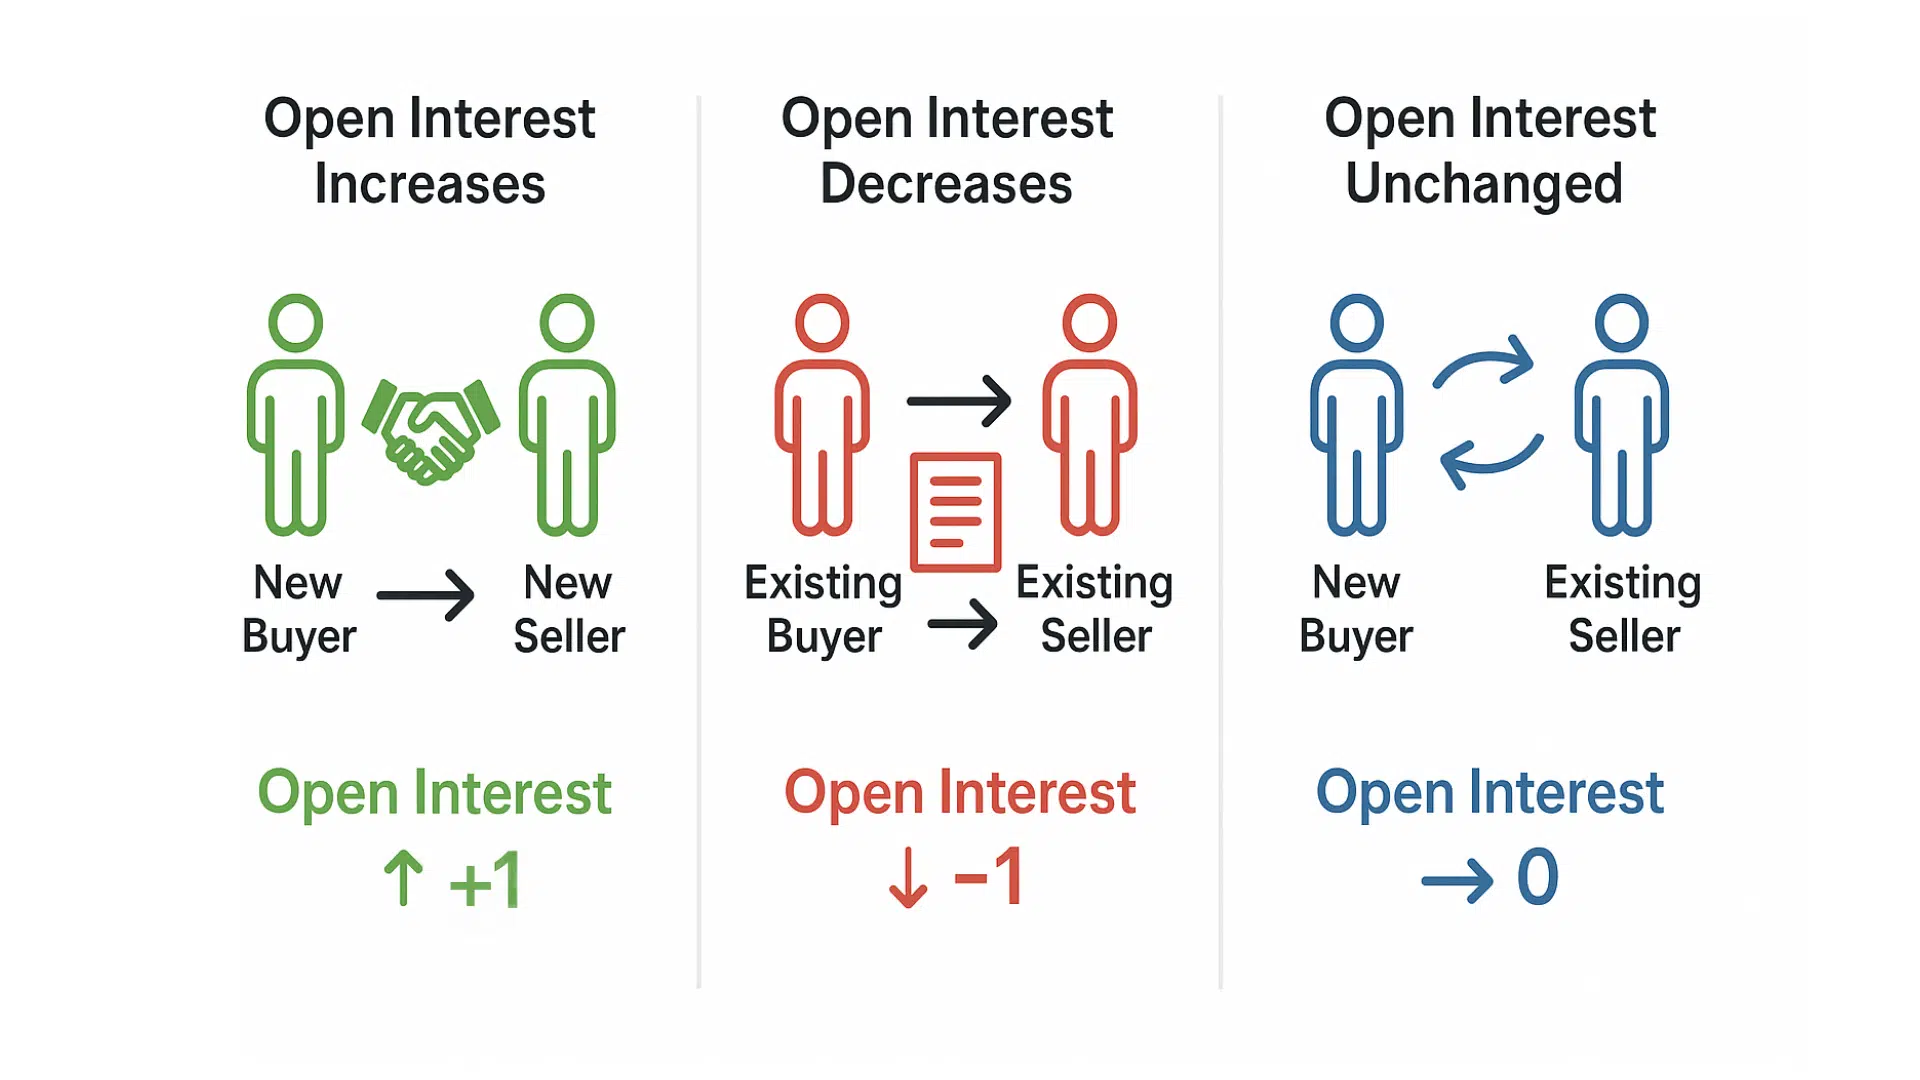
Open Interest moves in three directions: up, down, or flat. Each movement has a specific meaning, and learning to read them correctly is one of the most underrated skills in Options trading.
Open Interest Rises
When a new buyer and a new seller both enter the market together, a brand-new contract is created. Open Interest increases by one. This is fresh money entering the market. Both parties have taken on new exposure. Neither is closing an old position.
What to look for: this is the scenario you want to confirm a breakout. If price is moving up and Open Interest is climbing, new participants are buying conviction, not just old longs cashing out.
For example, during Apple’s product launch cycles in recent years, call Open Interest has regularly surged weeks before the announcement as traders build directional positions in anticipation.
Open Interest Falls
When an existing buyer and an existing seller both close their positions on the same day, that contract disappears. Open Interest decreases by one. Money is leaving. Participants are reducing exposure, taking profits, or cutting losses.
A common mistake here is assuming falling Open Interest always signals weakness. It does not. If a stock has been trending up for three weeks and Open Interest starts dropping, that often means longs are harvesting gains.
The trend played out. Watch this especially in the week leading into options expiration, when position unwinding is routine.
Open Interest Stays Flat
This is the most overlooked scenario. One trader opens a new position while another closes an existing one. The contract count remains unchanged, but the market is not standing still.
New money is replacing old money. Participation remains constant, but the faces at the table change.
In choppy, sideways markets, you often see high volume paired with stable Open Interest. Traders are active, but nobody is building a significant new position. That tells me there is no strong directional conviction yet. I wait for OI to start moving before adding size.
Exchanges report Open Interest once per day, after the close. The number you see during the trading session reflects yesterday’s final tally. It is not real-time, so factor in that lag in your analysis.
Step-by-Step: How to Identify What Open Interest is Telling You
Here is exactly how I read Open Interest on any options chain, in the order I do it:
- Pull up the full options chain for the stock you are analyzing. Look at both calls and puts across multiple strikes and expirations.
- Find the strikes with the highest Open Interest. These are your anchor levels. Price tends to react at these strikes, especially as expiration approaches.
- Compare today’s Open Interest to yesterday’s. Most platforms show the change. Rising OI confirms new positions. Falling OI signals exits.
- Check volume alongside OI. High volume with rising OI signals strong new conviction. High volume with flat OI suggests rotation, not a new directional move.
- Calculate the put/call OI ratio. Divide the total put Open Interest by the total call Open Interest. A ratio above 1.0 leans bearish or reflects hedging activity. Below 1.0 leans bullish. Track the ratio over several days, not just a single reading.
- Map the OI concentration by expiration. When large clusters of Open Interest sit at one expiration date and strike, watch for pinning behavior as that date approaches. The market has a mechanical tendency to gravitate toward the strike where the most contracts would expire worthless.
Open Interest Changes Day by Day: A Real Example
Here is a five-day walkthrough showing exactly how Open Interest shifts and what each day means in practice:
| Day | Trading Activity | Daily Volume | Open Interest | Change in OI |
|---|---|---|---|---|
| Day 1 | Trader A buys (new) + Trader B sells (new) | 1 | 1 | +1 |
| Day 2 | Trader A sells (close) + Trader B buys (close) | 1 | 0 | -1 |
| Day 3 | Trader C buys (new) + Trader D sells (close) | 1 | 0 | 0 |
| Day 4 | Trader E buys (new) + Trader F sells (new), Trader G buys (new) + Trader H sells (new) | 2 | 2 | +2 |
| Day 5 | Trader E sells (close) + Trader F buys (close) | 1 | 1 | -1 |
Notice that volume resets each morning. Open Interest is cumulative. On Day 3, the market was active, volume was 1, but Open Interest did not change because one new participant simply replaced one exiting participant. That distinction is what separates OI analysis from volume analysis.
Why Open Interest Matters for Options Traders
Open Interest is not just a number. It is the answer to questions most traders never think to ask: Is anyone else actually in this trade?
Is there enough liquidity to get out cleanly? Is this price move backed by real new money, or is it just old positions unwinding? Here is what I rely on it for, with specific criteria for each use case:
Liquidity check before entry.
High OI at a strike means tighter bid-ask spreads and smoother fills. According to CBOE’s options education resources, liquidity in options markets is directly tied to open contract depth.
A strike with OI under 100 is a warning sign. I generally want OI above 500 before trading that strike, and above 1,000 for any meaningful size.
Trend confirmation.
Rising price with rising OI means fresh capital is entering on the long side. That is a healthy trend.
Rising price with falling OI is a short-covering rally: shorts are exiting, which pushes prices up, but new buyers are not stepping in.
Those rallies tend to stall. I have learned this the hard way, entering breakouts that looked strong on price alone, only to see them reverse the next day once the short-covering finished.
Support and resistance mapping.
Strikes with heavy Open Interest act as magnets, particularly in the final week before expiration. If the $185 put has 30,000 contracts of Open Interest and the stock is trading at $188, that put wall likely provides support.
Market makers who sold those puts are hedging by buying shares as price drops toward $185, which creates real buying pressure at that level.
Sentiment gauge.
The put/call OI ratio gives a fast read on crowd positioning. When the ratio spikes well above 1.0, the crowd is heavily hedged or outright bearish.
Extreme readings often precede reversals, because when everyone is leaning the same way, there is nobody left to push the trade further.
According to research from the SEC’s investor education materials, sentiment crowding in derivatives markets frequently precedes short-term reversals.
Open Interest vs. Volume: The Difference That Actually Matters
Traders confuse these two metrics constantly. Here is what each one actually tells you:
| Feature | Open Interest | Volume |
|---|---|---|
| What It Measures | Total active contracts not yet settled | Contracts bought and sold during one session |
| Time Perspective | Cumulative across all previous sessions | Resets to zero each morning |
| What It Tells You | Market commitment and liquidity depth | Trading intensity in the current session |
| When It Updates | Once daily, after market close | Continuously throughout the trading day |
| Typical Reading | OI of 50,000: fifty thousand contracts currently open | Volume of 5,000: five thousand contracts traded today |
Volume shows you the action. Open Interest shows you the conviction. Use volume to gauge how active a strike is right now.
Use Open Interest to gauge whether real capital has taken a committed position there. Both are needed. Neither is sufficient alone.
How to Read Open Interest Signals: Four Core Combinations
Reading Open Interest in isolation is a common mistake. The signal only becomes meaningful when you pair it with price direction. Here are the four combinations I use in practice:
| Price | Open Interest | What It Means | How I Trade It |
|---|---|---|---|
| Rising | Rising | Bullish confirmation. New money entering the long side. | Look for call entries on pullbacks to support |
| Falling | Rising | Bearish confirmation. Fresh shorts building. | Puts or short positions with defined risk |
| Rising | Falling | Short-covering rally. Shorts exiting, not new buyers arriving. | Fade the move or wait for new OI buildup before entering |
| Falling | Falling | Long liquidation. Longs are exiting, not reversing. | Avoid buying the dip until OI stabilizes |
Context changes everything here. A short-covering rally in a strong uptrend looks different from the same signal at a major resistance level.
Open Interest gives you information, not a decision. You still need the full picture, including the trend, where the price is in its range, and what the broader market is doing.
Call Open Interest vs. Put Open Interest
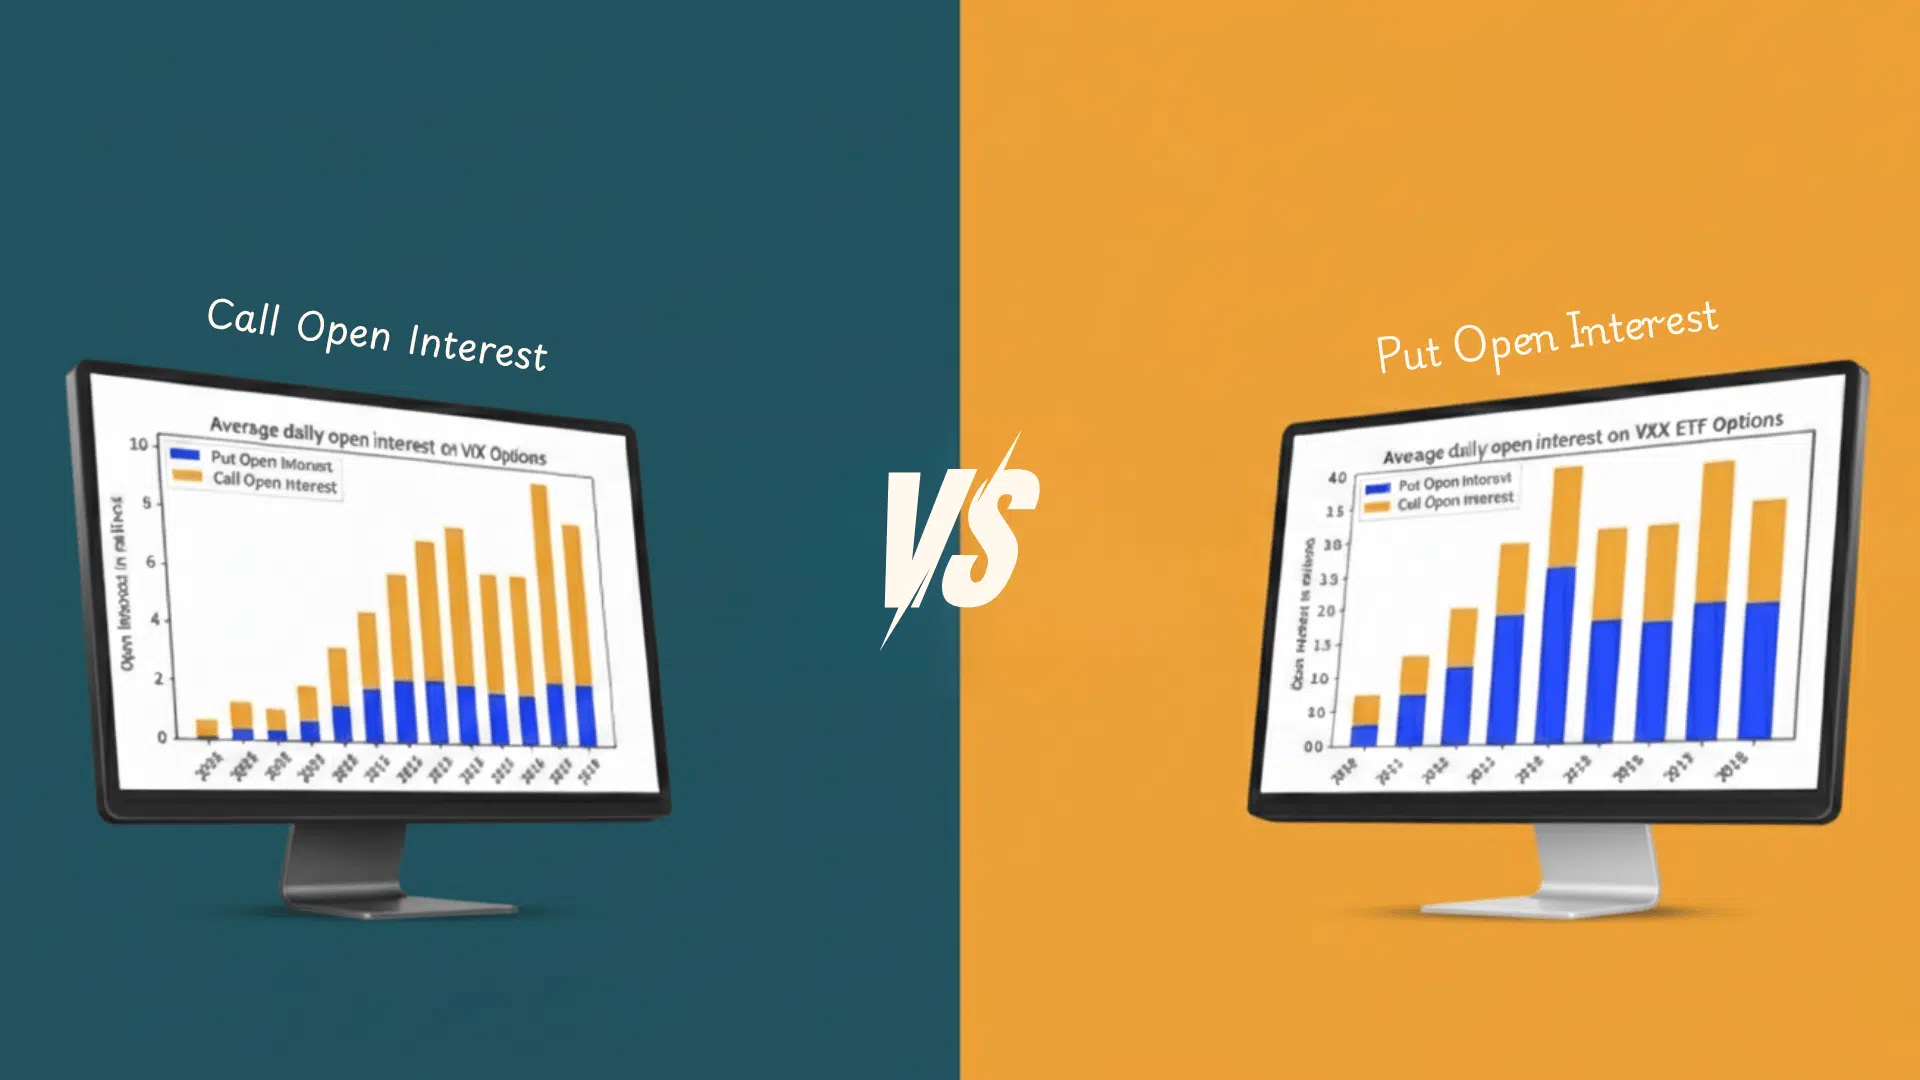
Where the Open Interest sits matters as much as how much of it there is. Call OI and Put OI tell different stories, and you need both to read market sentiment accurately.
Call Open Interest
High call Open Interest typically signals bullish positioning: traders are buying upside exposure. But it can also reflect covered call selling, where a trader who owns the stock sells calls to generate income.
A strike with unusually high call OI just above the current price often acts as a ceiling. If those calls were sold by covered call writers, they would sell their stock as the price approaches the strike to stay hedged, which creates an overhead supply.
Put Open Interest
High put Open Interest below the current price usually signals either bearish bets or protective hedging by institutions holding long stock.
A large put wall, say 30,000 contracts at the $185 strike when the stock is at $190, can actually support price.
Market makers who sold those puts buy shares as price falls to hedge their delta, creating a floor. This is one of the most practical insights Open Interest gives you for short-term day trading setups.
The Put/Call Open Interest Ratio
Divide total put OI by total call OI to get a quick sentiment read. Above 1.0 means more puts than calls are outstanding, which leans bearish or heavily hedged.
Below 1.0 leans bullish. What matters is not the absolute number but the trend over time.
A ratio climbing from 0.7 to 1.3 over two weeks tells me sentiment is shifting fast, and the crowd is increasingly positioned for a drop.
Extreme readings in either direction often signal overcrowding, which sets up contrarian opportunities.
OI-Based Trading Strategies: What Actually Works
Open Interest is most useful when you build it into a repeatable pre-trade checklist. Here are the three strategies I rely on, plus how to apply them in practice as part of a broader Open Interest trading approach:
| Strategy | Application | What to Look For |
|---|---|---|
| Trend Confirmation | Validate breakouts before entering | Rising OI with rising price (bullish) or falling price (bearish) |
| Reversal Detection | Spot potential trend exhaustion early | Divergence between price direction and OI direction |
| Max Pain Analysis | Anticipate price behavior near expiration | High OI concentration at a specific strike where pinning may occur |
For strike selection specifically, always choose the strike with higher Open Interest when you have two options that otherwise look equivalent.
The better liquidity means tighter spreads and smoother execution. This applies to both single legs and spreads. If you are trading a vertical spread, check that both legs have adequate OI before entering.
A spread where one leg is illiquid is a trap. You will get in cleanly and struggle to get out.
For a deeper look at how Open Interest integrates into specific Options trading analysis, the mechanics are the same across both simple and complex strategies.
Common Mistakes Traders Make with Open Interest
- Using OI in isolation without checking price and volume. Open Interest confirms what is happening; it does not predict what will happen. A rising OI reading means nothing until you know whether price is also rising or falling.
- Misreading a spike as directional conviction. Sudden large OI increases often reflect institutional hedging, not directional bets. An institution buying puts to hedge a large stock position looks the same as a speculator making a bearish bet on the OI chart. The number alone does not tell you which it is.
- Ignoring the put/call ratio trend. A single day’s ratio is not meaningful. A ratio that has been rising steadily for two weeks tells you something important about how sentiment is shifting. Most traders only check the ratio once and move on.
- Trading low OI strikes to save on premium. Cheap options at illiquid strikes are cheap for a reason. The wide spread alone can cost you more than the premium you saved, and getting out of a losing position in a thin market is painful.
- Ignoring OI by expiration date. Not all Open Interest is equal. Heavy OI clustered at one expiration creates pinning dynamics that do not exist at expirations with scattered OI. Check both strike-level and expiration-level distribution.
Open Interest in Practice: Reading an AAPL Options Chain
Here is how I would read a real options chain using Open Interest as the primary lens. Take Apple (AAPL) as an example, using hypothetical but representative data:
- $190 Call: OI = 25,000, Volume = 2,000
- $185 Put: OI = 30,000, Volume = 1,500
The $190 call has 25,000 open contracts with 2,000 traded today. That ratio tells me the position has been building over many sessions: this is not a one-day event.
Sustained call OI near a round number above current price often signals a target traders are betting toward, or a ceiling created by covered call sellers.
The $185 put has even heavier Open Interest at 30,000 contracts. With AAPL trading between these two strikes, the $185 level likely acts as support. Market makers short those puts are buying shares as price approaches $185 to manage their delta. That creates real mechanical buying at that level.
If AAPL is rising and call OI is increasing simultaneously, that confirms fresh bullish conviction, not just short covering. The $185 put wall below provides a safety floor.
This is not a trade recommendation. It is an illustration of how OI levels frame price action in a practical way.
Always verify current data through a live options chain before trading. Options trading hours also affect when you can act on these setups.
Limitations of Open Interest You Need to Know
Open Interest is a useful tool, but it has real blind spots. Here is what it cannot tell you:
- It does not tell you the direction of the trade. A buyer and a seller create every open contract. The OI number does not reveal which side is speculating and which is hedging.
- It lags by one day. By the time you see yesterday’s OI figure, the market has already moved for another session. Fast-moving situations require real-time volume and price analysis to fill the gap.
- A large OI spike may be institutional hedging, not speculation. A pension fund hedging a $500 million equity portfolio will create enormous put Open Interest. That is defensive positioning, not a bearish directional bet, and the two look identical on the OI chart.
- It works best near expiration. OI dynamics, especially pinning and max pain effects, are most reliable in the final week before expiration. Weeks out, the signal is weaker because there is still time for positions to shift.
OI confirms what is happening. It does not forecast what will happen next. Treat it as a validation tool for trades you have already developed through price and chart analysis, not as a standalone signal.
Understanding patterns like the megaphone pattern alongside OI analysis gives you a far more complete read of what the market is doing at any given moment.
Frequently Asked Questions
What does Open Interest mean in Options?
Open Interest is the total count of options contracts that are still active and have not been closed, exercised, or expired. It reflects the level of real commitment traders have to a specific strike price and expiration date. Unlike volume, which resets daily, Open Interest builds up over time and tells you how much capital is staked in a particular position.
How much Open Interest is useful in Options?
As a general rule, I look for at least 500 contracts of Open Interest before trading a strike. For larger positions or shorter-dated options, I want 1,000 or more. Any strike with OI under 100 should be avoided unless you are trading a very small size and are prepared for wide spreads.
What does high Open Interest at a specific strike mean?
High OI at a strike tells you that many traders have committed real capital there. It often creates a price magnet, especially near expiration.
Strikes with heavy call OI above the current price can act as resistance. Strikes with heavy put OI below the current price can act as support, because market makers holding short puts must buy shares to hedge as the price approaches.
What does it mean when Open Interest increases with rising price?
This is the most bullish combination in OI analysis. New buyers are entering, fresh capital is moving into calls, and the upward price move is being supported by actual conviction.
This is the scenario you want to see before entering a call trade on a breakout, not just a high-volume day without corresponding OI growth.
How do I use Open Interest to find support and resistance levels?
Look at the strikes with the highest Open Interest across the nearest one or two expirations. Heavy put OI below the current price is often a support zone, because market makers short those puts hedge by buying shares as the price falls.
Heavy call OI above the current price can cap rallies for the same reason. Map these levels onto your price chart and treat them as key zones to watch.
Conclusion
Open Interest is not the most glamorous metric in Options trading, but it is one of the most reliable ones. Every time I enter a trade without checking OI first, I am flying partially blind.
The number tells me whether I have real liquidity, whether a trend has genuine conviction behind it, and where the market’s largest positions are concentrated.
Always check OI before entering any strike, avoid anything under 500 contracts unless your size is tiny, and always pair OI with price direction to get the full signal.
When price and Open Interest are both rising together, the trend has real support. When they diverge, be cautious. That combination has saved me from more bad entries than any other single check in my pre-trade routine.
Your next step is to pull up the options chain for a stock you are already watching. Identify the strikes with the three highest Open Interest figures on both the call and put side. Map those levels onto your price chart.
Notice how the price has reacted at or near those levels in recent sessions. You will start seeing the OI framework in action immediately, without any additional theory required.