

Open interest is one of those terms traders hear all the time but rarely understand fully. It sounds technical, but it’s actually simple.
Open interest shows how many option contracts are still active in the market. It tells you where the crowd is placing their bets and how strong their conviction really is.
When you combine it with price and volume, you start to see patterns. You spot liquidity, confirm trends, and even predict reversals. Whether you’re trading calls, puts, or spreads, knowing how to read open interest gives you an edge.
In this guide, we’ll break down what open interest means, how it’s calculated, and how you can use it to make smarter, more informed trading decisions.
What Is Open Interest?
Open interest (OI) refers to the total number of option contracts that are still active in the market. These include both calls and puts that haven’t been closed, exercised, or expired yet.
Think of it as a count of all the “live” contracts traders are holding. When a buyer and seller agree to open a new contract, open interest goes up by one. When someone closes their position, it drops by one. It’s that simple.
Open Interest = Number of Active Contracts in the Market
Example: Here’s how it works
Monday: Traders open 200 new call contracts.
→ OI = 200
Tuesday: 50 of those contracts are closed.
→ OI = 150
This means 150 contracts are still “open” and active in the market.
How is Open Interest Calculated?
Your broker handles the math for you, but understanding the formula helps you read the market better. The calculation is straightforward.
You take yesterday’s open interest, add any new contracts opened today, and subtract the ones that were closed or expired. The result is your updated open interest figure.
New OI = Previous OI + New “To Open” Contracts − Closed or Expired Contracts
Example:Let’s break it down
Yesterday’s OI: 1,000 contracts
Today:
- 300 new contracts were opened
- 200 contracts were closed
New OI = 1,000 + 300 − 200 = 1,100
So the updated open interest is now 1,100 contracts.
Important Note:
Open interest gets updated after the market closes by the Options Clearing Corporation (OCC). It’s not a real-time number. You’ll see the final count only at the end of the trading day. This means you can’t track it live like you would with price or volume.
Why Open Interest Matters in Options Trading
Open interest isn’t just a number on your screen. It tells you how active and healthy the market is for that option. Traders who ignore it often face bad fills, wide spreads, and poor trade execution. Here’s why it matters.
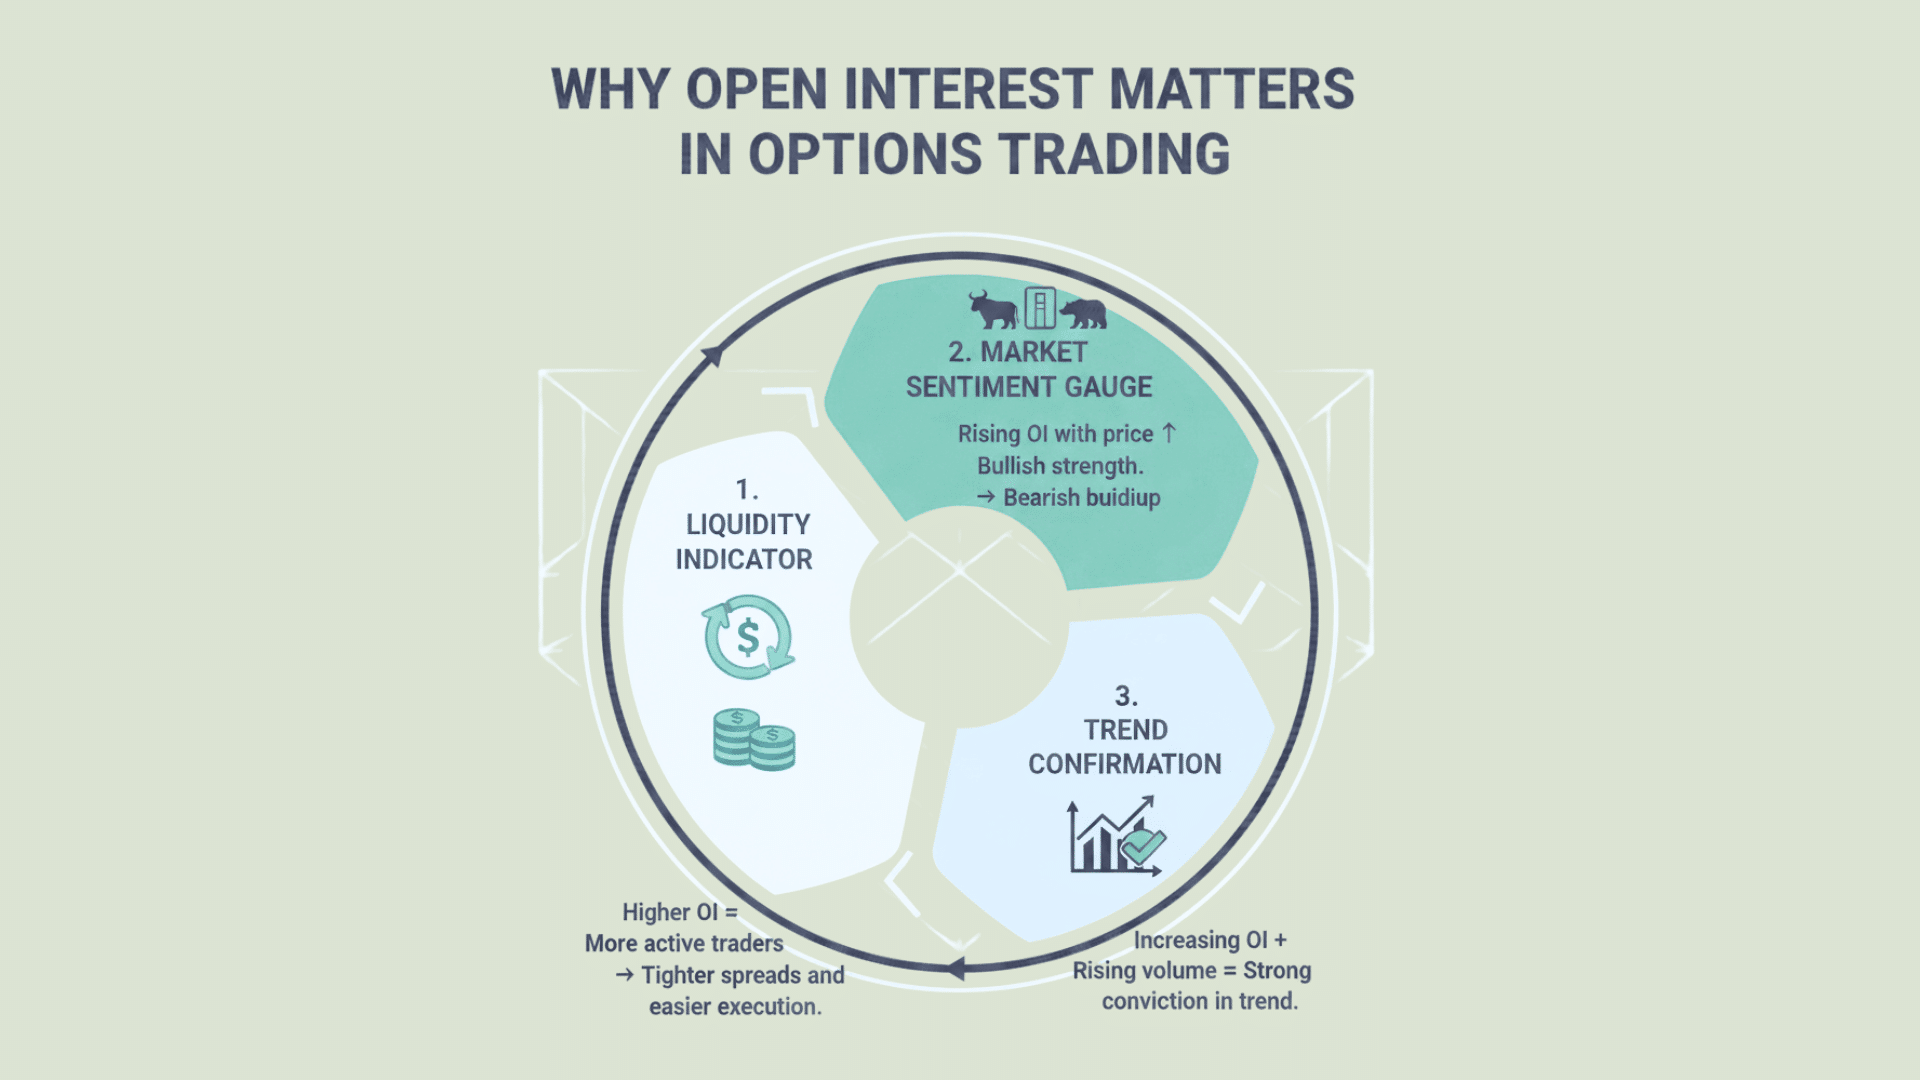
1. It Reveals Market Liquidity
High open interest means more traders are involved. You can enter and exit trades easily. The bid-ask spreads stay tight, and slippage stays low.
Low open interest means fewer participants. You might struggle to find a buyer or seller. Trading costs go up, and spreads widen.
If you want smooth trades, always check the open interest first.
2. It Reflects Market Sentiment
Open interest combined with price and volume shows you what traders really believe. It helps you spot whether the move is supported by real conviction or just noise.
Here’s how to read it:
| Price Movement | OI Movement |
|---|---|
| Price ↑ + OI ↑ | New long positions → Bullish |
| Price ↓ + OI ↑ | New short positions → Bearish |
| Price ↑ + OI ↓ | Short covering → Weak rally |
| Price ↓ + OI ↓ | Long liquidation → Correction |
This breakdown helps you understand if the trend has real strength behind it.
3. It Confirms Trend Strength
A strong rally with rising open interest shows that fresh money is flowing in. Traders are confident. They’re opening new positions to capitalize on the trend.
But if prices rally while open interest drops, it’s a warning sign. The move might lack support. Momentum could fade soon.
Always pair price action with open interest to confirm if a trend is real or just temporary.
Reading Open Interest by Strike and Expiry
Open interest isn’t the same across all strikes and expiration dates. By looking at where the concentration is, you can spot key price levels where the market might react. This helps you plan better entries, exits, and risk management.
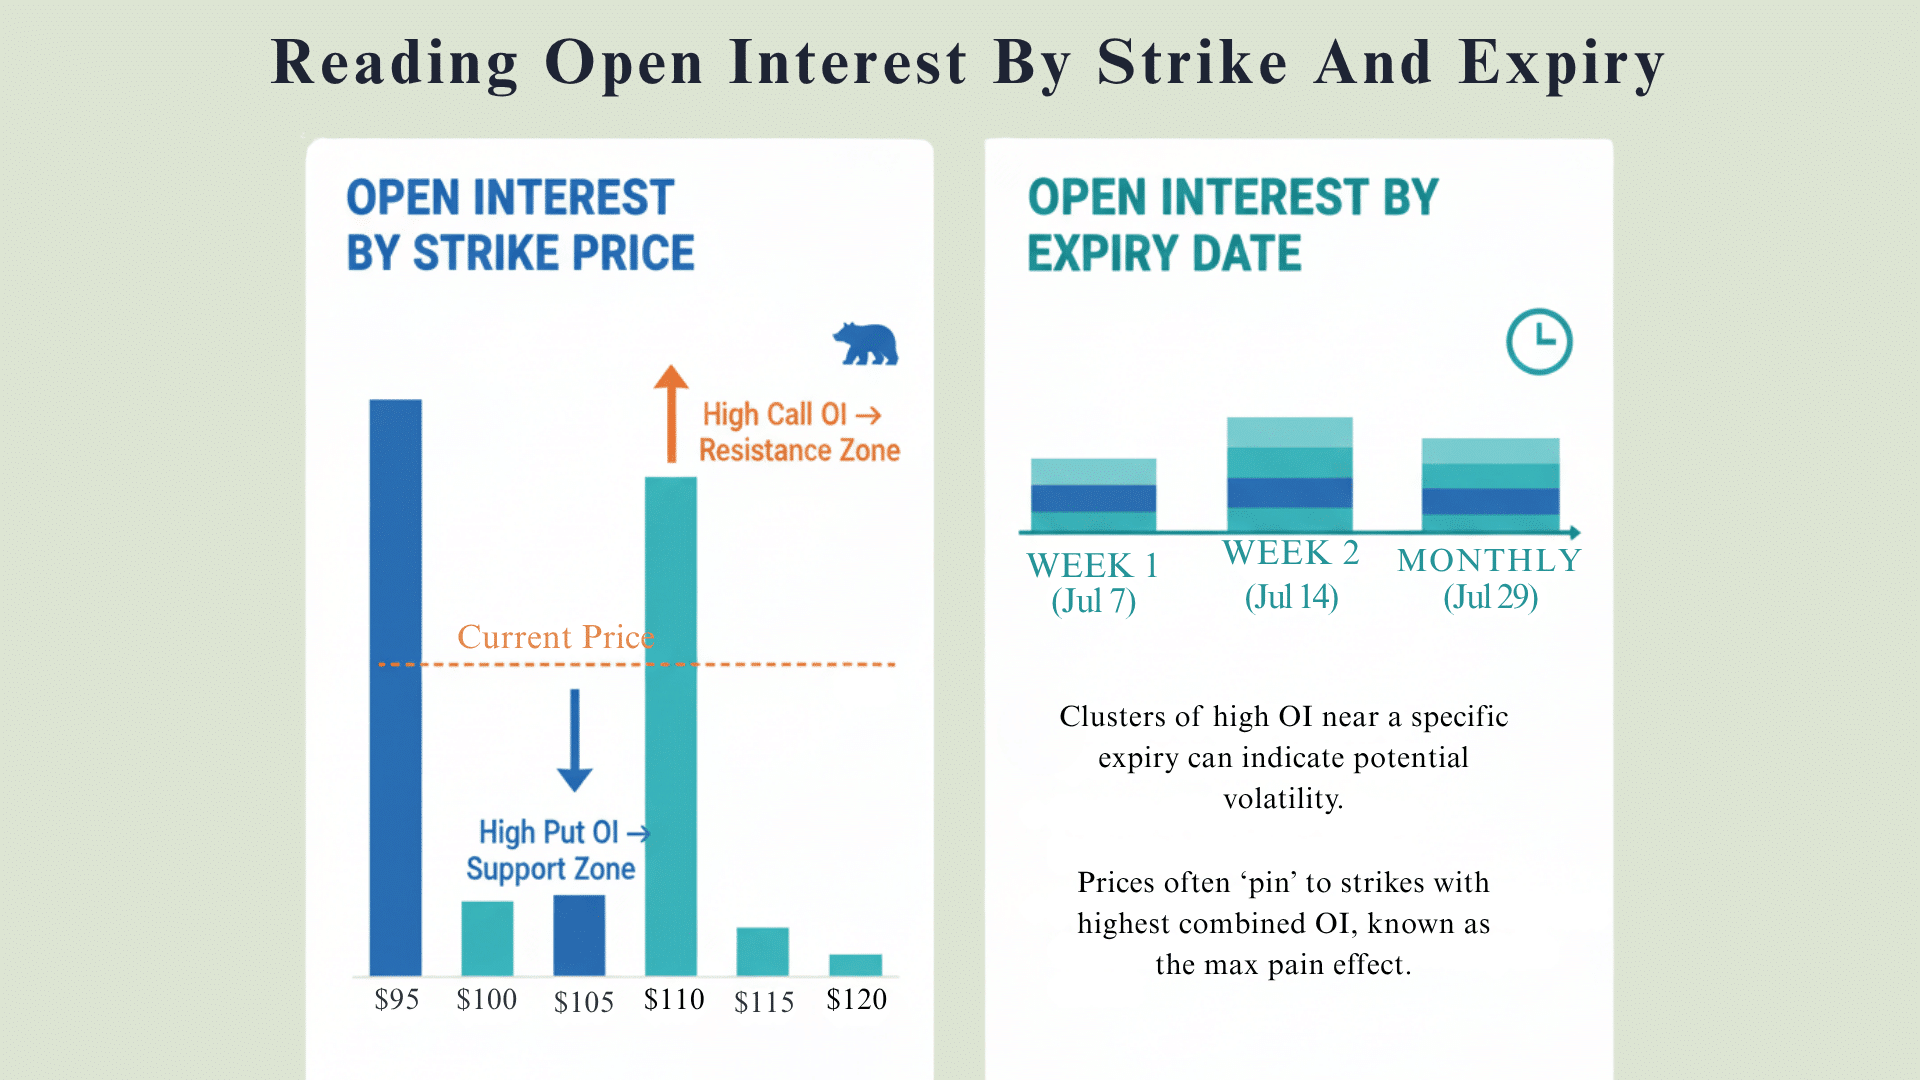
1. Strike Level OI (Support & Resistance)
Strikes with high call OI often act as resistance zones. When prices approach these levels, sellers may step in to defend their positions.
Strikes with high put OI usually serve as support levels. Buyers tend to protect these areas because many traders have bets placed there.
Why does this happen? These are “crowded” zones. Traders adjust or hedge their positions around them. The more contracts stacked at a strike, the more likely the price will react when it gets close.
Checking strike level OI helps you predict where the market might pause, bounce, or reverse.
2. Expiry Concentration
Sometimes, open interest piles up heavily around one expiration date. This creates something called pinning.
Pinning happens when prices seem to “stick” near a specific strike as expiry approaches. It’s also known as the max pain effect. The market gravitates toward the strike where the most options would expire worthless. This benefits option sellers the most.
If you see high OI clustered at a certain expiry and strike, expect price action to hover around that level as the date gets closer.
Tracking expiry concentration gives you clues about short-term price behavior, especially in the final days before options expire.
The Put Call Open Interest Ratio (PCR)
The Put Call Open Interest Ratio, or PCR, is a simple tool that helps you read the overall market mood. It compares the total open interest in puts versus calls. Traders use it to sense whether the market leans bullish or bearish.
PCR = Total Put OI ÷ Total Call OI
How to Read PCR
PCR > 1 → More puts are open than calls. This usually signals bearish sentiment or heavy hedging activity.
PCR → More calls are open than puts. This suggests bullish sentiment among traders.
Read It with Context
A high PCR doesn’t always mean traders expect a crash. Sometimes, institutions buy puts to hedge their portfolios, not because they’re pessimistic. They’re just protecting gains.
Similarly, a low PCR might reflect speculative call buying or genuine optimism. You need to look at price action, volume, and news to understand what the ratio really means.
Don’t use PCR in isolation. Combine it with other indicators to get a clearer picture of where the market is heading.
How Traders Use Open Interest?
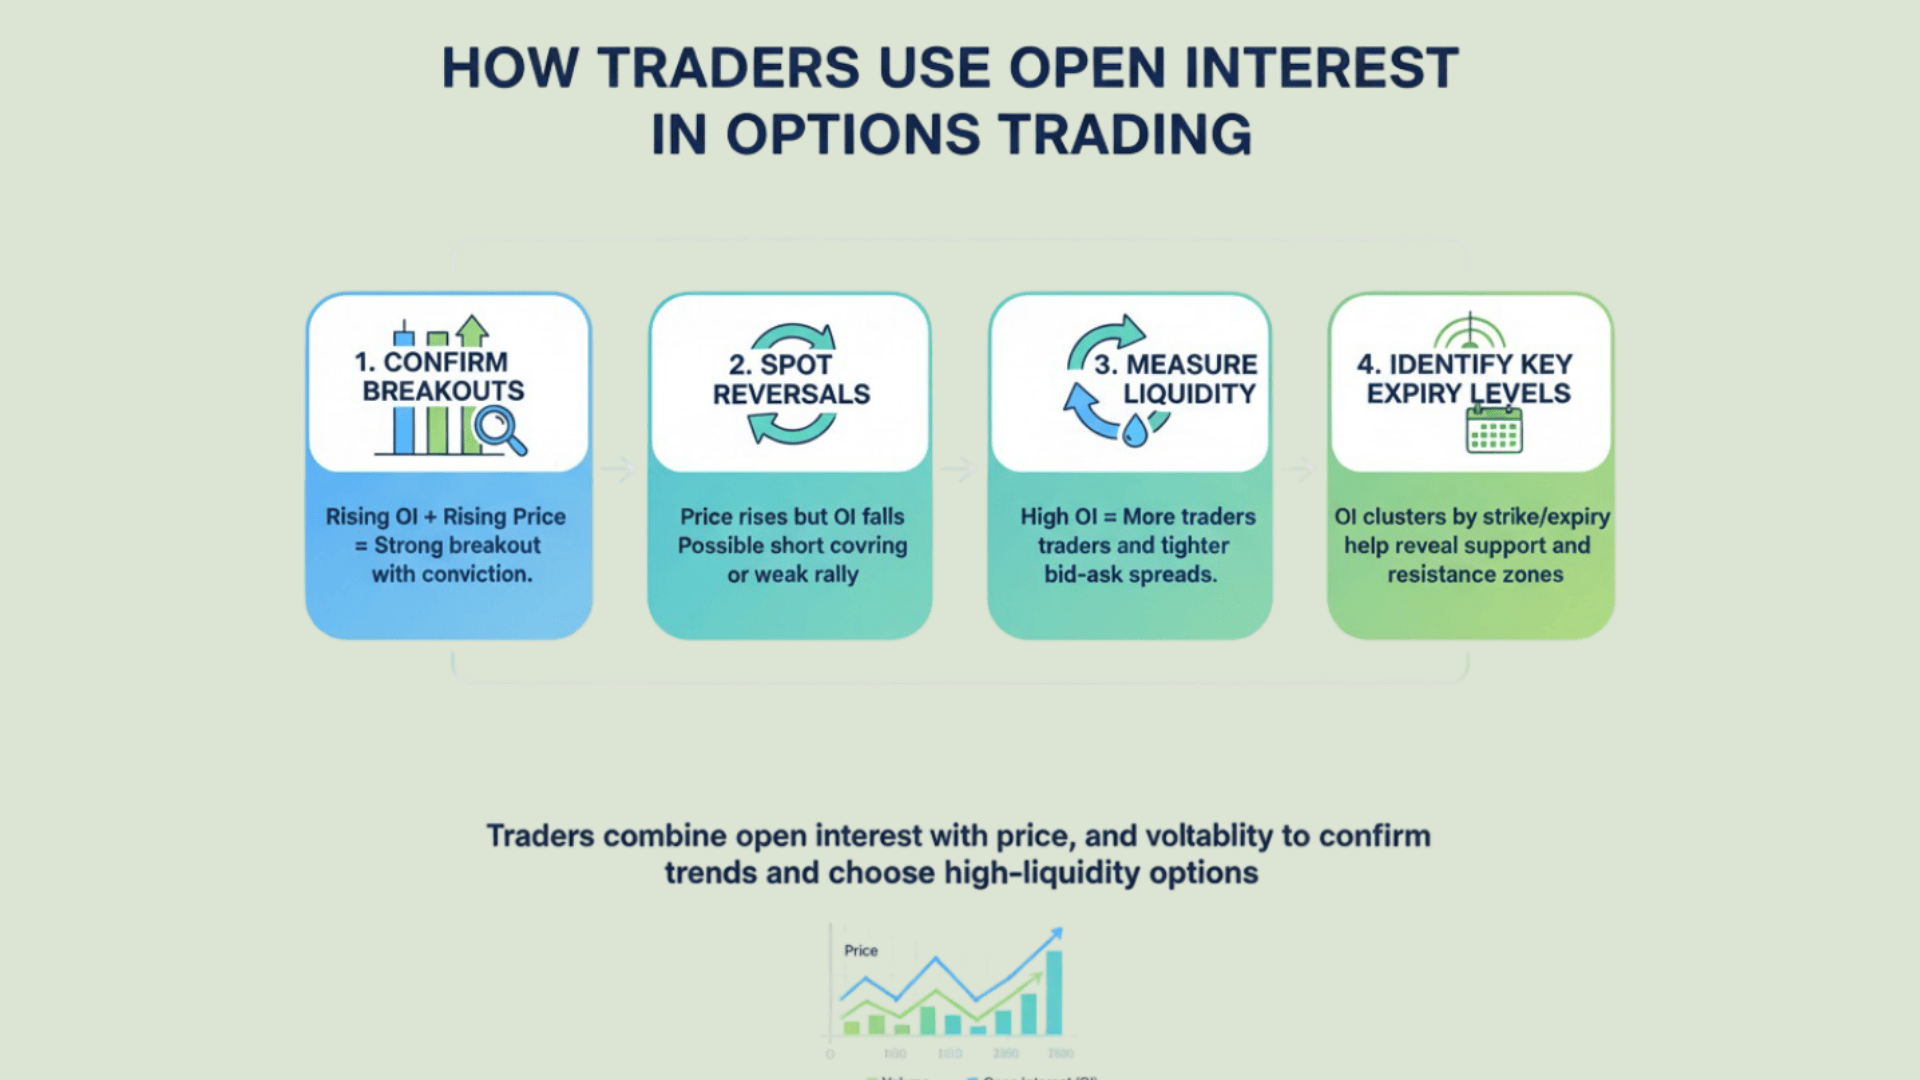
Open interest becomes powerful when you combine it with price, volume, and other data. Smart traders don’t rely on one metric alone. They stack indicators to make better decisions. Here’s how you can use open interest in real trading situations.
1. Confirming Breakouts
A breakout looks strong when price, volume, and open interest all rise together. This shows fresh participation. New money is entering the market. Traders are committed to the move.
If open interest stays flat or drops during a breakout, be cautious. The move might lack real support.
2. Spotting Reversals
Watch what happens when the price rises but open interest falls. This often means traders are covering short positions, not opening new longs. It’s a sign the rally might be temporary.
This setup can warn you of a short-term reversal. The momentum isn’t backed by new conviction. It’s just old positions being closed out.
3. Assessing Liquidity
Before you enter any trade, check these two things:
- Open interest above 500 to 1,000 contracts (for most U.S. stocks). This ensures enough activity for smooth execution.
- Bid ask spread under $0.10 to $0.20. Tight spreads mean lower trading costs and better fills.
Low open interest and wide spreads can kill your profits before the trade even moves in your favor.
4. Identifying Key Expiry Levels
OI heatmaps show you where large positions are stacked across strikes and expiration dates. These clusters reveal where volatility might spike as expiry approaches.
Traders use this info to anticipate price pinning, sudden moves, or profit-taking zones. Heatmaps make it easier to see the “hot spots” in the options chain at a glance.
Common Misconceptions About Open Interest
While open interest is a valuable indicator, it’s also one of the most misunderstood metrics in options trading. Let’s debunk some common misconceptions.
| Misconception | Reality |
|---|---|
| High OI = Bullish Market | Not always; it could be short positions. |
| Volume and OI always move together | They measure different things. |
| Low OI = Poor trade choice | Depends on expiry, spread width, and time frame. |
Tools to Track Open Interest
You don’t need fancy software to track open interest. Most popular trading platforms give you access to OI data right on the options chain. Here are some reliable sources you can use.
Platforms That Offer OI Data:
- CME Group – Great for futures and options data across major exchanges.
- Cboe (Chicago Board Options Exchange) – One of the best sources for raw options data and analytics.
- Interactive Brokers– Offers detailed OI breakdowns in the options chain and analytics tools.
- Thinkorswim – Includes OI data with charting features and custom scanners.
- TradingView – Lets you overlay OI data on price charts for visual analysis.
- Moomoo – Clean interface with OI metrics and heatmaps for quick scanning.
- Tastytrade – Built for options traders, with OI stats integrated into their platform.
Pro Tip:
Use an OI chart or heatmap to see where the biggest positions sit across strikes and expirations. Visual tools make it easier to spot support, resistance, and crowded levels at a glance.
Instead of reading numbers, you get a color-coded view of where the action is. This saves time and helps you make faster, smarter decisions.
Limitations of Open Interest Analysis
Open interest is useful, but it’s not perfect. Like any tool, it has gaps. Understanding these limits helps you avoid bad reads and poor decisions.
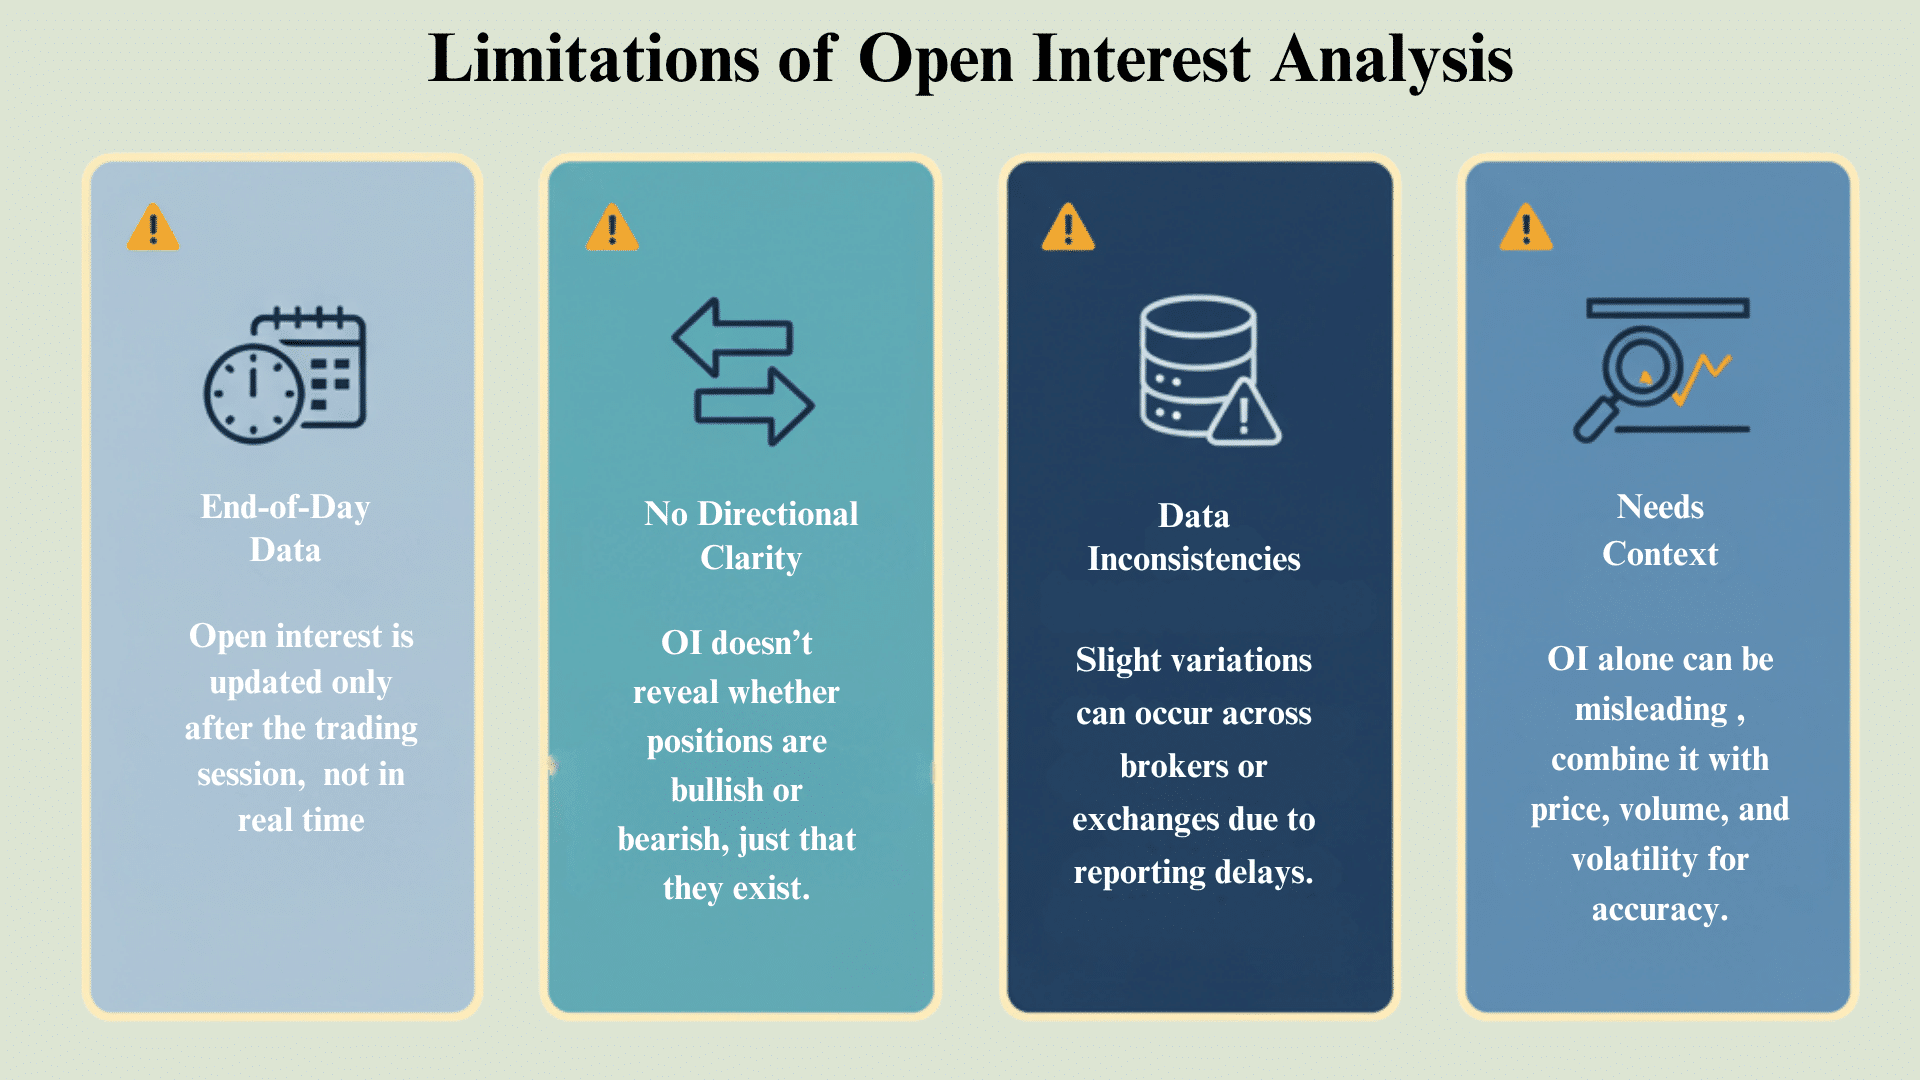
Key Limitations:
- End-of-day data – Open interest updates only after the market closes. You won’t see changes during the trading day. This makes it less helpful for intraday traders who need live feedback.
- No directional clarity – OI tells you how many contracts are active, but not whether they’re long or short. You can’t tell if traders are bullish or bearish just by looking at the number.
- Platform differences – Different brokers may show slightly different OI figures. This happens because of reporting times and data feeds. The differences are usually small, but they can confuse you if you compare platforms.
The Solution: Don’t rely on open interest alone. Always pair it with price action, volume, and implied volatility. When you combine these metrics, you get a fuller picture of what’s really happening in the market.
Final Verdict
Open interest gives you a behind-the-scenes look at market activity. It shows where traders are committed and how strong their positions are.
By tracking open interest alongside price and volume, you can confirm breakouts, spot reversals, and avoid illiquid options that hurt your performance.
It’s not a magic indicator, but when used right, it sharpens your analysis. Always check open interest before entering a trade. Look for strong participation, tight spreads, and clear trends.
The more you practice reading it, the better your timing and execution will become. Start paying attention to open interest today, and you’ll notice patterns others miss.
It’s a simple shift that can make a real difference in your trading results.