

Have you ever bought a stock right after a massive green candle appeared, only to watch the price immediately reverse and burn your capital? It is incredibly frustrating to think you have spotted a perfect trend reversal, only to realize you fell into a painful bull trap.
Many traders misinterpret the bullish engulfing pattern because they view it in complete isolation. You need proper market context to trade it successfully.
Today, you will find exactly how to identify a genuine pattern step-by-step. I break down the vital volume indicators, smart stop-loss placements, and key confirmation signals needed to protect your portfolio and trade with real confidence.
What is a Bullish Engulfing Pattern?
A bullish engulfing pattern is a two-candle reversal signal in which a small red candle is completely engulfed by a larger green candle, marking a shift from seller control to buyer control.
| ⚠️ Disclaimer: This article is for educational purposes only and does not constitute financial or investment advice. Always consult a qualified financial advisor before making investment decisions. |
Many traders misinterpret this pattern by reacting to the large green candle without considering market structure.
However, a bullish engulfing candle only gains meaning when it appears after a clear downtrend and is supported by confirmation signals such as volume and follow-through price action. A bullish engulfing candle only means something in context. On its own, it’s just two candles.
| Pattern Type | Bullish reversal |
| Best Timeframe | Daily chart (works on 4H and 1H, but with more false signals) |
| Signal | Buyers overpower sellers after a decline |
| Reliability | Moderate, confirm with volume and location |
| Confirmation Indicator | Volume spike, next candle closing higher |
What Bullish Engulfing Looks Like on the Chart
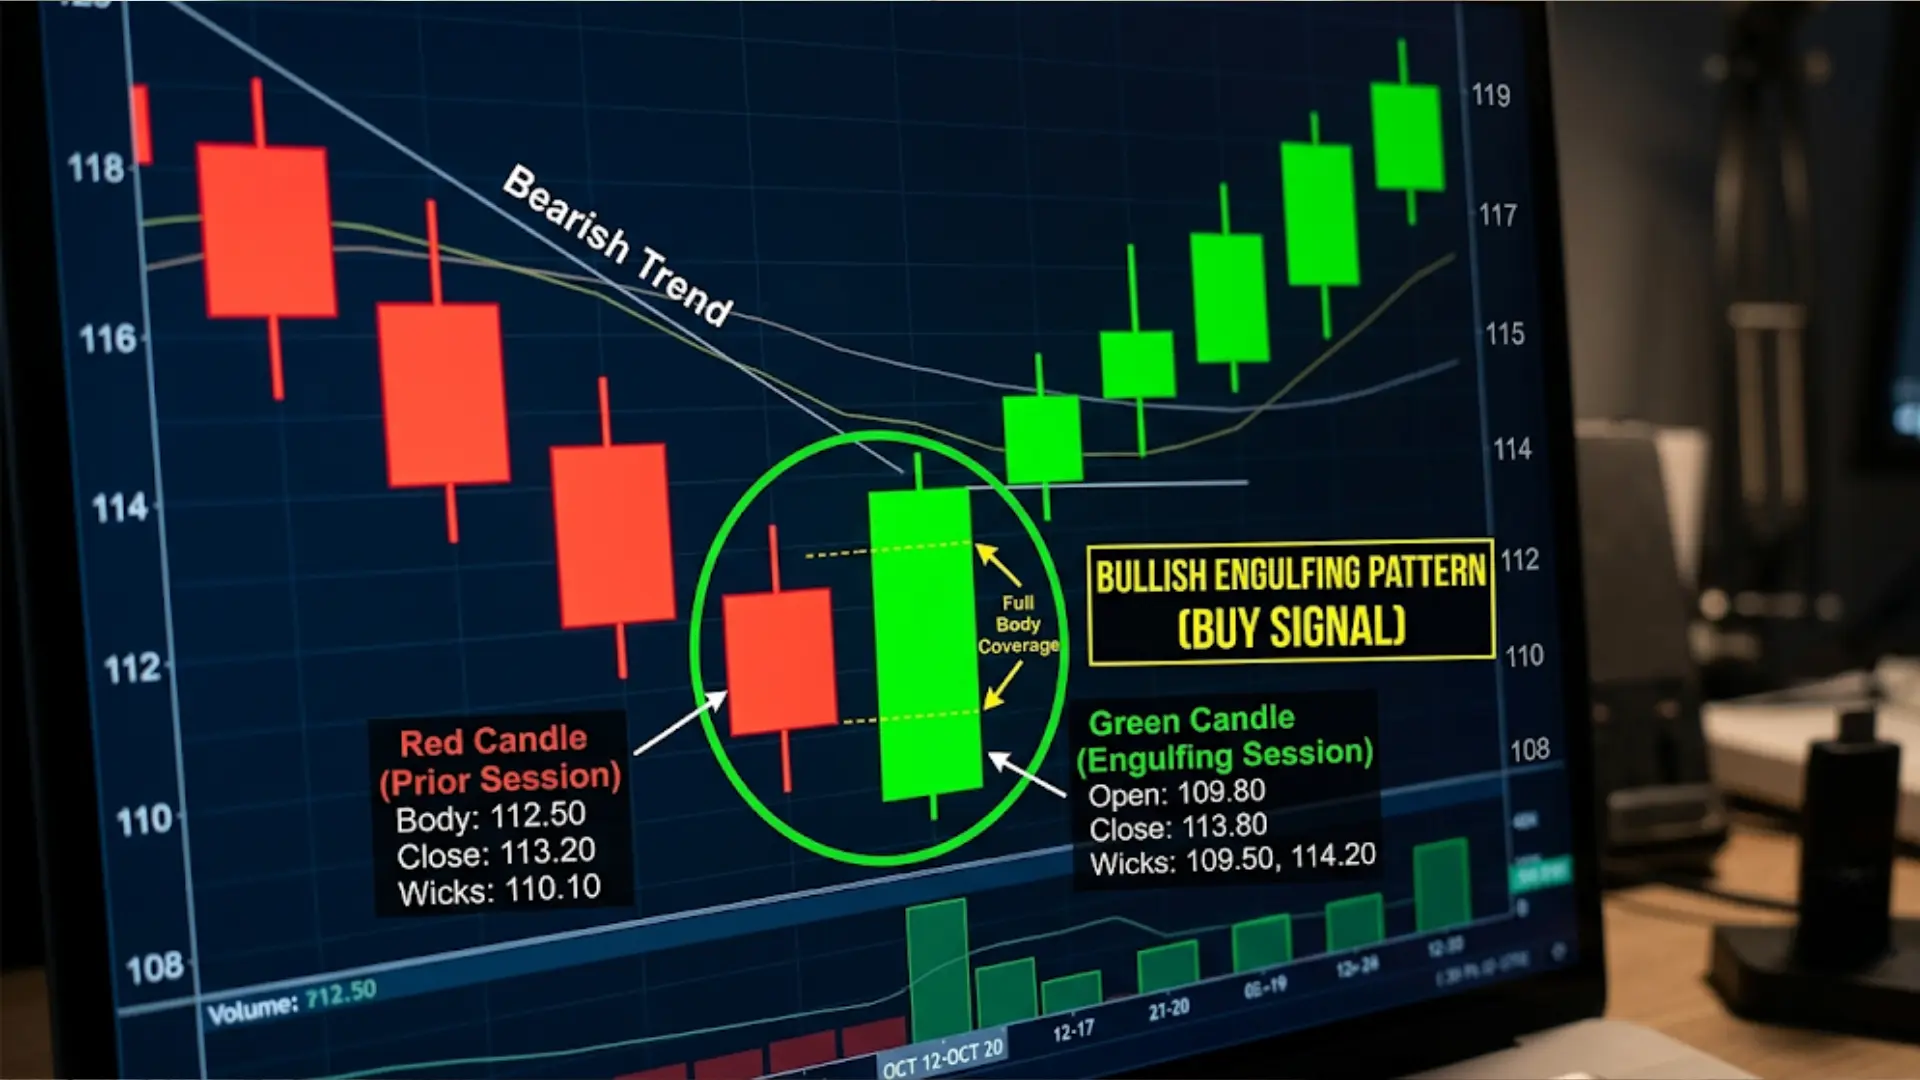
Picture a stock sliding lower for a few sessions. Each candle is red, closing below the previous one. Then, in one session, the price opens even lower than the prior close, which looks like more of the same. But buyers step in hard.
By the close, the price has not just recovered; it has pushed past the open of the previous red candle. The result is a green candle whose body fully covers the body of the red candle before it, top and bottom.
The size difference matters. A green candle that barely covers the red one is a weak signal. A green candle that dwarfs it, especially with a low-to-close move of 3% or more on a daily chart, tells you buyers didn’t just show up; they took control.
Single-session setups built around a reversal wick pattern work on a similar idea of rejection, but here it takes two full candle bodies changing hands to make the case, not just one long shadow.
How to Identify Bullish Engulfing Pattern
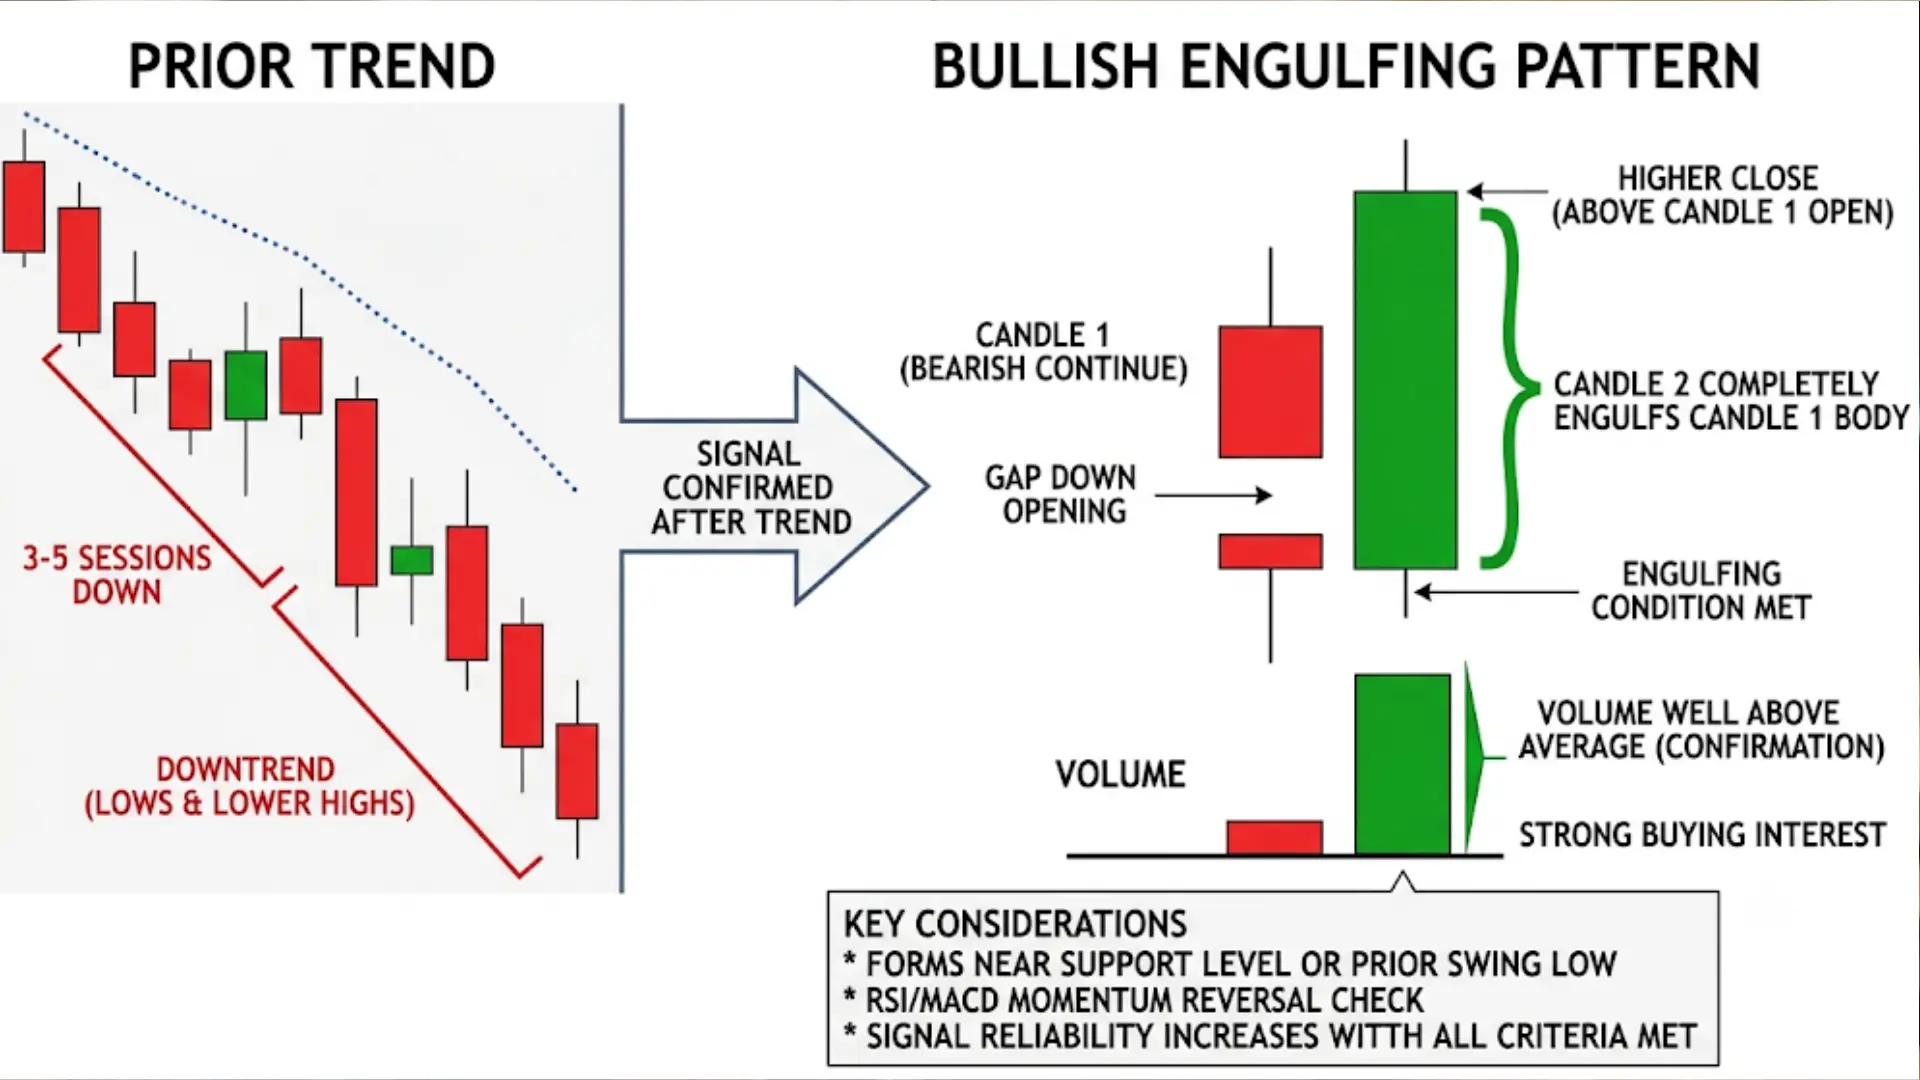
- Confirm an existing downtrend before the pattern forms. This may include lower highs and lower lows or price trading below a key moving average such as the 20-day EMA.
- Identify a bearish candle that continues the existing selling pressure. Avoid weak or indecisive candles, as they reduce pattern reliability.
- Observe the next candle’s open. Ideally, it should open at or below the previous close, showing continuation of bearish sentiment at the start.
- Confirm that the bullish candle closes above the previous candle’s open, fully engulfing the prior body and confirming the pattern structure.
- Check for increased volume during the engulfing candle. Higher volume suggests institutional participation rather than random price movement.
- Evaluate location. Patterns forming near support zones, prior swing lows, or psychological price levels are significantly more reliable.
- Note where the pattern forms. One near a known support level, a prior swing low, or a round number carries more weight than the same pattern forming in the middle of nowhere. Traders who watch RSI or MACD for a momentum reversal signal often use that as a second check before trusting the candle alone.
Where Bullish Engulfing Fits Into a Broader Strategy
The bullish engulfing pattern should never be treated as a standalone trading trigger. Instead, it works best as a confirmation signal within a broader market structure strategy.
Traders often combine it with support and resistance zones, trend-following indicators, or momentum tools such as RSI or MACD to validate potential reversals.
When this same pattern appears at the top of an uptrend, it loses its bullish meaning and can instead signal a bearish reversal candle, highlighting the importance of market context.
Entry, Stop Loss, and Target
Entry: Don’t buy the moment the candle closes. Wait for the next session to open and trade above the high of the candle. That confirms buyers are still pushing, not just reacting to a single session. Aggressive traders sometimes enter on the close of the candle itself, but that trades confirmation for speed.
Stop Loss: Place your stop below the low of the candle, not the low of the whole pattern. Add a small buffer, around 1-2% for stocks or a few ticks on lower timeframes, so normal wicks don’t shake you out. If the price closes back below that low, the setup is invalidated.
Target: Measure the height of the candle (high minus low) and project that distance upward from the breakout point for a first target. For a second target, look at the nearest resistance level or a prior swing high. Options traders often cross-check options positioning data around that resistance zone before deciding how far to let the trade run.
Common Mistakes Traders Make:
|
A Real Example: Sun Microsystems, January 2000
In early January 2000, Sun Microsystems (SUNW) had fallen sharply, trading well below its 20-day EMA after a steady slide. A bullish engulfing pattern formed at the bottom of that decline, and the very next session gapped up, confirming the reversal immediately.
The stock went on to rally into the mid-forties. A second bullish engulfing pattern appeared later that same month, this time after the stock pulled back to test support near its earlier gap-up, roughly a two-thirds retracement of the prior advance. That second setup also lined up with a moving average crossover forming around the same period, which added weight to the reversal case.
What’s worth noting: not every candle plays out this cleanly. In a study of 103 candlestick patterns, Thomas Bulkowski found the bullish engulfing candle acts as a bullish reversal only 63% of the time, ranking 22nd out of 103 for reversal reliability, though it’s one of the most common patterns you’ll see on a chart.
He also found something traders often miss: the strongest average price moves after this pattern tend to occur on downward breakouts in bear markets, not the upward continuation most traders expect. That’s a reminder to treat the pattern as a probability, not a promise, and to always wait for confirmation before sizing up a position.
Frequently Asked Questions
Can a bullish engulfing pattern work in crypto markets the same way as stocks?
Yes, but performance can vary. Crypto markets are more volatile, so bullish engulfing patterns form more frequently but also produce more false signals. They work best when combined with support zones and confirmation candles.
What timeframe is most reliable for bullish engulfing patterns?
Higher timeframes like 4-hour, daily, and weekly charts are generally more reliable because they filter out market noise. Lower timeframes can be used, but they require stronger confirmation signals to avoid false entries.
Should volume always confirm a bullish engulfing pattern?
Volume is not mandatory, but it significantly increases reliability. A bullish engulfing pattern with rising volume indicates stronger buyer participation, making the reversal more reliable than low-volume setups.
Can a bullish engulfing pattern be used in a sideways market?
It is not recommended because sideways markets lack strong directional momentum. In such conditions, the pattern often fails or produces weak moves, making trend-based filtering essential.
Is it better to enter immediately after the bullish engulfing candle closes?
Immediate entry is more aggressive and carries higher risk. Many traders prefer waiting for a confirmation candle to reduce false signals, even if it means a slightly later entry.
How often does a bullish engulfing pattern fail?
Failure rate depends on market context, but it is common in weak trends and low-volume conditions. Using proper filters, such as trend strength and support levels, helps significantly reduce the chances of failure.
Final Key Takeaways
Mastering candlestick charts requires moving past isolated signals and looking at the broader market picture.
A bullish engulfing setup is a powerful tool, but it only works when you pair it with an established downtrend, strong volume, and patience for confirmation from the next session.
By placing strategic stop losses and targeting logical resistance levels, you can effectively manage risk and avoid emotional traps. I always remind myself that trading is about probabilities, not absolute certainties.
Applying these disciplined steps will protect your capital while helping you spot genuine market turns. What has been your experience trading this reversal setup? Share your thoughts in the comments below or try these tips today.