Ever watched a stock slide lower and lower but felt like the decline was losing steam? That moment when selling pressure seems to fade creates opportunities most traders completely overlook.
The market often whispers its next move through momentum indicators before prices actually turn around. I’m going to teach you how to read these whispers and act on them confidently.
You’ll learn to spot when downtrends are exhausted and position yourself for the bounce. Mastering bullish divergence gives you an edge that separates profitable traders from those who chase moves too late. Let me show you exactly how to find and trade these setups step by step.
This content is for informational purposes only. Always consult a licensed financial professional before making any investment decisions.
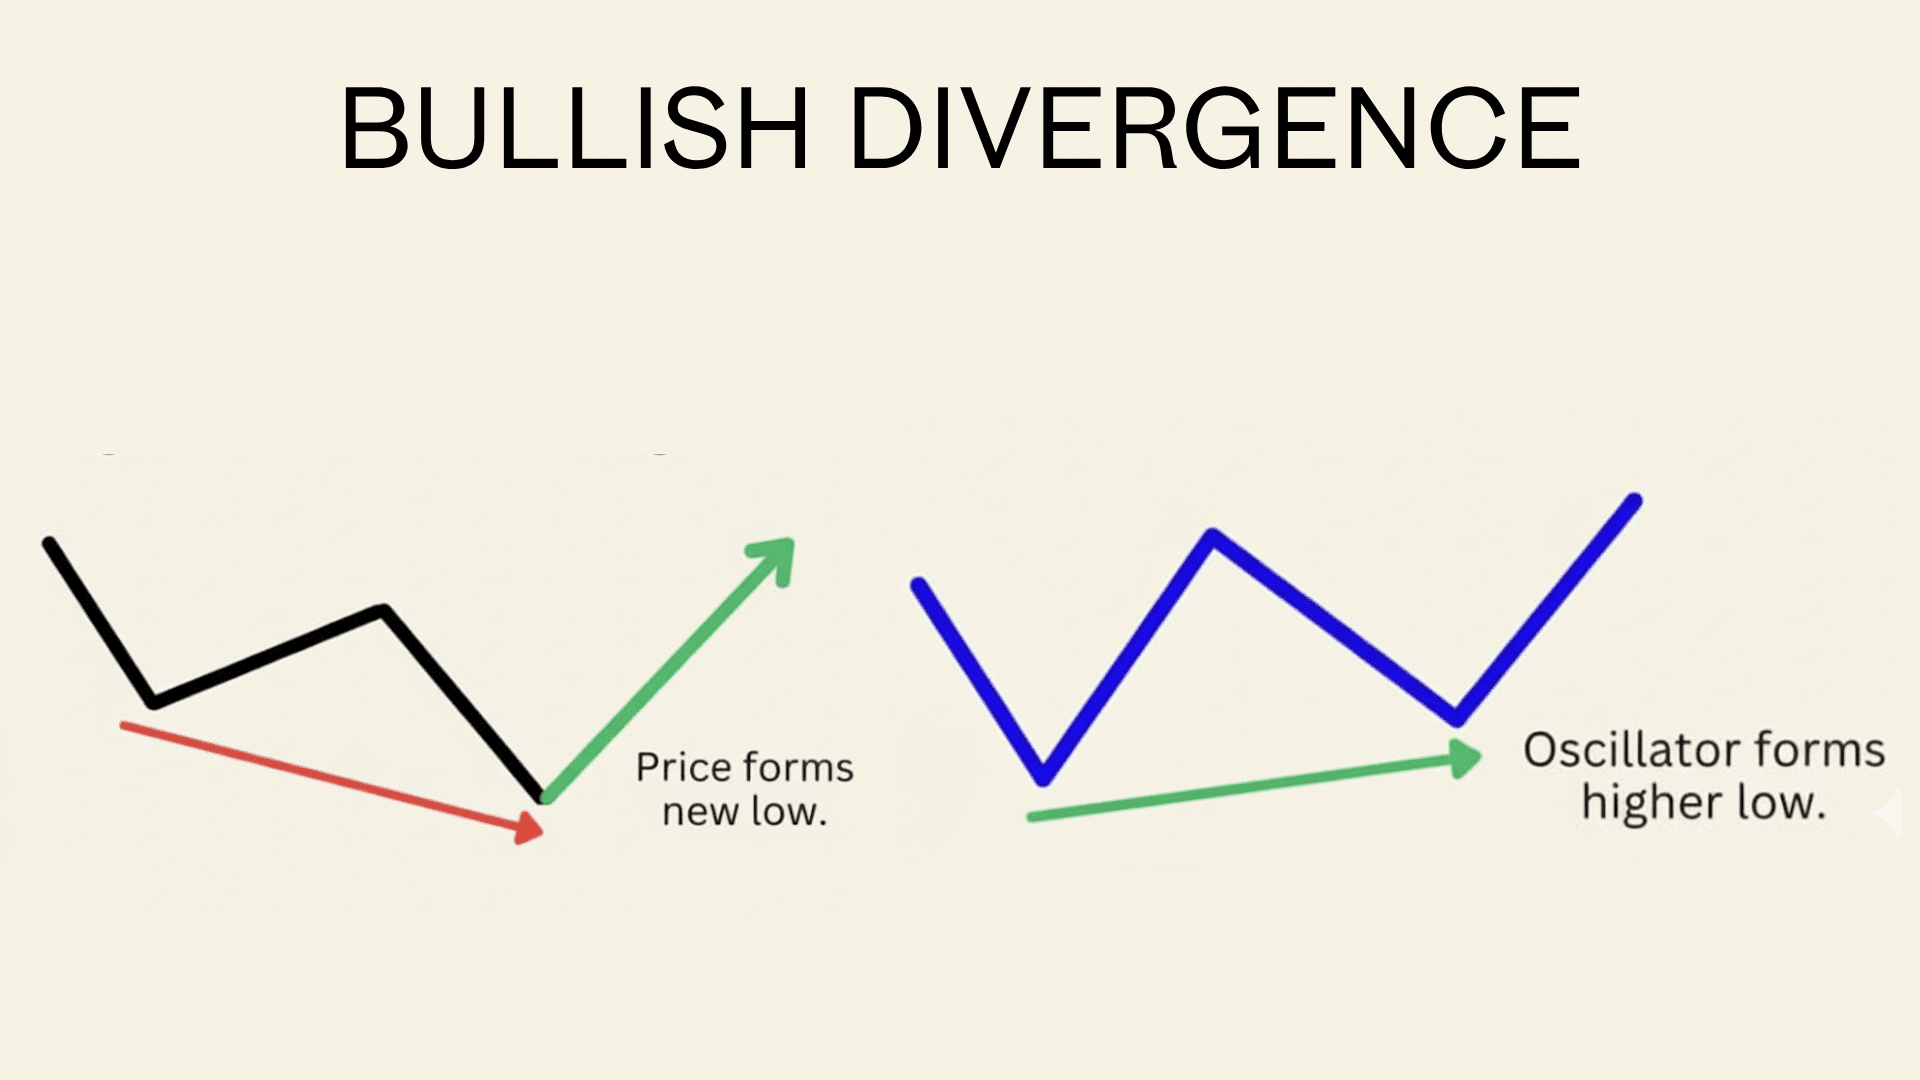
What is Bullish Divergence?
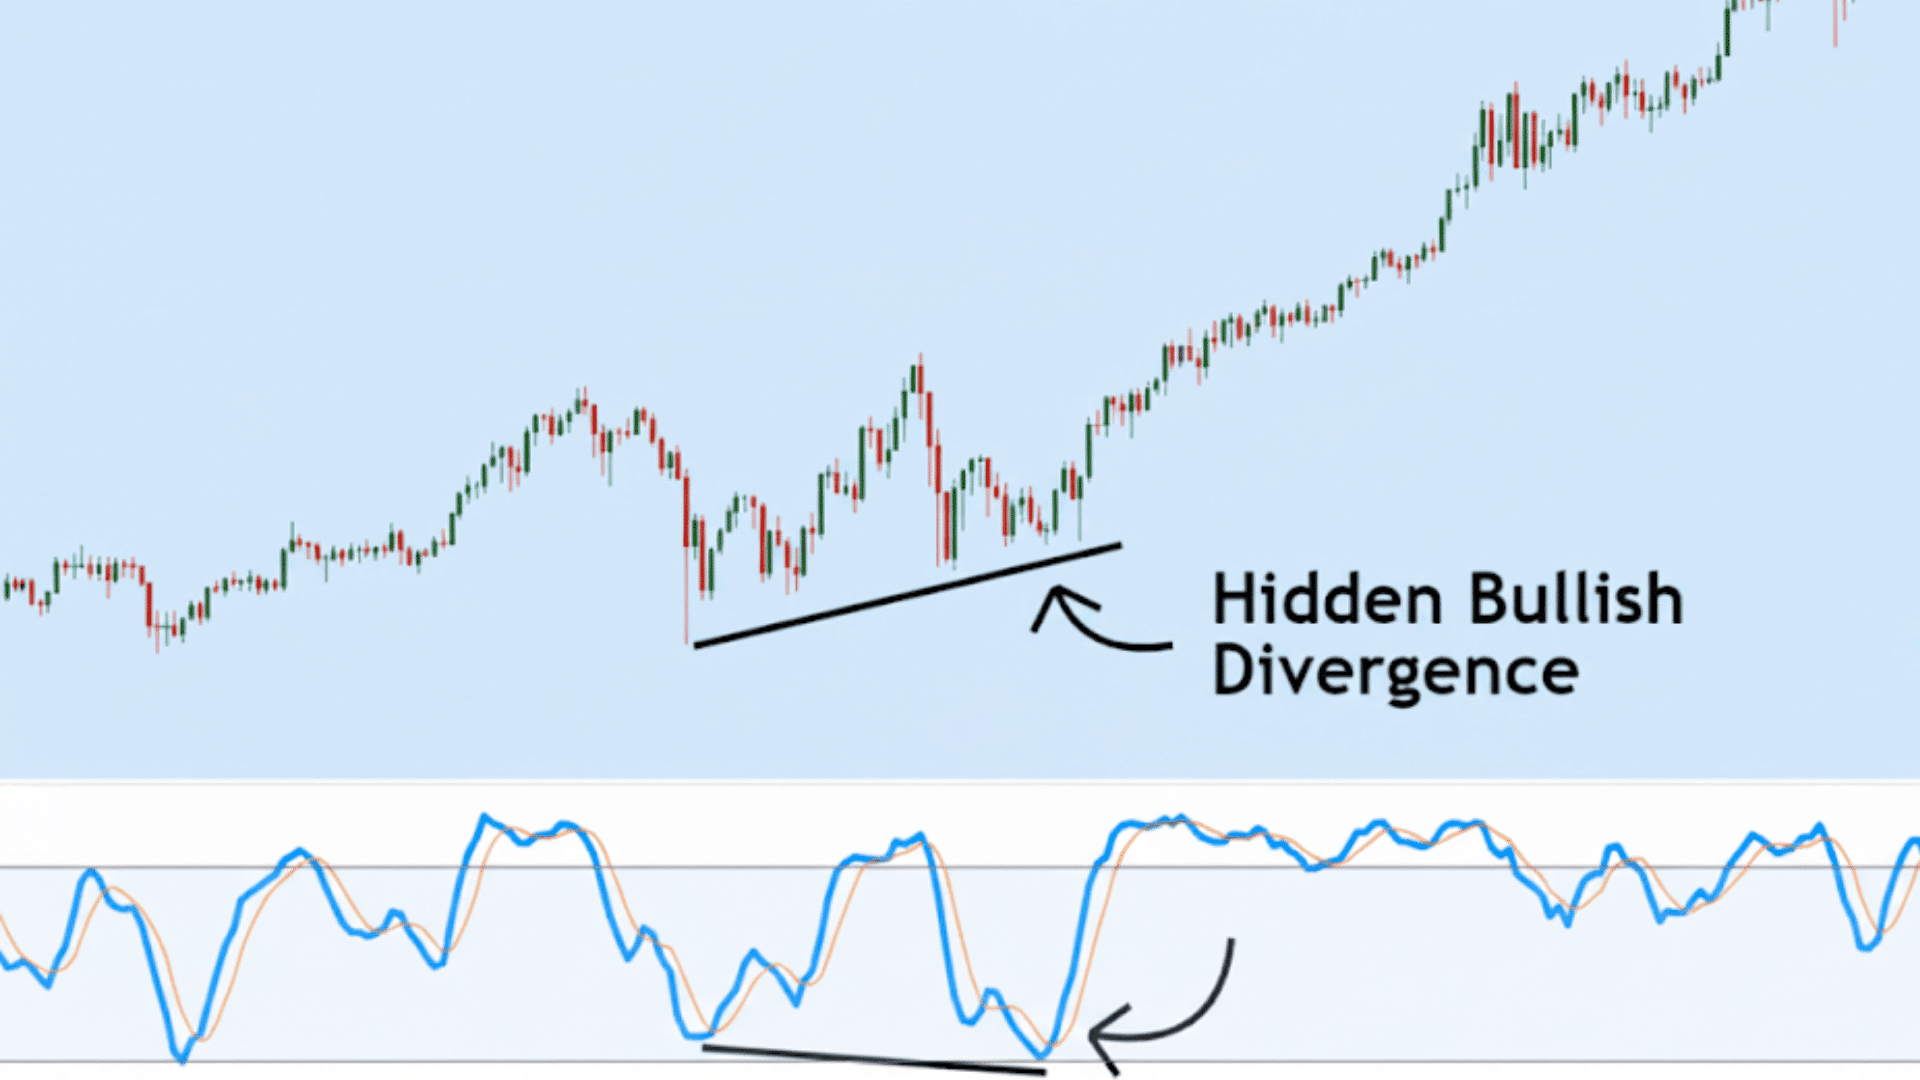
Bullish divergence happens when a price keeps dropping but an indicator like RSI or MACD starts climbing. It means the selling power is weakening even though prices show lower lows. Traders look for this as a hint that the downtrend might end soon.
Common indicators used to spot bullish divergence include the Relative Strength Index (RSI), Moving Average Convergence Divergence (MACD), and Stochastic Oscillator, which track momentum differently.
When price and indicator trend in opposite ways, it suggests buyers might step in soon. This signal helps traders prepare for a possible price rise ahead.
The Role of Bullish Divergence in Spotting Market Turns
Bullish divergence helps you catch reversals before most traders even notice them. It shows when momentum shifts in your favor while prices still look weak. Here’s how this powerful signal plays a key role in spotting market turns:
1. Trend Reversal Signal
Bullish divergence signals a possible change from a falling to a rising price trend. When price makes lower lows, but the indicator shows higher lows, it hints that selling pressure is fading.
This mismatch tells traders the downtrend could end soon, and an uptrend might start. Spotting this helps traders prepare and enter trades early in a new bullish move. It is a key early warning that many traders use to spot turning points before prices rally.
2. Indicates Weakness in Selling Pressure
When buying momentum starts growing even while prices fall lower, it means sellers are losing strength. The indicator’s higher lows show that downside pressure is weakening.
This suggests buyers may soon gain control, or sellers are tired. Recognizing this helps traders avoid jumping on a falling price too late. It also gives clues that the asset may soon stop dropping and start to move up.
3. Reliable Confirmation Tool
Bullish divergence is best used with other signals to reduce mistakes. Traders often combine it with volume, support levels, or candlestick patterns. Confirmations make the reversal signal stronger and more trustworthy.
This way, traders improve their chances of success, limiting false alarms. Using multiple tools makes bullish divergence a useful part of a well-rounded trading plan.
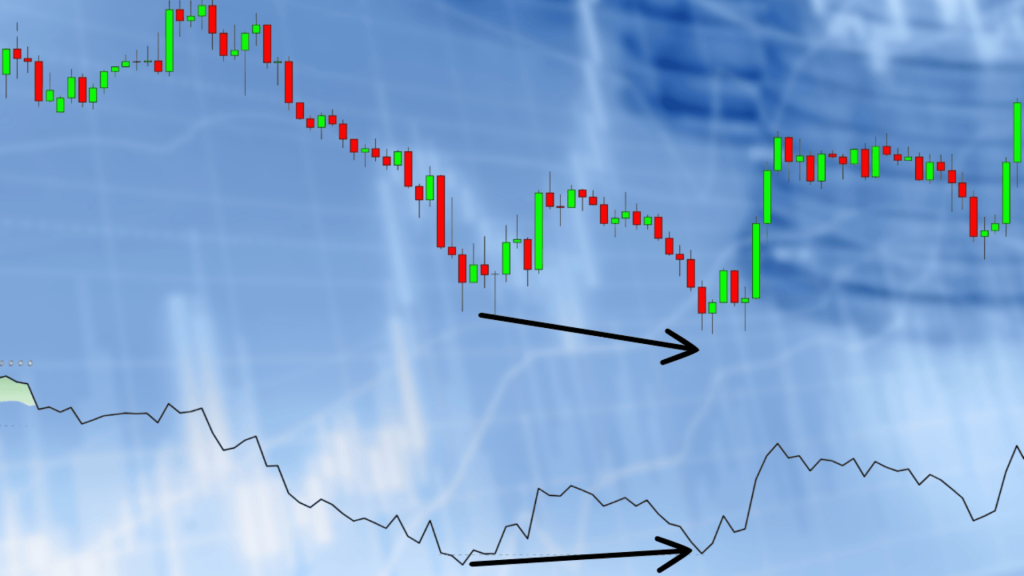
How to Identify Bullish Divergence in Price Charts?
Spotting bullish divergence on your charts doesn’t require advanced skills or expensive tools. You just need to follow a clear process and stay patient while scanning. Here are the five steps to identify bullish divergence accurately:
- Find lower lows in price action: Look at the price chart and identify where it’s making new lows below previous lows.
- Check your momentum indicator: Open RSI, MACD, or Stochastic and look at the same time period on the indicator.
- Spot higher lows on the indicator: Notice if the indicator is making higher lows while the price makes lower lows.
- Draw connecting lines: Draw a line connecting the price lows and another line connecting the indicator lows to see the divergence.
- Confirm with volume and support: Check if volume is dropping on each price low and if the price nears a support level.
Practice these steps on past charts first before risking real money. Start with daily timeframes since they give clearer signals than shorter periods.
Bullish Divergence Trading Strategies
Trading bullish divergence requires a clear plan for entries, exits, and risk management. You need specific strategies to turn this signal into actual profits consistently. Here are the key trading strategies you should follow when using bullish divergence:
1. Entry Points
Wait for price confirmation before entering your trade after spotting bullish divergence. Look for a candlestick pattern like a bullish engulfing or hammer.
You can also wait for price to break above a short-term trendline. Some traders enter when price crosses above a moving average after divergence forms. This confirmation reduces false signals and improves your success rate.
2. Stop Loss and Risk Management
Always place your stop loss below the most recent swing low that formed the divergence. This protects you if the divergence fails and price continues falling.
Risk only one to two percent of your trading account on each trade. Calculate your position size based on the distance between entry and stop loss. Proper risk management keeps you in the game even when trades fail.
3. Exit Points
Set your first profit target at the nearest resistance level above your entry point. You can exit half your position there and let the rest run higher.
Use a trailing stop to lock in profits as price moves in your favor. Some traders exit when RSI reaches overbought territory above seventy. Always have an exit plan before entering any trade.
4. Combining with Other Indicators
Bullish divergence works best when you confirm it with multiple technical tools together. Check if price is near a strong support level or Fibonacci retracement zone.
Look for increasing volume when price starts to reverse after divergence appears. Add moving averages to see if price bounces off a key average. Combining tools filters out weak signals and gives you higher probability setups.
5. Divergence with Multiple Indicators
Using RSI and MACD together gives you stronger confirmation than relying on just one indicator alone. Check if both indicators show higher lows while price makes lower lows simultaneously.
When multiple indicators agree, the bullish divergence signal becomes more reliable. This approach filters out weak signals that often fail in real trading.
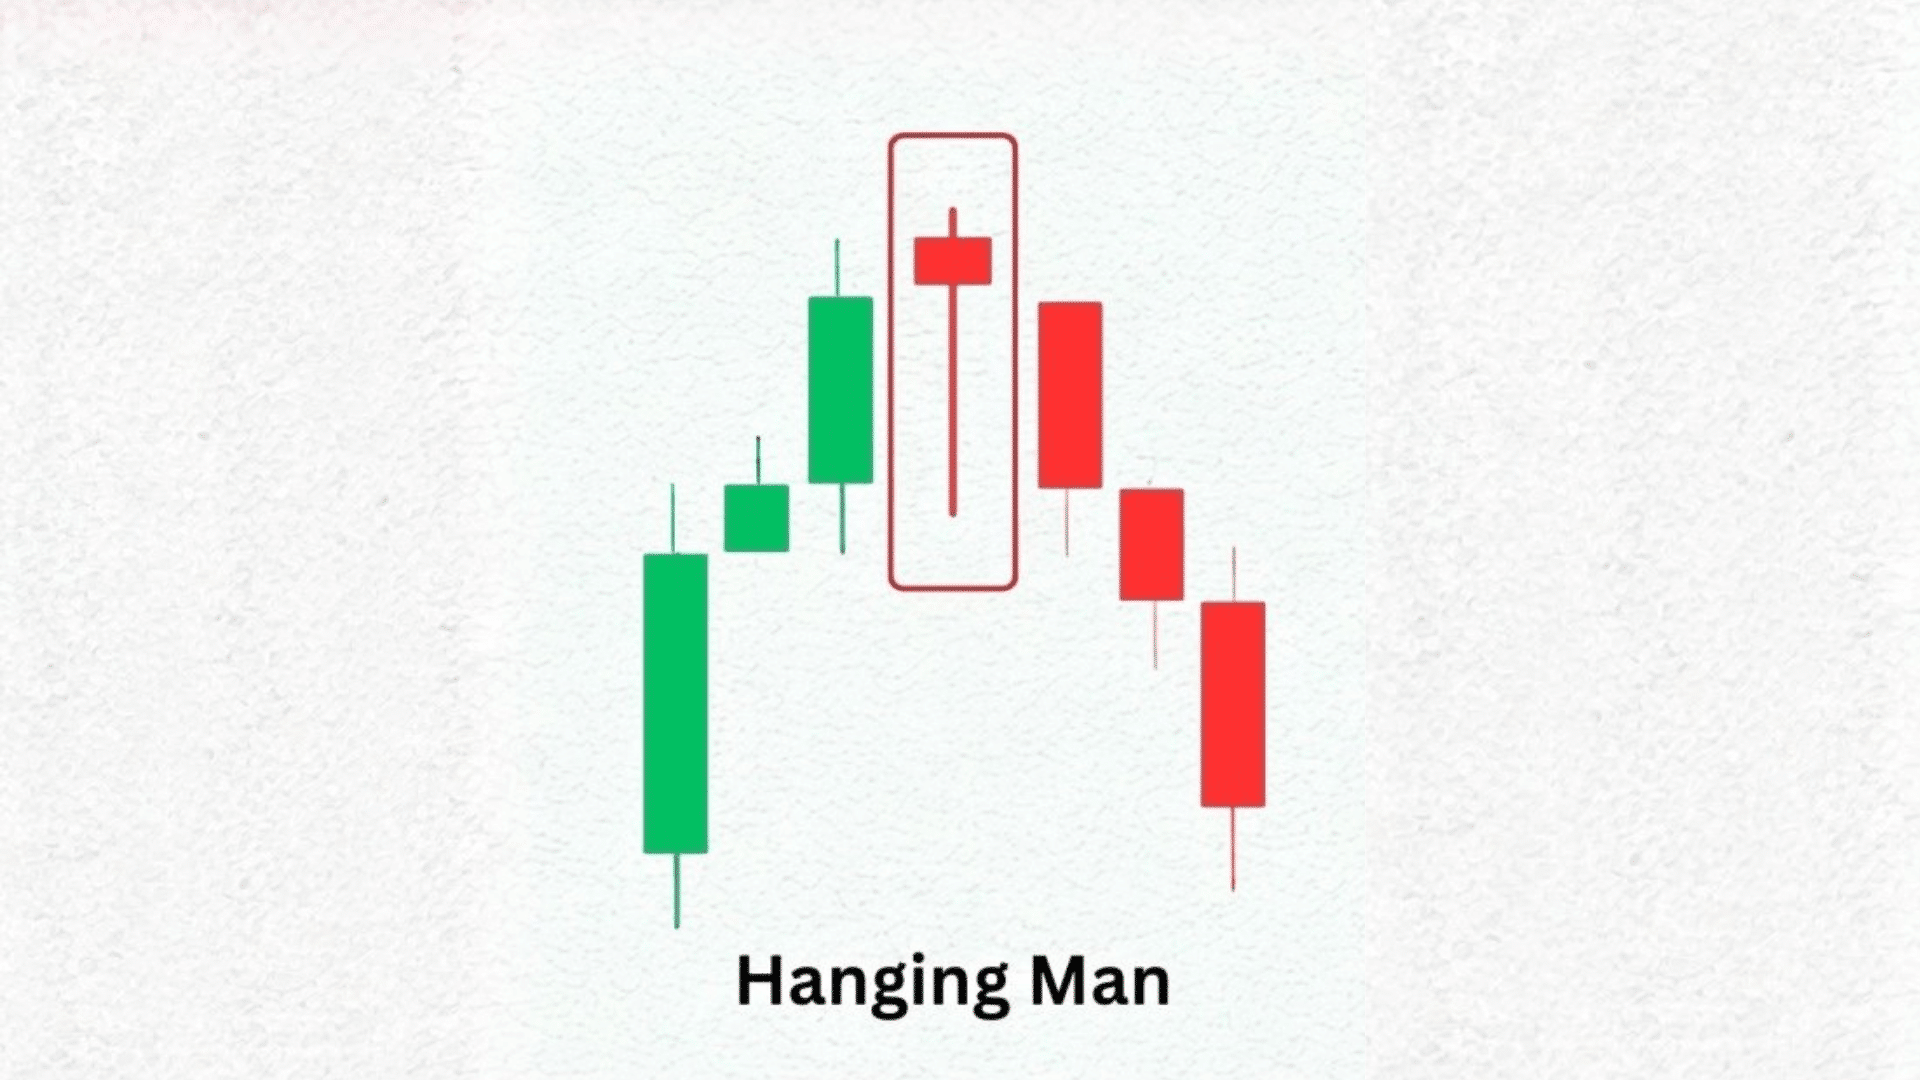
6. Divergence with Candlestick Patterns
Combining bullish divergence with candlestick reversal patterns increases your confidence in taking the trade. Look for a hammer or bullish engulfing candle forming at the divergence point.
These patterns show buyers stepping in strongly after selling pressure weakens. Wait for the candlestick pattern to complete before entering your position for confirmation.
7. Divergence in Different Timeframes
Bullish divergence behaves differently on short-term charts compared to longer timeframes like daily or weekly. Short-term divergences give quick signals but produce more false alarms.
Daily and weekly divergences are more reliable but take longer to develop. Check higher timeframes first to see the bigger trend before trading.
Bullish Divergence: Weighing the Pros and Cons
Bullish divergence offers clear advantages but also comes with important limitations you need to understand. Knowing both sides helps you use this tool wisely and avoid costly mistakes. Here’s a balanced look at the benefits and risks of trading with bullish divergence:
| Pros | Cons |
|---|---|
| Bullish divergence helps you identify potential trend reversals with greater accuracy by showing momentum shifts before price changes direction. | Bullish divergence can sometimes lead to false signals, especially in choppy or sideways markets where trends are unclear. |
| This indicator helps you enter early in the uptrend, potentially increasing profit opportunities by catching reversals before most traders notice them. | You must wait for confirmation before acting on bullish divergence, such as additional technical indicators or price action patterns for validation. |
| Spotting bullish divergence assists you in timing your entries more effectively, helping you avoid entering too late and missing profitable moves. | This strategy may not always provide reliable signals in all market conditions, which is why using other tools alongside it is crucial. |
Understanding these benefits and risks helps you set realistic expectations when trading bullish divergence. Always combine this signal with proper risk management and other technical tools for better results.
Case Study: Real-World Example of Bullish Divergence
Apple stock demonstrated bullish divergence during March 2020 when price made lower lows near two hundred twenty dollars while RSI formed higher lows.
Traders entered long positions after price broke above resistance at two hundred forty dollars with volume confirmation. Stop losses were placed below the swing low at two hundred fifteen dollars.
Research by Thomas Bulkowski analyzing 994 stocks found that bullish divergence in bull markets outperformed the S&P 500, with stocks gaining 4.9% versus 3.3% over three months Bulkowski on Testing Divergence.
However, his study showed bullish divergence wins only 45% to 48% of the time Bulkowski on Testing Divergence. This trade succeeded as Apple rallied past three hundred dollars within eight weeks.
Stocks to Watch: Possible Bullish Divergence Setups
Several major stocks are currently showing signs of bullish divergence across different sectors right now. These setups could present early entry opportunities before momentum shifts become obvious to most traders. Here are five stocks worth watching for potential bullish divergence signals:
| Stock Symbol | Company Name | Sector | Reason for Potential Bullish Divergence |
|---|---|---|---|
| AMD | Advanced Micro Devices | Technology | Recent price dips with strengthening RSI momentum |
| TSLA | Tesla Inc. | Consumer Discretionary | Lower lows in price but higher lows in MACD |
| NVDA | NVIDIA Corporation | Technology | Volume increases while price makes new lows |
| PFE | Pfizer Inc. | Healthcare | Stochastic Oscillator showing higher lows on pullbacks |
| AAPL | Apple Inc. | Technology | Divergence noted in RSI despite price drops |
Remember to verify these signals yourself using your own charts and technical analysis tools. Always wait for confirmation through price action or volume before entering any position based on these observations.
Summing It Up
You now have a proven framework for reading momentum shifts that precede major price reversals. Remember that combining multiple confirmation signals always beats relying on any single indicator alone.
Practice identifying these patterns on historical data before putting real money at risk in live markets. The key to success with bullish divergence lies in patience and proper risk management every single time.
Start small with your position sizes until you build consistent results over multiple trades. Keep a trading journal documenting each setup you find and how it played out afterward.
I track every trade to improve my timing, and you should do the same for better results. Drop a comment below about your experience spotting these signals or questions about your own charts.