

Ever wondered how companies pay for their operations and growth? They use two main sources: borrowed money and owner investments. The debt-to-equity ratio tells you the balance between these two. It’s one of the most important numbers in finance.
This ratio helps investors spot risky companies. It helps lenders decide on loan terms. Business owners use it to plan their funding strategy. But here’s the catch: there’s no magic number that works for everyone.
A ratio of 1.5 might be perfect for a manufacturing firm, but terrible for a tech startup. Industry matters. Growth stage matters. Cash flow matters.
In this guide, you’ll learn how to calculate this ratio, what debt counts, and how to interpret the results correctly.
What is the Debt-to-Equity Ratio?
The debt-to-equity ratio measures how much debt a company uses compared to its equity. Think of it as a financial health check. A higher ratio means the business relies more on borrowed money.
A lower ratio shows it depends more on owner investments. But here’s the thing: this number alone won’t tell you everything.
You need to look at the industry type, growth stage, and cash flow, too. Context matters a lot when judging if a company’s debt level is risky or reasonable.
Debt-to-Equity Ratio Formula
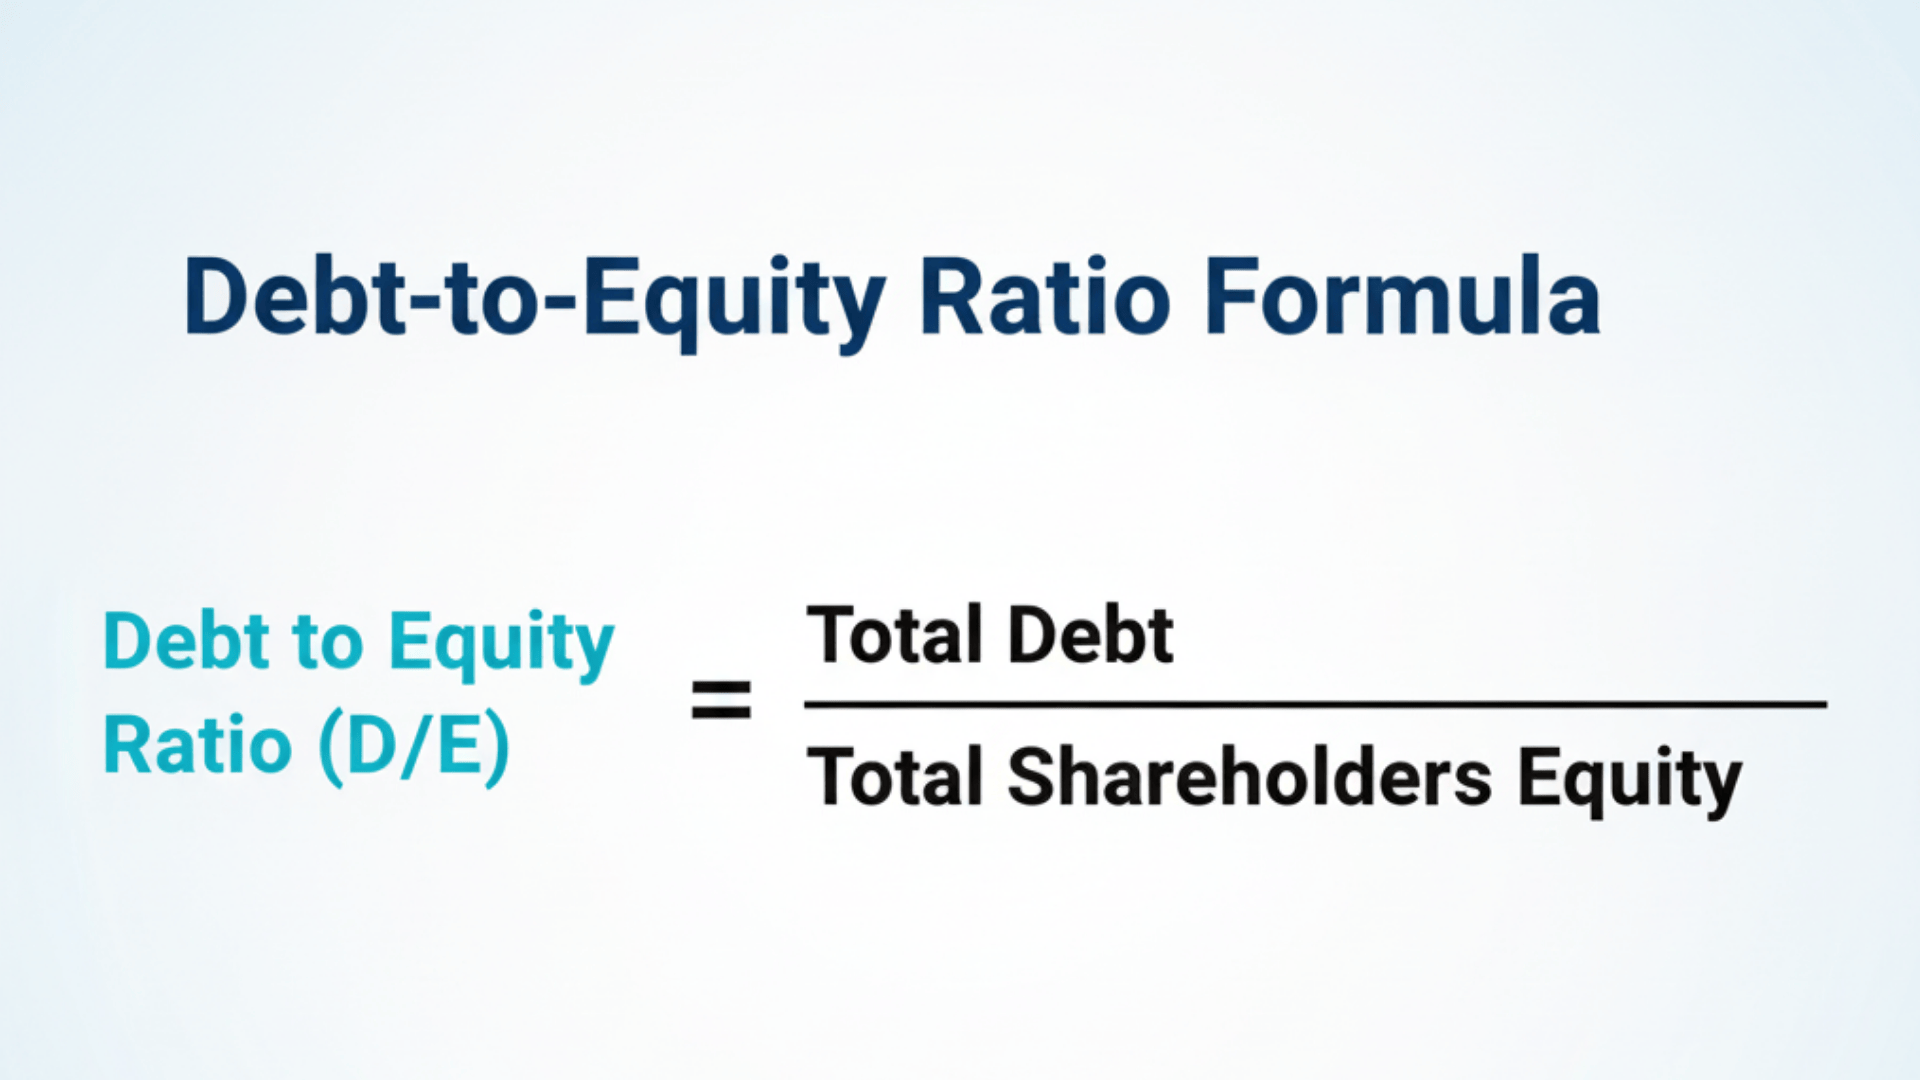
Debt-to-Equity Ratio = Total Debt ÷ Shareholders’ Equity
This formula shows you how much a company borrows compared to what it owns. According to the Corporate Finance Institute, you add up short-term debt, long-term debt, and fixed payment obligations.
Then divide that total by shareholders’ equity. The result tells you the balance between borrowed money and owner investments.
Step-by-step calculation
Step 1: Find Total Debt: Look at the balance sheet. Add short-term debt and long-term debt together. This gives you the total borrowed amount.
Step 2: Find Shareholders’ Equity: Check the balance sheet again. Add common stock, retained earnings, and paid-in capital. This shows what the owners have invested.
Step 3: Divide Debt by Equity: Take your total debt number. Divide it by shareholders’ equity. This gives you the ratio.
Step 4: Interpret the Result: A ratio of 0.8 means the company has $0.80 in debt for every $1 of equity. A ratio of 2.0 means $2 in debt for every $1 of equity. Higher numbers mean more borrowing.
What Debt is Included in the Debt-to-Equity Ratio (and Why It Matters)
Not all liabilities count as debt when you calculate this ratio. Some items belong in the formula. Others don’t. Knowing which ones to include helps you get an accurate picture of financial risk. The type of debt matters too. Some debts create more pressure than others.
Debts Typically Included
- Short-term debt: Notes payable, credit lines, and current portions of long-term loans that are due within a year.
- Long-term debt: Bonds, mortgages, and bank loans that extend beyond one year.
- Capital leases or fixed-payment obligations: These create long-term liabilities and count as debt.
Items Often Excluded
- Accounts payable and accrued expenses: These are operational costs, not financing debt.
- Deferred revenue: Advance payments from customers, not borrowed money.
- Net debt adjustments: Some analysts subtract cash and equivalents to show true leverage.
Types of Debt and Their Impact
| Debt Type | Impact on Risk |
|---|---|
| Financial debt (bank loans, bonds) | Increases fixed interest costs and leverage risk |
| Operating or trade debt | Short-term and lower risk in stable businesses |
| Convertible debt or preferred stock | Blurs the line between debt and equity |
| Short-term obligations | Creates liquidity pressure if due soon |
| Long-term obligations | Increases interest exposure over time |
Key Insight: Two companies might show similar total liabilities on paper. But their actual risk levels can differ greatly. One might rely on trade credit, which is safer. The other might carry heavy bond debt with high interest rates. Always check what’s included in the debt number before comparing companies. Consistent definitions matter when judging true financial health.
Why the Ratio Matters?
The debt-to-equity ratio shows how a company funds itself. Is it using more borrowed money or owner investments? This matters to everyone.
Investors watch it because high debt means higher risk during tough times. More debt means more required payments. Lenders check it to decide if they should loan money and at what interest rate.
Management uses it to plan growth and choose the best way to raise funds. In short, this ratio helps everyone judge financial health and make smarter decisions.
What Is a Good Debt-to-Equity Ratio?
General guideline
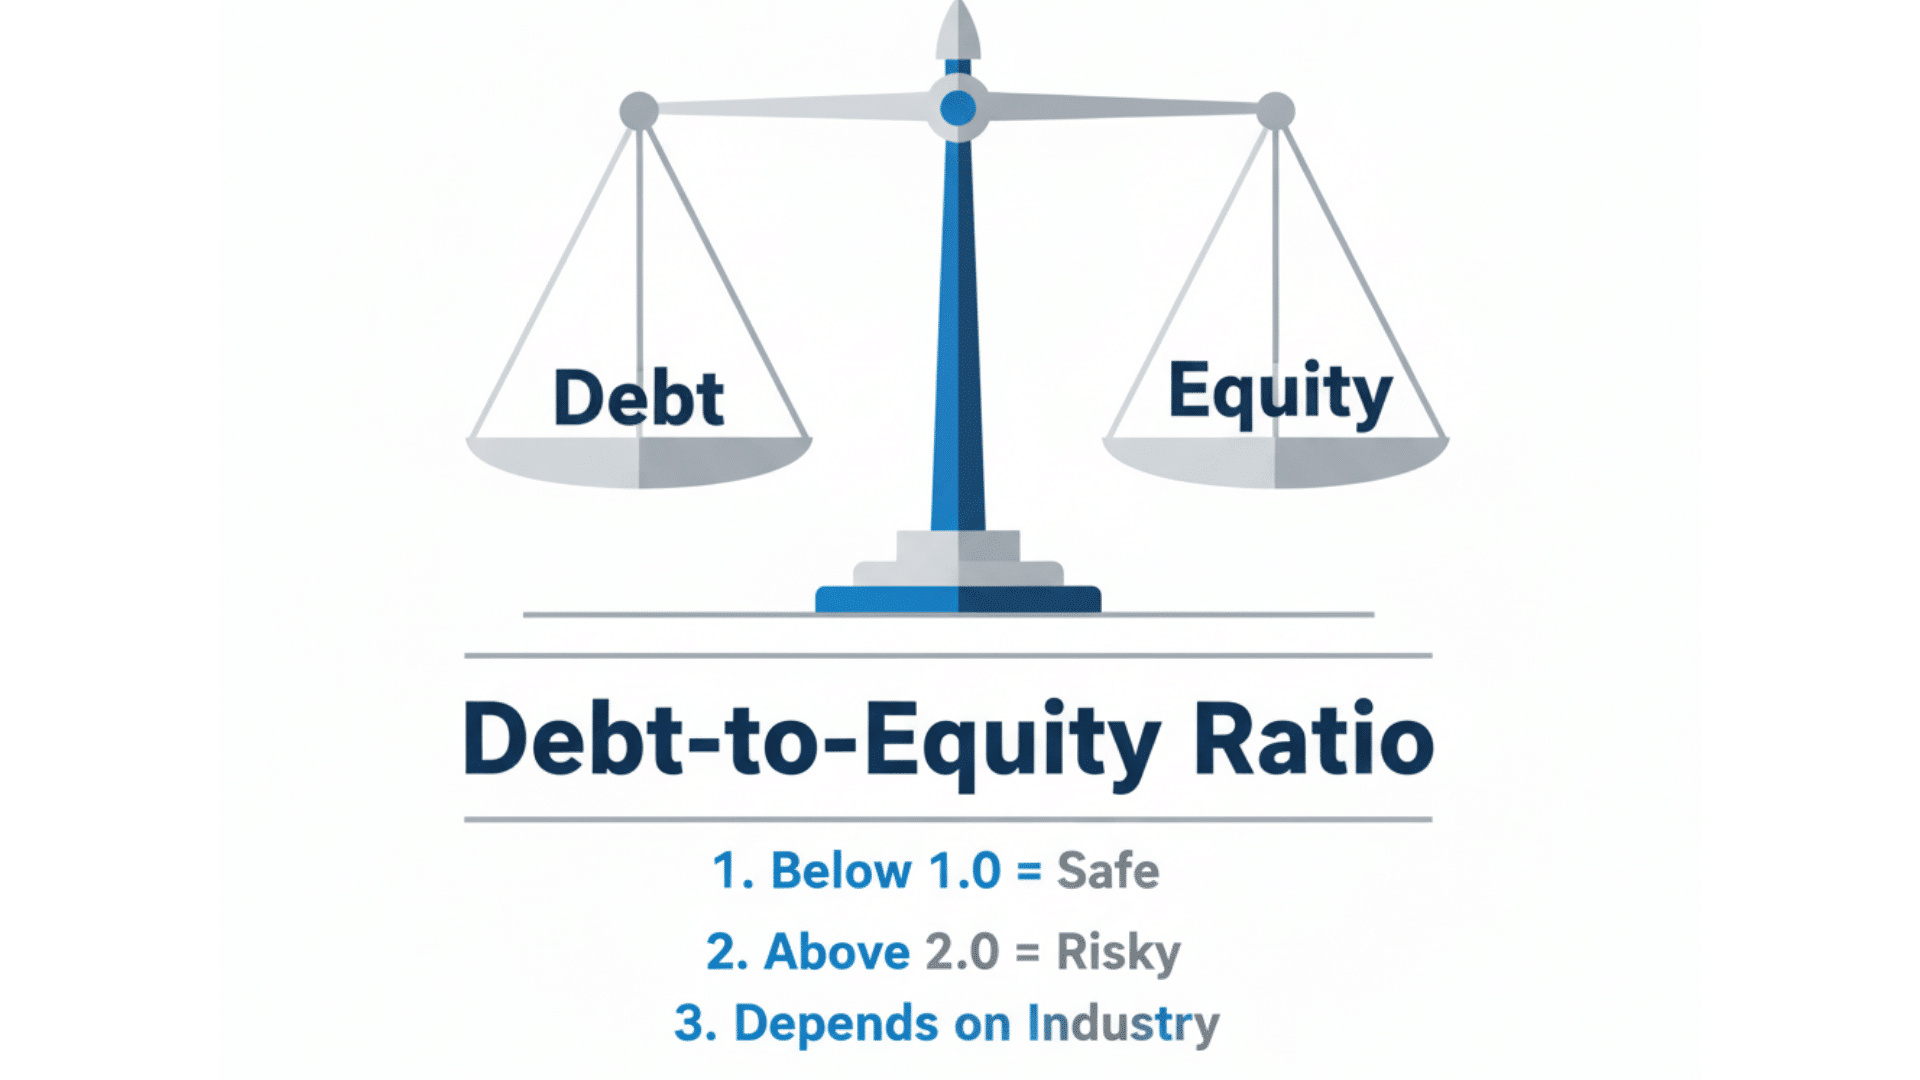
Most analysts consider a ratio below 1.0 as safe and conservative. This means the company has less debt than equity. A ratio above 2.0 often signals higher risk, though it’s not always bad.
For example, a ratio of 2.0 means the firm uses $2 of debt for every $1 of equity. That’s two-thirds of its funding coming from borrowed money.
Why “one size” doesn’t fit all
There’s no perfect number that works for every company. What counts as “good” depends on the industry, business model, and growth stage.
A young tech startup might carry more debt to fuel fast growth. A stable utility company typically keeps debt lower.
Companies with steady cash flow can handle more borrowing than those with up-and-down earnings. Always compare companies within the same industry for a fair assessment.
What is a Healthy Debt-to-Equity Ratio? (Context Matters)
A “healthy” ratio isn’t just about hitting a certain number. It’s about sustainability. Can the company handle its debt over time? The answer depends on several factors. Let’s look at what makes a ratio healthy in different situations.
Factors that influence what is healthy
- Industry capital intensity: Manufacturing and heavy industry firms naturally carry more debt because they need expensive equipment and facilities.
- Cash-flow stability: Companies with predictable, steady earnings can safely support higher debt levels than those with unpredictable income.
- Growth stage: Startups often take on more debt to fund rapid expansion, while mature companies usually prefer lower debt.
- Economic and interest-rate environment: When interest rates climb, high debt becomes more expensive and riskier to maintain.
- Business model and asset base: Asset-heavy businesses like utilities and telecom typically operate with higher debt-to-equity ratios.
Quick reference example ranges
Service/Tech: 0.2 to 0.6
Retail/Consumer goods: 0.5 to 1.5
Manufacturing/Industrial: 1.0 to 2.0
Utilities/Telecom: 1.5 to 3.0 or higher
These ranges are illustrative. Always compare a company to its actual peer group for an accurate assessment.
Industry Debt-to-Equity Ratio Benchmarks
Different industries have different debt levels. What’s normal for one sector might be risky for another. Use this table as a starting guide when evaluating companies.
| Industry Sector | Typical D/E Ratio Range |
|---|---|
| Technology / Software | 0.2 to 0.6 |
| Retail / Consumer Goods | 0.5 to 1.5 |
| Manufacturing / Heavy Industry | 1.0 to 2.0 |
| Utilities / Telecom | 1.5 to 3.0 or higher |
| Financial Institutions (Banks) | Often above 2.0 (heavily regulated) |
Important note: Always compare a company to its industry peers. Check how the ratio has changed over time too. A company with a 1.2 ratio might be strong in retail but weak in tech. Context and comparison matter more than the number itself.
How to Analyze and Interpret the Ratio
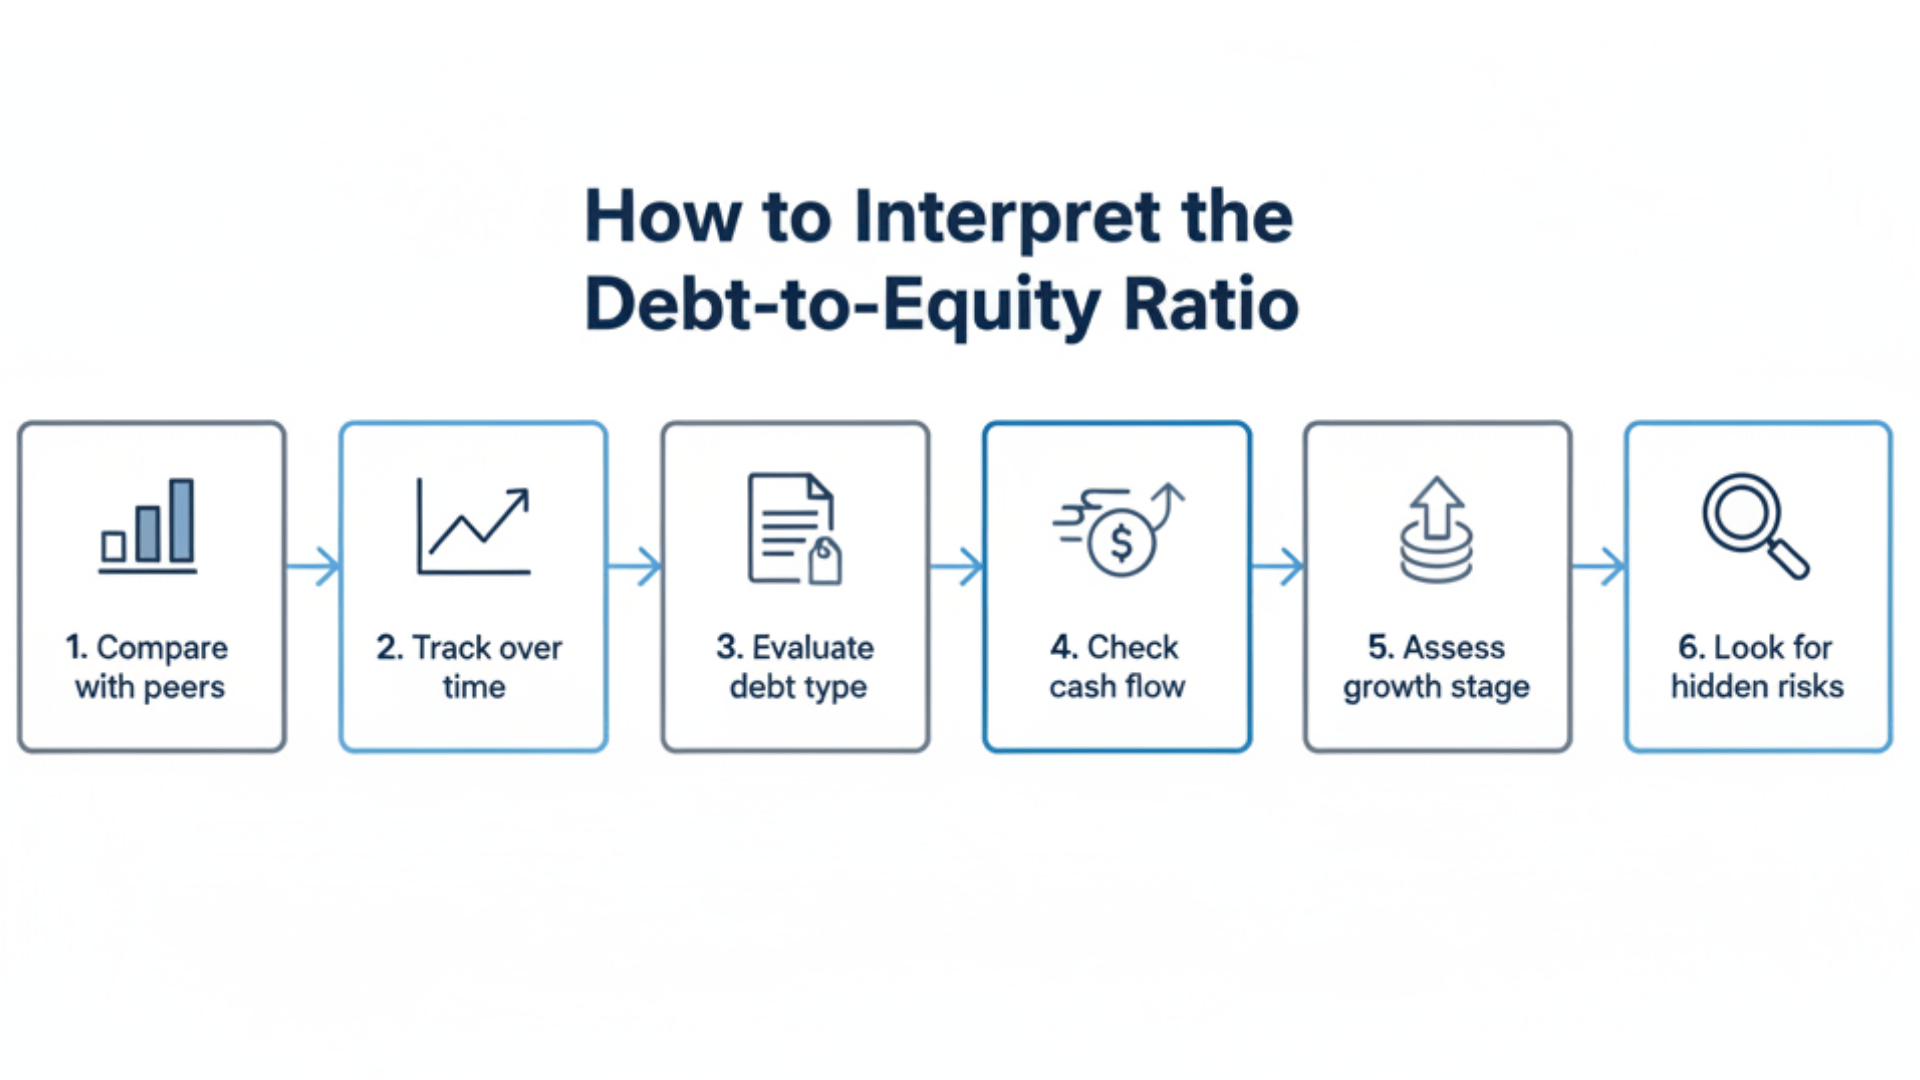
Looking at the debt-to-equity ratio is just the start. You need to dig deeper to understand what it really means. Here’s how to analyze the ratio properly and spot potential red flags.
- Compare to industry peers: Check if the company’s ratio is higher or lower than competitors in the same sector.
- Check trend over time: A rising ratio signals increasing risk, while a falling ratio shows the company is reducing debt.
- Look at debt composition: See if the debt is mostly short-term or long-term, as high short-term debt creates liquidity pressure.
- Consider cash flow and interest coverage: A moderate ratio is fine if the company consistently covers its interest payments and principal.
- Check business model and growth phase: Growth-focused companies may intentionally carry higher debt to fund expansion.
- Beware “too low” ratio: Almost no debt might sound safe, but it could mean the company is missing growth opportunities.
- Look for off-balance-sheet items, such as leases, guarantees, or hidden obligations that add risk but don’t show up in the ratio.
Pros and Cons of a High vs. Low Debt-to-Equity Ratio
Both high and low ratios come with trade-offs. Neither is automatically good or bad. It depends on your goals and risk tolerance. Here’s what you gain and lose with each approach.
High D/E Ratio: Advantages & Risks
| Pros | Cons |
|---|---|
| Potential for higher Return on Equity if debt is used well | Higher financial risk with more interest payments required |
| Debt interest is often tax-deductible, lowering the actual cost | Lenders may charge higher rates or add strict conditions |
| Can fuel fast growth through more available capital | Too much debt scares conservative investors and shareholders |
Low D/E Ratio: Advantages & Risks
| Pros | Cons |
|---|---|
| Greater financial stability during economic downturns | May signal under-leverage and missed growth chances |
| More flexibility to borrow when good opportunities appear | Lower Return on Equity potential from inefficient capital use |
| Seen as prudent and safe by lenders and investors | Being too conservative can limit competitive advantage |
How to Improve or Optimize Your Debt-to-Equity Ratio?
You can adjust your debt-to-equity ratio based on your financial goals. If the ratio is too high, focus on paying down expensive debt first. Retain earnings instead of distributing dividends to build up equity.
You might also consider raising new equity capital from investors. This brings in fresh money without adding more debt. On the flip side, if your ratio is too low, you might be missing growth opportunities.
Use debt strategically when cash flow is strong and interest rates are favorable. Diversify your funding mix between debt and equity to stay competitive.
Whatever your situation, maintain an active capital structure policy. Review your debt maturities regularly. Keep an eye on interest rate changes. Stay flexible so you can adapt when market conditions shift.
Debt-to-Equity Ratio Mistakes and How to Avoid Them
Many people misread the debt-to-equity ratio. They make assumptions that lead to wrong conclusions. Avoid these common errors to get a clearer picture of financial health.
| Mistake | Why It’s Wrong |
|---|---|
| Assuming low D/E always means “good” | A very low ratio might mean the company isn’t using financing effectively |
| Ignoring industry differences | Capital-intensive industries naturally have higher ratios than service businesses |
| Comparing across different industries | Using the same ideal number for tech and utilities leads to false conclusions |
| Failing to check what’s included in “debt” | Some liabilities might not be counted, skewing the real picture |
| Using book equity vs market equity | Market values change quickly and can give very different ratio results |
| Relying solely on the D/E ratio | This is just one metric; also check interest coverage and debt-to-assets ratios |
Example: How to Interpret the Debt-to-Equity Ratio
Let’s look at a practical case to see how this works.
Company A operates in the manufacturing sector:
- Total liabilities (short-term + long-term) = $200 million
- Shareholders’ equity = $120 million
D/E ratio = 200 ÷ 120 = 1.67
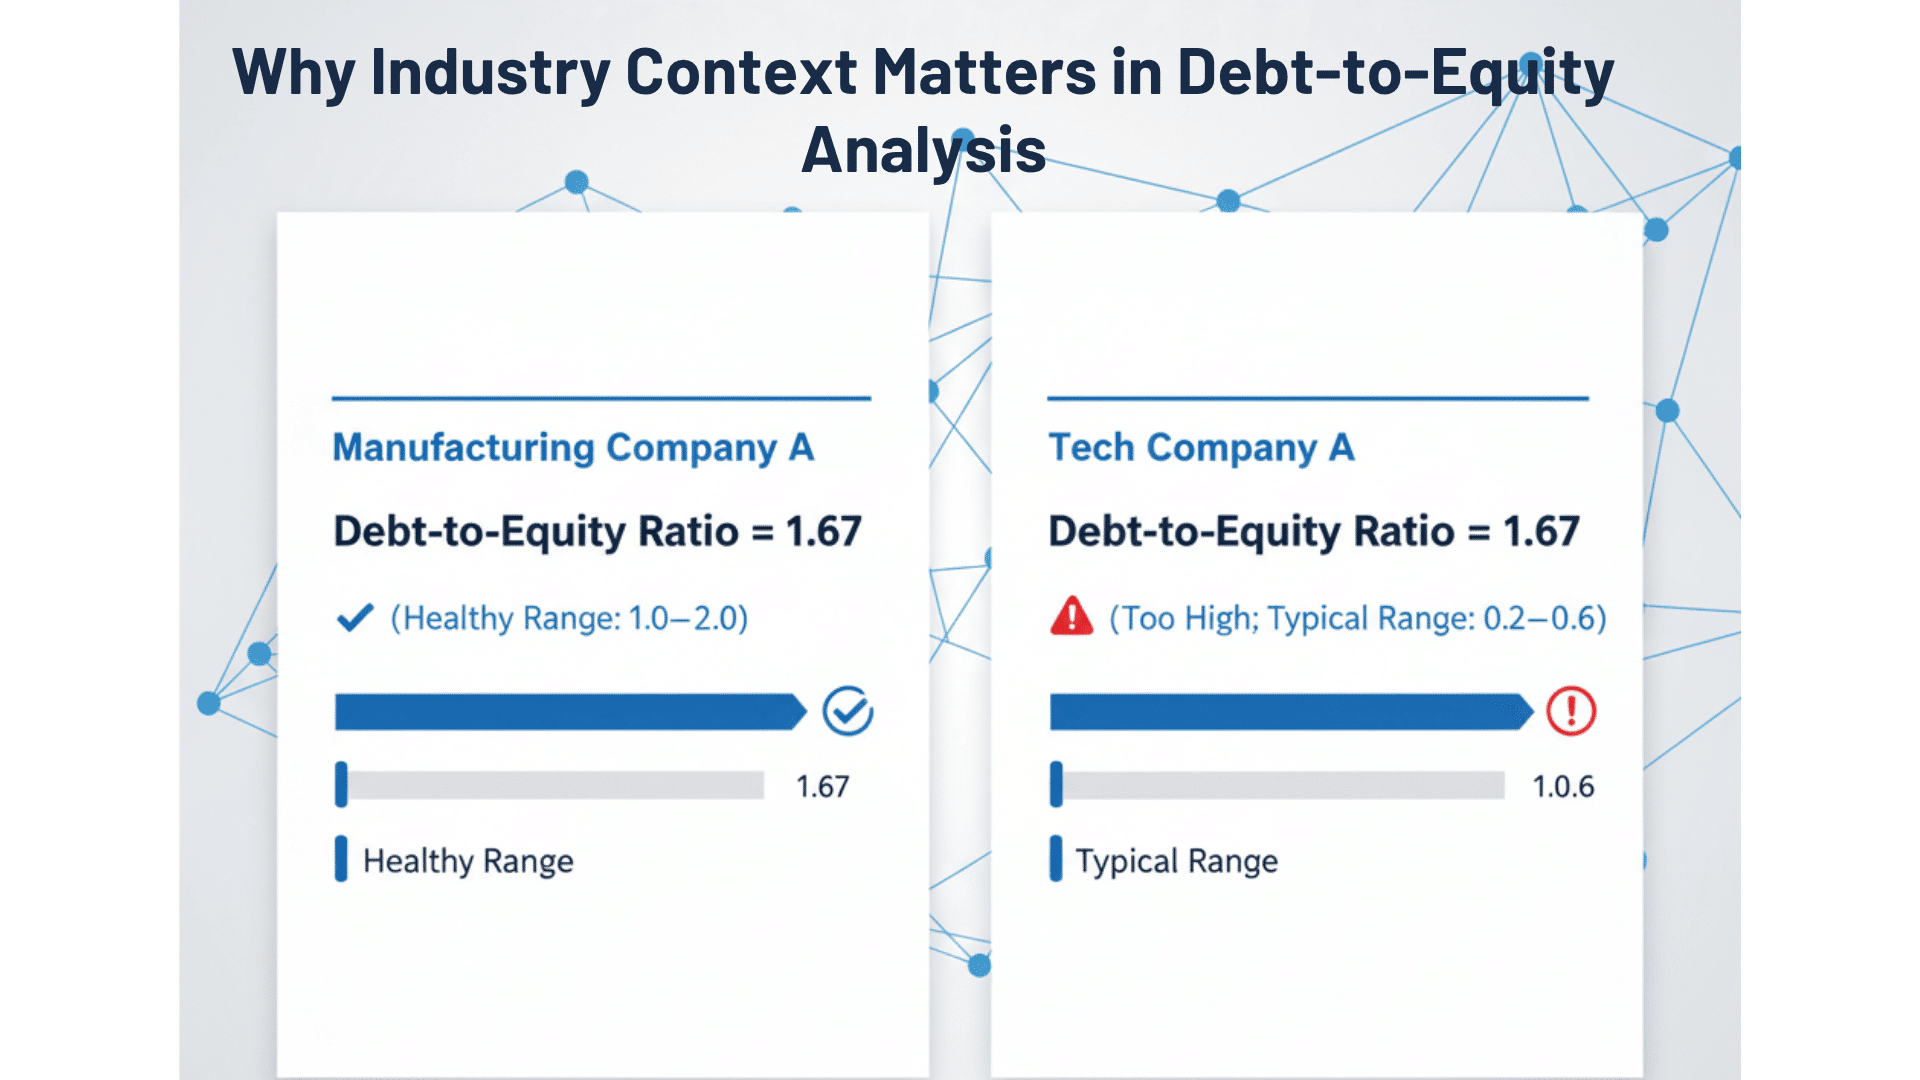
This means Company A has $1.67 in debt for every $1 of equity. In the manufacturing industry, where ratios typically range from 1.0 to 2.0, this number looks acceptable. The company fits within normal industry standards.
But what if Company A were a tech firm instead? Tech companies usually maintain ratios between 0.2 and 0.6. A 1.67 ratio would raise serious red flags. Investors and lenders would question why the company carries so much debt.
This example shows why industry context matters so much. The same number can signal financial health in one sector and financial stress in another. Always compare companies within their own industry before making judgments.
Final Thoughts
The debt-to-equity ratio is a powerful tool for understanding financial health. It shows how much a company relies on borrowed money versus owner investments.
But remember, no single number fits every situation. A ratio that works for utilities might spell trouble for tech companies.
Always look at the full picture. Check industry benchmarks. Review debt types. Watch trends over time. Compare cash flow and interest coverage. Use this ratio alongside other financial metrics for the best insights.
Whether you’re an investor, lender, or business owner, mastering this ratio helps you make smarter decisions. You’ll spot risks earlier and identify opportunities faster.
Want to improve your financial analysis skills? Drop a comment below with your questions about debt ratios. We’d love to hear your thoughts.