


Ever wonder why some traders seem to catch price reversals before everyone else? The secret often lies in reading candlestick patterns correctly.
The inverted hammer candlestick is one of the most reliable signals that a downtrend might be ending. This small candle with a long upper shadow appears when buyers start pushing back against sellers. It’s a warning sign that the market mood is shifting.
In this guide, you’ll learn exactly what an inverted hammer is and how to spot it on any chart. We’ll cover the psychology behind the pattern, show you real trading examples, and give you a clear strategy to trade it safely.
By the end, you’ll know how to use this pattern to find early reversal opportunities and improve your trading results.
What is an Inverted Hammer Candlestick?
An inverted hammer candlestick is a bullish reversal pattern that forms at the end of a downtrend. It tells traders that buyers are starting to push back, even though sellers still have control. This pattern often marks the beginning of a potential trend change from bearish to bullish.
Here’s how it looks:
- Small real body – The body sits near the session’s low.
- Long upper wick – This shadow is usually twice the size of the body or more.
- Little or no lower shadow – There’s almost no tail at the bottom.
The shape looks like an upside-down hammer, which is exactly how it got its name.
Interpretation:
The long upper shadow tells an important story. Buyers tried hard to push prices higher during the session. But sellers fought back and brought the price down before closing.
The small body near the bottom shows that sellers still had some strength, but they couldn’t push the price to new lows. This battle between buyers and sellers hints at a shift.
The momentum might be changing from bearish to bullish. When you see this pattern after a downtrend, it’s a sign to watch closely. The next candle will often confirm whether buyers are really taking over.
Market Psychology Behind the Inverted Hammer

Think of the inverted hammer as the moment when buyers finally start fighting back. At the start of the session, sellers push the price lower, trying to maintain control.
Then buyers step in with force, driving the price up and creating that long upper wick. But sellers aren’t ready to give up yet. They return before the close and push the price back down slightly.
Even though the candle closes near its low, that long upper wick tells the real story. It shows strong buying interest building beneath the surface.
This suggests the next session could bring upward movement, especially if a green candle follows to confirm the reversal.
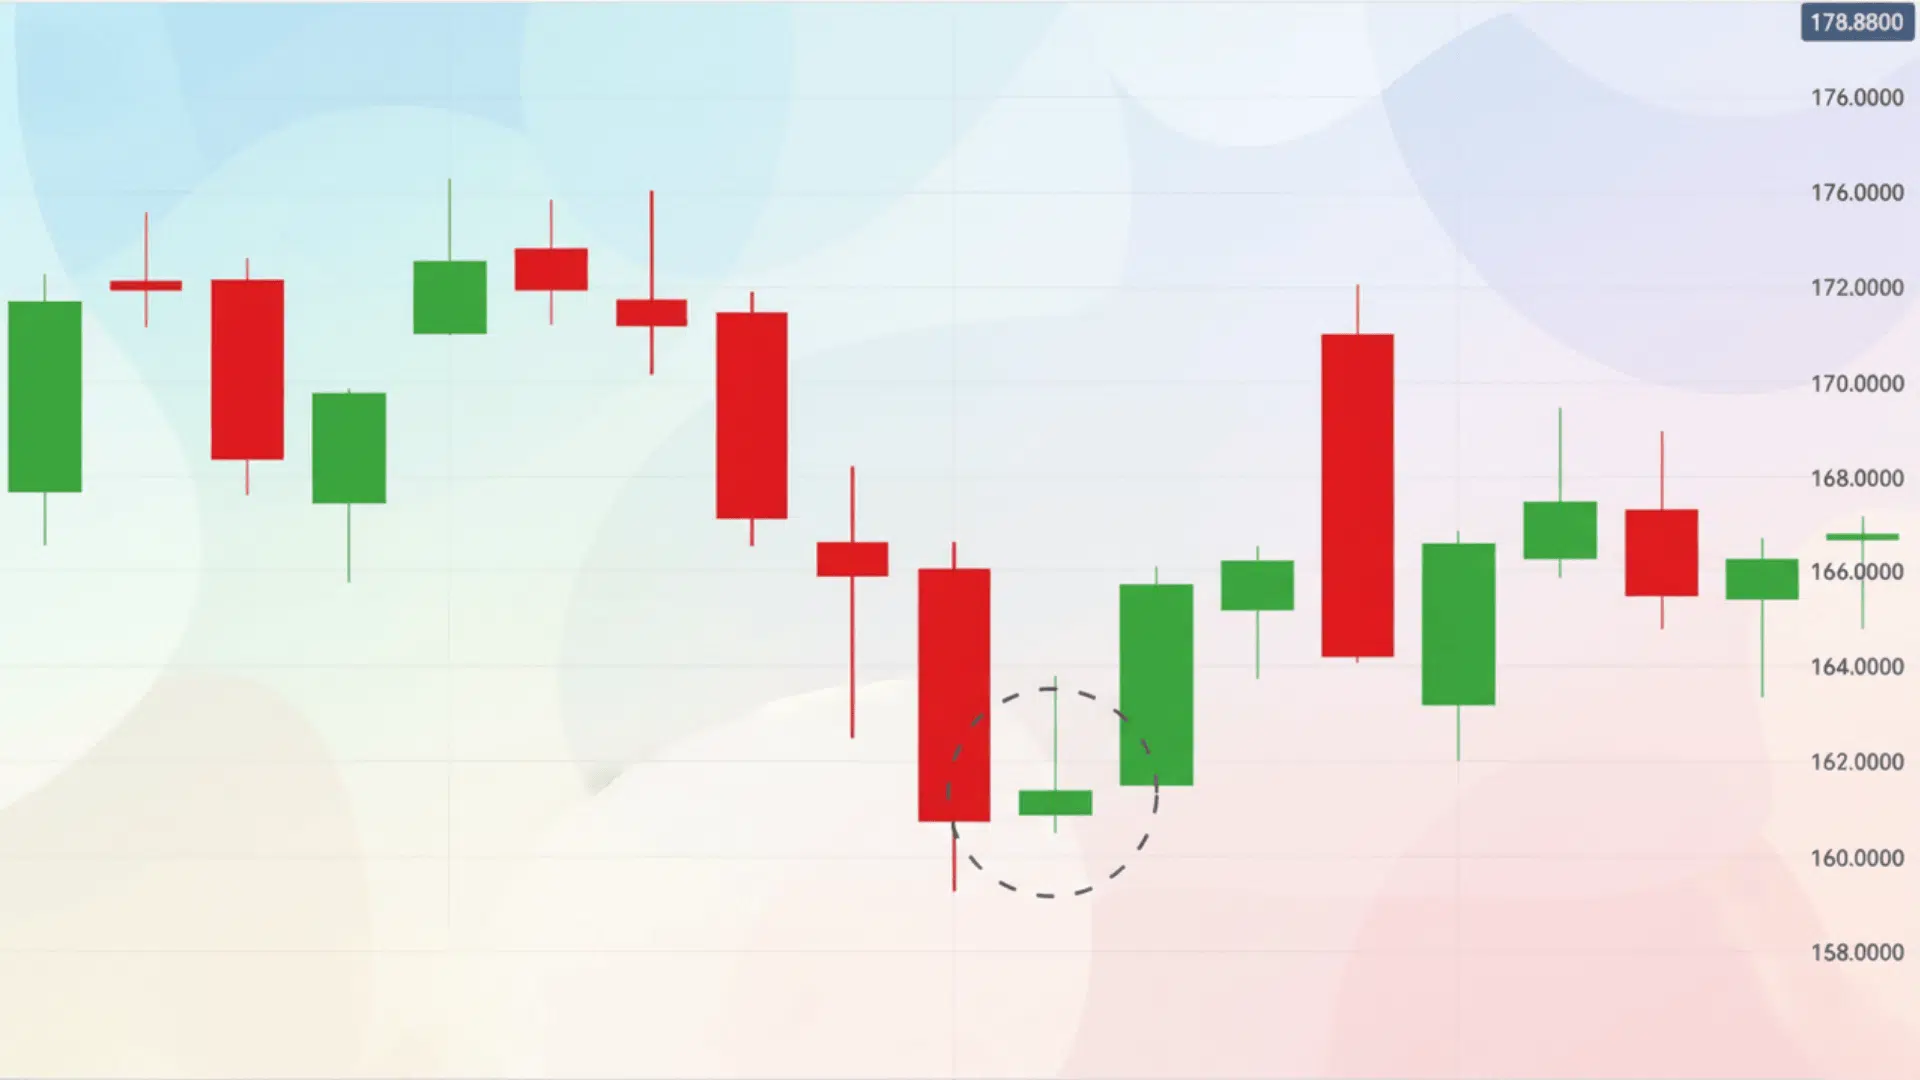
How to Identify an Inverted Hammer on a Chart?
Spotting an inverted hammer is easier when you know what to look for. Here’s a simple checklist to help you identify this pattern on any chart:
- Trend – The pattern must appear after a clear and consistent downtrend.
- Shape – Look for a small body with a long upper wick that’s at least twice the size of the body.
- Lower Shadow – There should be very little or no lower shadow at all.
- Confirmation – Wait for the next candle to close higher than the inverted hammer’s high.
Pro tip: Use the daily timeframe for more reliable signals. You can also confirm the pattern with volume indicators or momentum tools like RSI or MACD.
Higher volume during the inverted hammer strengthens the signal and increases the chance of a successful reversal.
Inverted Hammer vs Hammer Candlestick Pattern
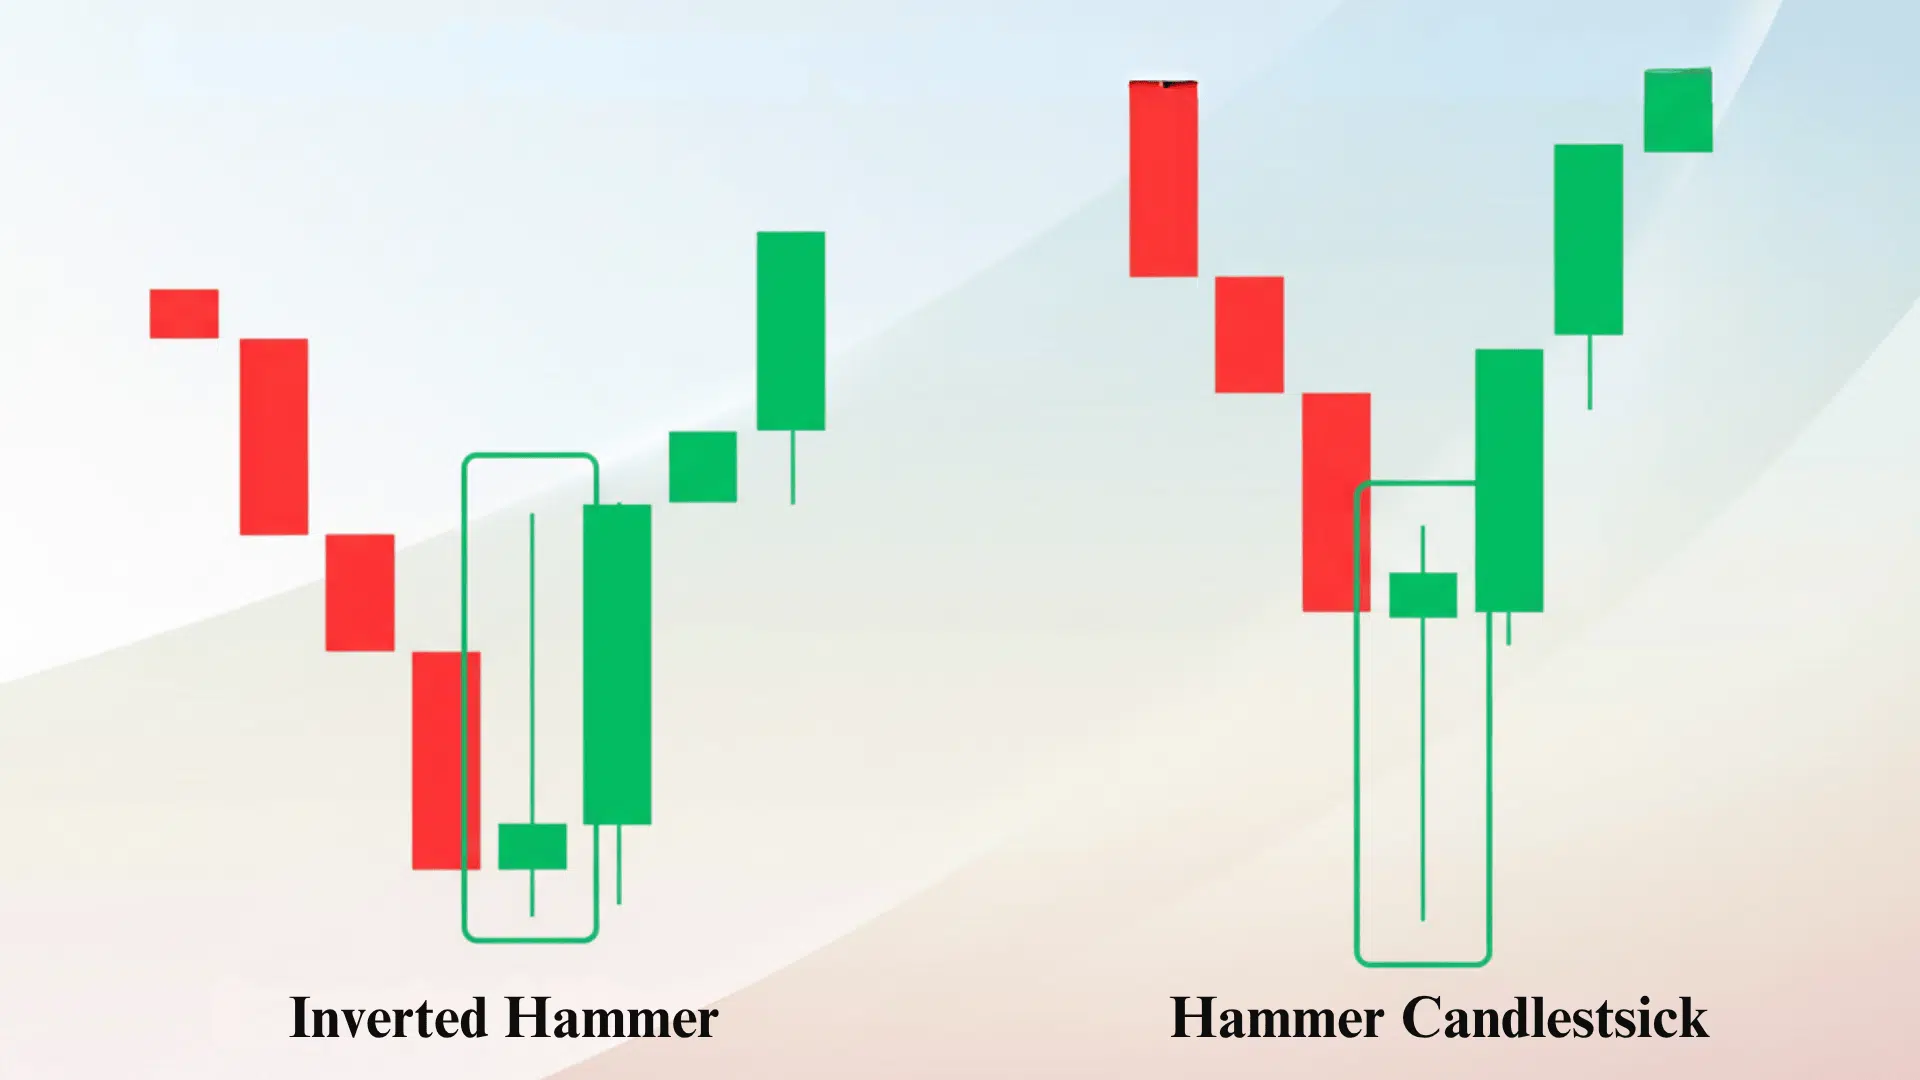
Now that you understand how the inverted hammer forms and what it signals, it’s important to see how it differs from its close relative, the hammer candlestick pattern.
| Feature | Inverted Hammer | Hammer Candlestick |
|---|---|---|
| Appearance | Small body at the bottom with a long upper wick | Small body at the top with a long lower wick |
| Trend Context | After a downtrend | After a downtrend |
| Market Signal | Bullish reversal | Bullish reversal |
| Key Difference | Buyers pushed prices up, but couldn’t sustain the highs | Sellers pushed prices down, but buyers regained control |
Both are bullish signals, but the hammer candlestick looks like a traditional hammer, while the inverted hammer is its upside-down cousin.
How to Trade the Inverted Hammer Pattern
Trading this pattern effectively involves patience and confirmation. You can’t just jump in when you see the inverted hammer. You need to wait for the right signals and protect your capital with smart risk management.
1. Entry Strategy
Wait for the next candle to close above the high of the inverted hammer. This is your confirmation signal.
It proves that buyers have taken control, and the reversal is likely real. Never enter a trade based on the inverted hammer alone without this confirmation.
2. Stop Loss
Place your stop loss just below the low of the inverted hammer. This protects you if the pattern fails and the downtrend continues.
Keep your stop loss tight but reasonable. Give the trade enough room to breathe without risking too much capital.
3. Profit Target
Set your targets using previous resistance levels on the chart. You can also use a 1:2 risk-to-reward ratio for consistent profits.
If you risk $100, aim to make at least $200. This approach keeps your trading profitable over the long term, even if some trades don’t work out.
4. Combine with Indicators
To boost accuracy, pair the inverted hammer with technical indicators. This adds extra confirmation and filters out false signals.
- RSI (Relative Strength Index) – Look for oversold levels below 30 when the inverted hammer forms.
- MACD Crossovers – Watch for bullish crossovers to confirm upward momentum is building.
- Volume spikes – High volume during the inverted hammer significantly strengthens the reversal signal.
Using multiple indicators together gives you more confidence in the trade. It reduces the chances of entering on a false signal and improves your overall win rate.
Pros and Cons of Using Inverted Hammer Patterns
Like any trading tool, the inverted hammer has its strengths and weaknesses. Understanding both sides helps you use the pattern more effectively and avoid common pitfalls.
| Pros | Cons |
|---|---|
| Easy to identify visually on any chart with just a quick glance | Can give false signals without proper confirmation from the next candle |
| Works across multiple timeframes, from intraday to daily and weekly charts | Effectiveness reduces significantly in sideways or ranging markets |
| Great for reversal setups and catching the bottom of downtrends early | Must be used with volume analysis and trend filters to improve accuracy |
The key is knowing when to use this pattern and when to stay away. In strong trending markets with good volume, the inverted hammer becomes a valuable signal. But in choppy or low-volume conditions, it’s better to wait for clearer setups.
Real-World Example: Inverted Hammer in the Stock Market

In 2020, Apple (AAPL) formed an inverted hammer near $220 after a multi-day decline. This pattern appeared right when the stock looked ready to fall further. But smart traders who recognized the signal got ready for a potential reversal.
The next session produced a bullish green candle closing above the high. This confirmed that buyers had taken control, and the reversal was underway.
Within a week, the stock rallied more than 6%. Traders who entered on the confirmation candle captured significant gains in just a few trading days.
This example shows how traders use inverted hammers to spot early reversal opportunities. The pattern gave them a heads-up before the major move happened.
It allowed them to enter near the bottom and ride the rally upward. Real-world cases like this prove why learning candlestick patterns is so valuable for active traders.
Related Candlestick Patterns
If you’re learning candlestick trading, you should explore other patterns that work alongside the inverted hammer. Studying related formations helps you spot reversals more accurately and gives you more trading opportunities.
- Hammer Candlestick – A bullish reversal pattern with a long lower shadow that appears after a downtrend.
- Shooting Star – A bearish reversal pattern that looks like an inverted hammer but appears at the top of an uptrend.
- Hanging Man – A bearish signal with a long lower shadow that forms after an uptrend, warning of potential decline.
- Doji – A candle with almost no body that shows indecision and often signals a trend reversal when combined with other patterns.
- Bullish Engulfing Pattern – A two-candle pattern where a large green candle completely covers the previous red candle, confirming strong buying pressure.
Learning these patterns together makes you a more complete trader. Each one reveals different market conditions and helps you read price action with greater skill.
Avoid These Inverted Hammer Trading Mistakes
Even experienced traders make errors with this pattern. Knowing what to avoid helps you trade smarter and protect your capital. Here are the most common traps and how to stay clear of them.
| Mistake | Why It’s a Problem | How to Avoid It |
|---|---|---|
| Mistaking a Shooting Star for an Inverted Hammer | Both look similar but mean opposite things; a shooting star appears in an uptrend and signals a bearish reversal | Always check the trend first; inverted hammers only work after downtrends |
| Entering too early | Trading before confirmation increases the chance of false signals and losses | Wait for the next candle to close above the inverted hammer’s high |
| Ignoring volume and market conditions | Low-volume patterns often fail; sideways markets reduce pattern reliability | Check volume spikes and confirm the market is trending, not ranging |
| Forgetting risk management | Even good patterns fail sometimes; trading without stop losses can wipe out your account | Always place a stop loss below the inverted hammer’s low and use proper position sizing |
Avoiding these mistakes will improve your success rate significantly. Trading is about managing risk as much as finding opportunities.
Conclusion
The inverted hammer candlestick is a simple yet powerful tool for spotting potential reversals. When you see this pattern after a downtrend, it tells you that buyers are starting to challenge sellers. The long upper shadow reveals buying pressure building beneath the surface.
Remember to always wait for confirmation before entering a trade. Use the next candle closing above the inverted hammer’s high as your signal. Combine the pattern with volume and indicators like RSI or MACD for better accuracy.
Practice spotting inverted hammers on your charts. Study how they behave in different market conditions. Over time, you’ll develop the skill to catch reversals early and make smarter trading decisions.
What patterns are you watching in your trades right now? Share your thoughts below.