If you’ve ever watched price charts closely, you might’ve spotted a candle with a small body and a long lower wick sitting near the top of a rally.
That’s the hanging man candle, a quiet sign that momentum could be fading. I find it interesting how one simple candle can hint at a shift before the market reacts.
In this guide, you’ll learn what the hanging man candle tells you, how to recognize it, and smart ways to trade it. I’ll also share how confirmation and solid risk control can turn this pattern into a practical tool for your trading setup.
What is a Hanging Man Candle?
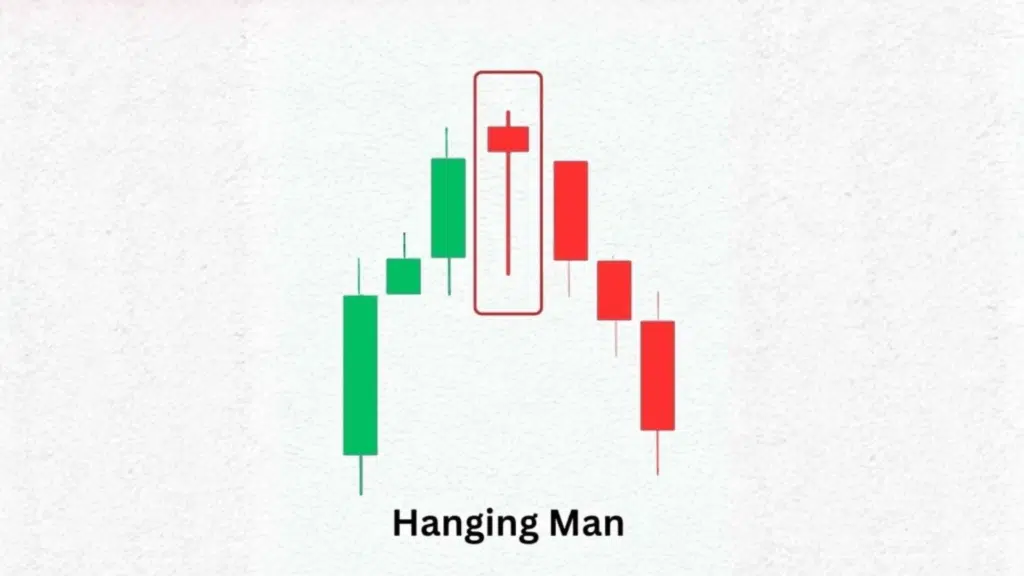
A hanging man candle is a single-bar pattern that appears near the top of an uptrend.
It has a small body near the top and a long lower shadow, showing that sellers managed to push prices down during the session before buyers brought them back up.
This candle warns that buying strength may be fading and sellers are starting to test control. It’s not a confirmed reversal on its own, but if the next candle closes lower, the pattern gains weight as a signal of potential weakness.
How to Identify a Hanging Man Candlestick?
Look for these details when spotting the pattern:
- It appears after a clear uptrend.
- The real body is small and located near the top of the range.
- The lower shadow is at least twice the length of the body.
- The upper shadow is very small or missing.
- The color of the candle is not as important as its shape and position.
When you spot this candle after several strong bullish candles, it hints that sellers pushed prices down during the session, even though buyers managed to bring them back up.
What the Pattern Tells You
This pattern shows that the market’s strength may be fading. During the session, sellers drove prices lower, creating the long lower wick. Buyers later pushed prices back up, but that drop revealed weakness under the surface.
If the next candle closes lower, it confirms that sellers are gaining ground and the trend could start turning.
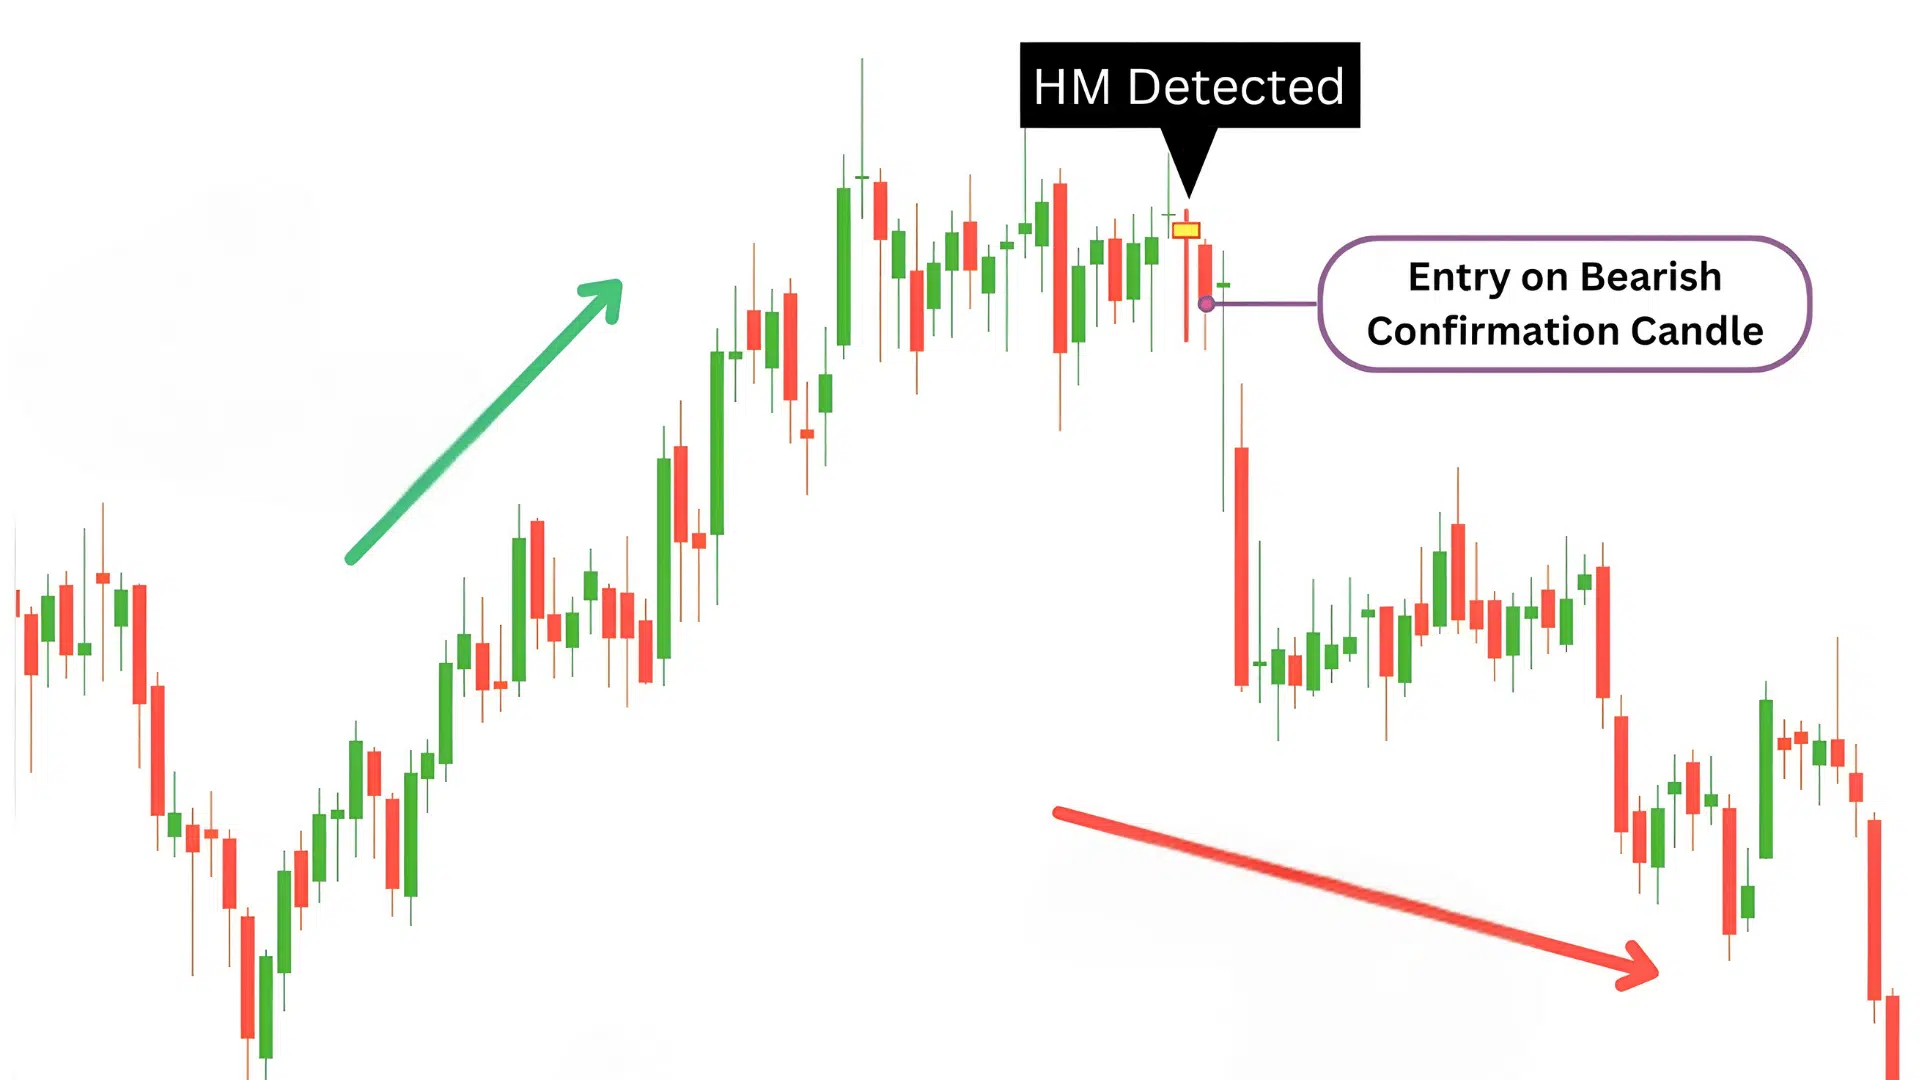
Confirmation Rules
You should always wait for confirmation before acting on a hanging man candlestick.
Here’s what counts as confirmation:
- The next candle closes below the body of the hanging man.
- Volume rises during the confirming move.
- The setup forms near resistance, a trendline, or an overbought reading on an indicator like RSI.
Without confirmation, the hanging man candle may simply mark a short pause before the uptrend continues.
How to Trade the Hanging Man Pattern

After spotting a hanging man candlestick, you’ll need a clear plan to trade it safely. Follow these steps to confirm the setup, manage risk, and take action with confidence.
Step 1: Spot the Pattern
Look for a clear uptrend made of several strong bullish candles. The hanging man usually appears after prices have been rising for some time and momentum starts to slow.
It forms near a resistance level or at the top of a swing, where buying pressure has already stretched the move.
Step 2: Wait for Confirmation
Patience matters here. Don’t act the moment you see the pattern. Wait for the next candle to close below the hanging man’s body, which shows that sellers are following through.
The drop should ideally come with higher trading volume or appear after a rejection near resistance.
Step 3: Plan Your Entry
Once the pattern confirms, plan your short entry carefully. Conservative traders often wait for the confirming candle to close before entering.
Aggressive traders may enter earlier, placing a sell order just below the hanging man’s low. Whichever method you use, make sure the setup aligns with your overall trade plan.
Step 4: Place a Stop-Loss
Always set a stop-loss to limit risk. Place it slightly above the high of the hanging man candlestick, since a close above that point would cancel the bearish setup.
This keeps you protected if the price continues upward instead of reversing.
Step 5: Set a Target
Choose your profit target based on the chart’s structure.
Common approaches include aiming for the next support zone, using a fixed risk-to-reward ratio like 1:2, or trailing your stop as the trade moves in your favor. This helps you lock in gains while staying flexible if the trend continues to drop.
Step 6: Manage Risk
Even a confirmed hanging man doesn’t guarantee a reversal, so manage your risk carefully.
Avoid opening large positions and skip trades when the market is choppy or volume is thin. Focus on setups that appear after a strong rally with clear confirmation and logical stop placement.
Example of the Hanging Man Candle
The hanging man candlestick can appear on different timeframes and across various markets.
The following examples show how this pattern behaves in real setups and how confirmation can strengthen its signal.
Daily Chart Example (SPY — August 14, 2024)
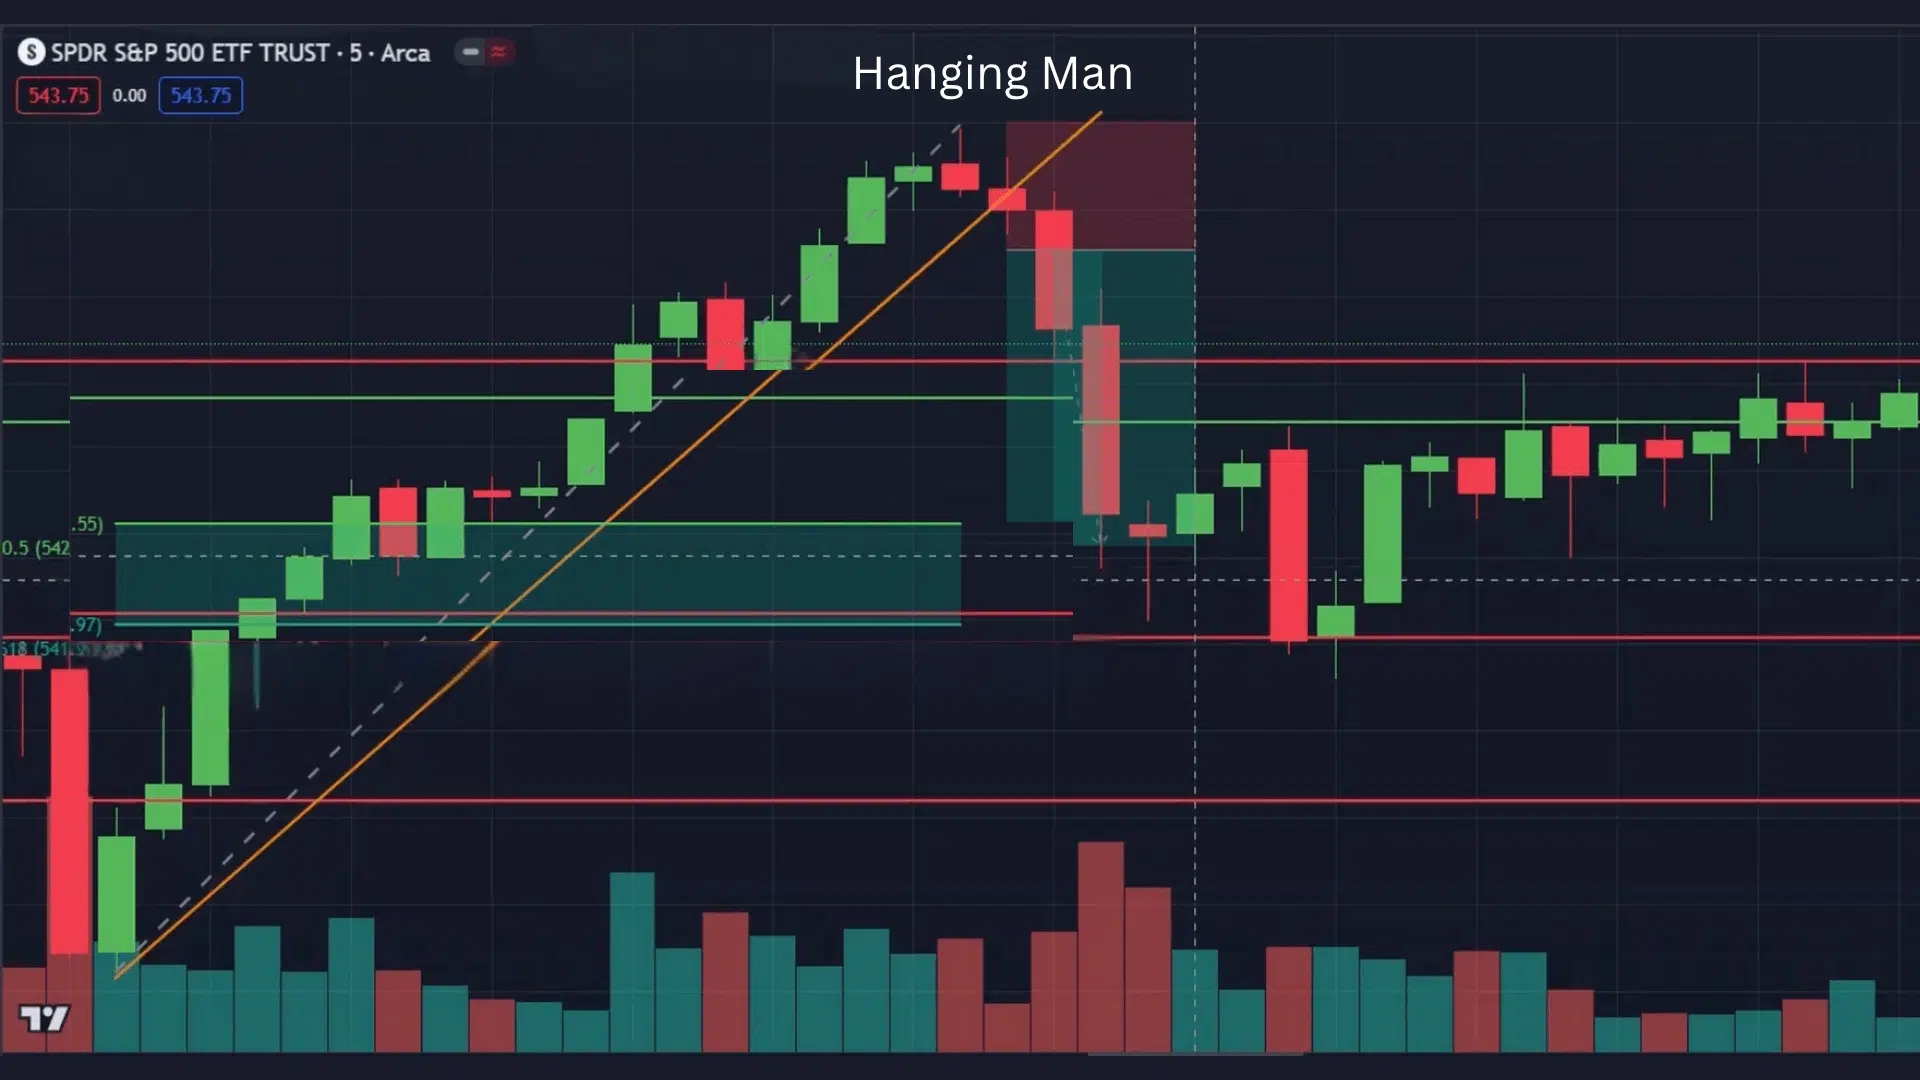
In this real example from the SPDR S&P 500 ETF (SPY) daily chart, a hanging man candle appeared on August 14, 2024, just below a key resistance area.
The candle had a small real body near the top and a long lower shadow, showing that sellers managed to push prices down before buyers recovered part of the move.
The following day closed below the hanging man’s body, confirming weakness and leading to a brief pullback.
This setup demonstrates how confirmation adds weight to the signal and how traders can use it to anticipate short-term trend changes.
Source: Hanging man and Shooting Star reversal trade on SPY — TradingView
4-Hour Chart Example
On the 4-hour chart, a hanging man may form after a strong uptrend near a previous swing high. The long lower wick shows that sellers entered during the candle, even though buyers brought prices back up by the close.
A lower close on the next candle, especially with higher volume, signals that selling pressure is building, and a mild correction could follow.
1-Hour Chart Example
On shorter timeframes like the 1-hour chart, hanging man patterns can appear often but are less reliable. You might see one at the end of a sharp rise where sellers briefly drive the price down.
If the next candle closes higher instead of lower, it cancels the signal. This highlights the need for confirmation before trading on lower timeframes.
This content is for educational purposes only and does not represent financial or investment advice. Chart examples and setups are shared for learning purposes and may not reflect future market conditions.
Hanging Man vs Hammer vs Shooting Star
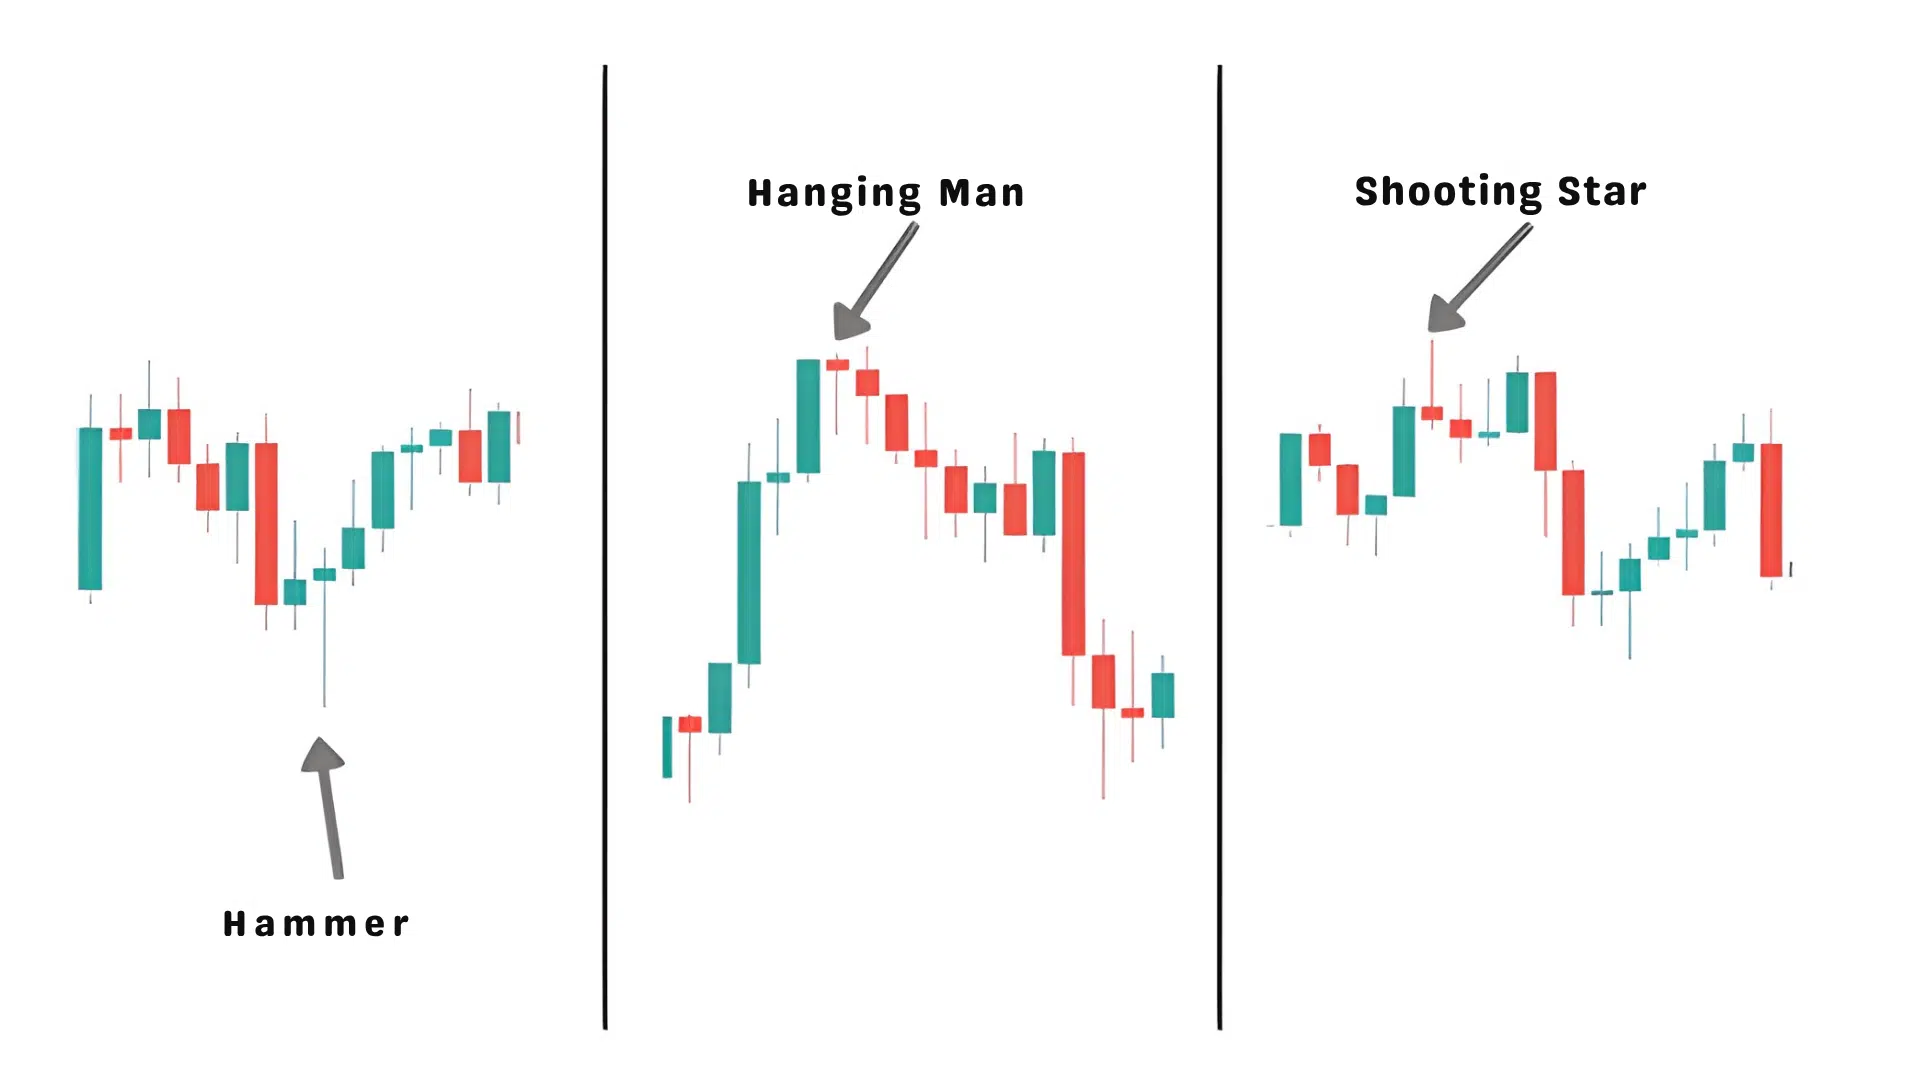
These three candlestick patterns look similar but mean different things depending on where they form in a trend. Recognizing the context helps you read the market more accurately.
| Pattern | Trend Location | Shadow Direction | Meaning |
|---|---|---|---|
| Hanging Man | Uptrend | Long lower shadow | Bearish warning |
| Hammer | Downtrend | Long lower shadow | Bullish reversal |
| Shooting Star | Uptrend | Long upper shadow | Bearish reversal |
The hanging man and hammer share the same shape but appear in opposite trends. The hanging man forms after an uptrend, while the hammer forms after a downtrend.
The shooting star, with its long upper wick, signals rejection at higher prices during an uptrend.
Trading Setup Checklist
Before trading the hanging man candlestick, it helps to have a clear plan. This checklist keeps you focused on confirmation, structure, and risk management so you don’t act on weak setups.
- Confirm a bearish close after the hanging man forms to validate selling pressure.
- Make sure it appears after a clear and extended uptrend.
- Check for nearby resistance levels or trendlines that could strengthen the signal.
- Place your stop-loss slightly above the candle’s high for protection.
- Set targets near support zones or use a 1:2 risk-to-reward ratio.
- Avoid trading during low-volume or sideways market conditions.
Following this checklist helps you trade the hanging man candle with more discipline and fewer false signals. Over time, it builds consistency and confidence in your analysis.
Wrap Up
Reading charts gets easier once you understand the story each candle tells. The hanging man candle is one of those quiet signals that can help you spot early signs of change before the market reacts.
It reminds you to slow down, look closer, and wait for proof instead of rushing in. I hope this guide helped you see how to use the hanging man candle with confidence and clear rules.
When you trade with patience and focus, simple patterns like this can make a big difference in your results.
If you found this helpful, take a look at my other posts for more trading ideas and practical tips.