


Ever watch a stock breakout only to reverse right after you entered? Most traders lose money because they can’t read price patterns or enter trades too early.
Recognizing the right patterns at the right time separates winning traders from losing ones. This guide will teach you proven day trading patterns that work in today’s markets.
You’ll learn what each pattern looks like, when it signals continuation or reversal, and exactly how to trade it with clear entry and exit points. No theory overload here.
Just practical setups you can start using today. We’ll also cover the tools you need, common mistakes to avoid, and pro tips to increase your win rate.
By the end, you’ll know which patterns fit your trading style and how to spot them before the crowd does.
What is Day Trading?
Day trading is buying and selling stocks within the same trading day. You open and close all positions before the market shuts down.
The goal is to profit from small price movements throughout the day. Day traders don’t hold positions overnight to avoid risks from after-hours news.
Chart or Stock Patterns: Chart patterns are specific price formations that appear repeatedly on stock charts. They form because traders tend to react similarly to certain market conditions.
These visual shapes show whether buyers or sellers are in control. Patterns help you predict what might happen next based on past behavior.
How Patterns Help in Predicting Price Movement
Patterns tell you if a stock will continue its current trend or reverse direction. Continuation patterns suggest the price will keep moving the same way after a brief pause.
Reversal patterns signal that the trend is about to flip. Spotting these early gives you better entry and exit points for trades.
| Pattern Type | What It Means | Trader Action |
|---|---|---|
| Continuation | Trend pauses then resumes | Enter in trend direction |
| Reversal | The trend is about to change | Exit current, enter opposite |
Tools You’ll Need:
- Charting Platforms: Use TradingView or ThinkorSwim to view real-time charts and draw pattern lines clearly.
- Candlestick Charts & Volume Analysis: Candlesticks show price action in detail, while volume confirms if a pattern breakout is real or weak.
- Risk Management Checklist: Always set stop-loss levels, limit position size to 1-2% of capital, and never trade without a plan.
Best Day Trading Patterns You Must Know
Here are proven day trading patterns that experienced traders rely on to spot momentum, reversals, and breakouts.
1. Bull Flag Pattern
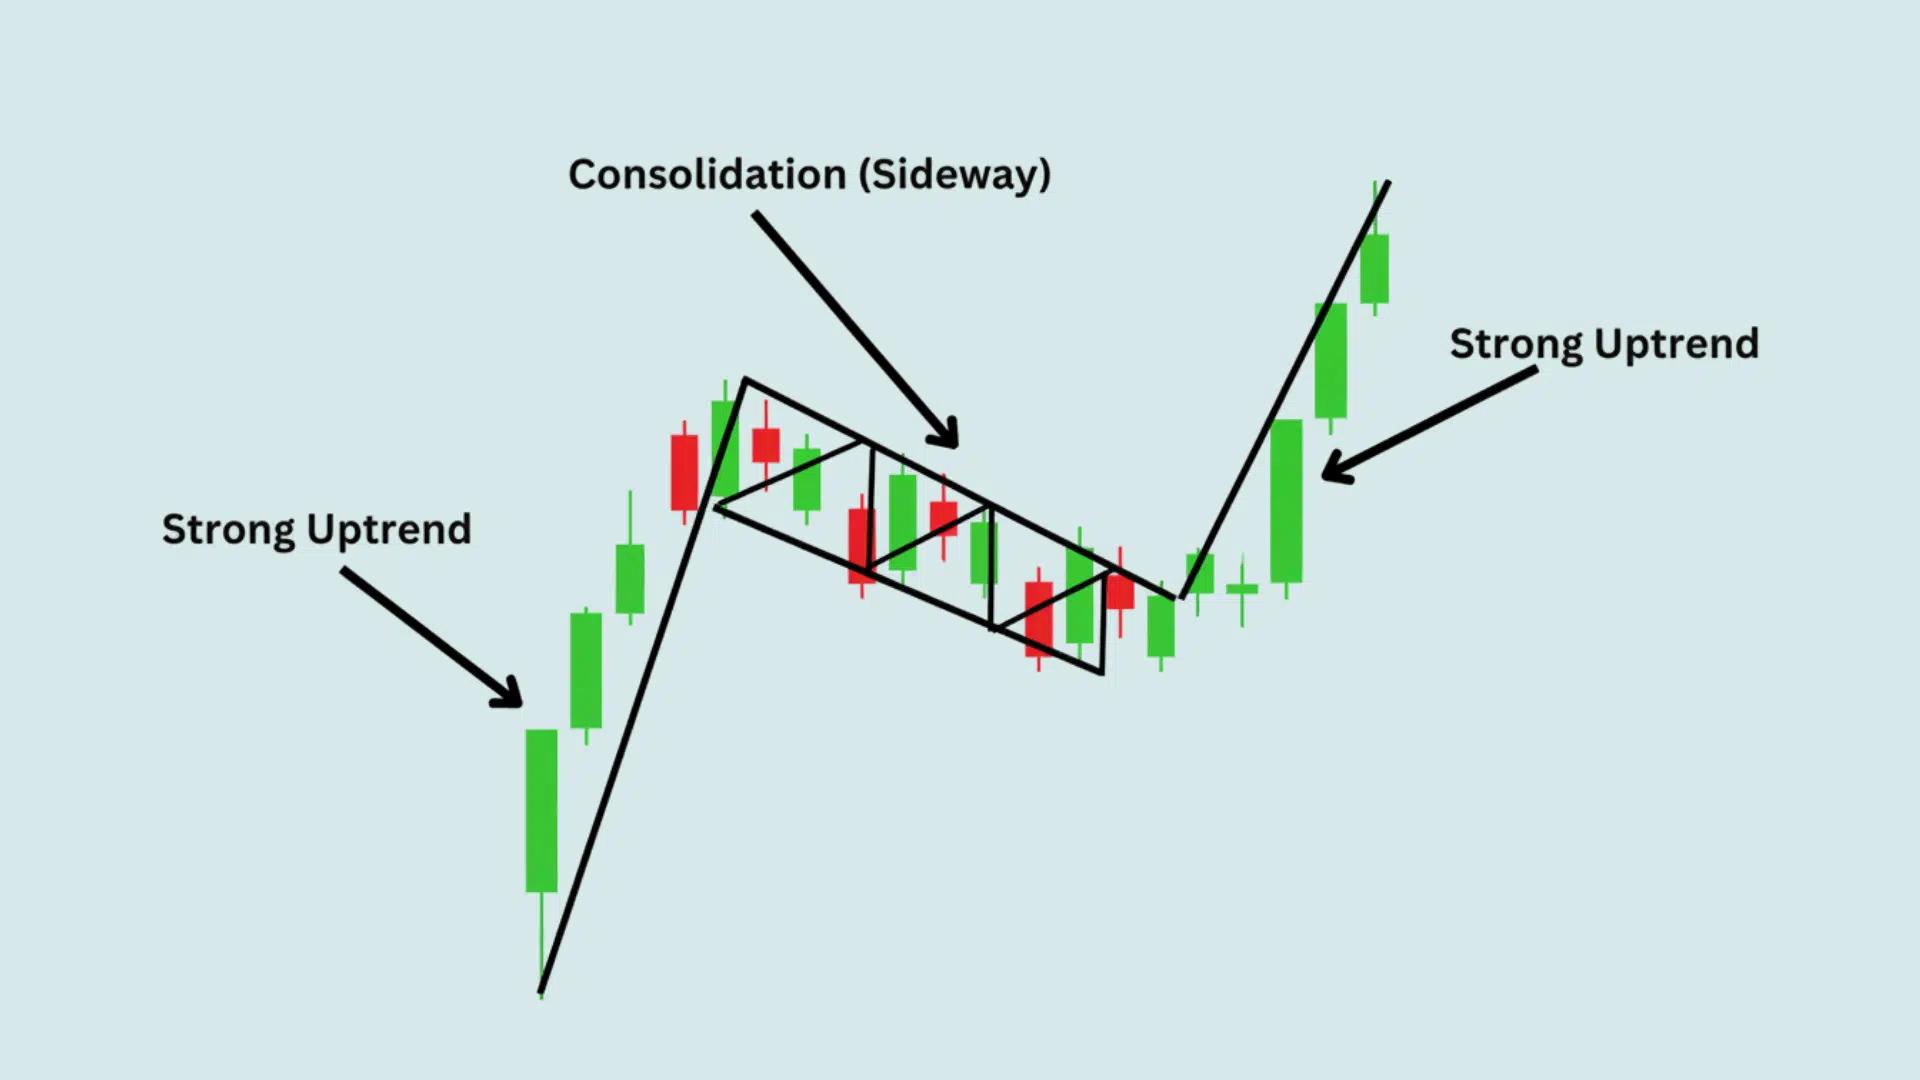
A sharp upward move followed by a tight downward or sideways channel that looks like a flag on a pole.
The initial spike shows strong buying pressure pushing prices higher quickly. The flag forms as traders take profits, creating a small pullback that moves against the trend.
- Signal: A continuation pattern indicates the uptrend will likely resume after a brief pause.
- How to Trade: Buy when the price breaks above the flag’s upper boundary with strong volume. Place a stop loss below the flag. Target the same distance as the initial pole.
- Pro Tip: Look for volume to drop during flag formation and spike on breakout for best results.
2. Bear Flag Pattern
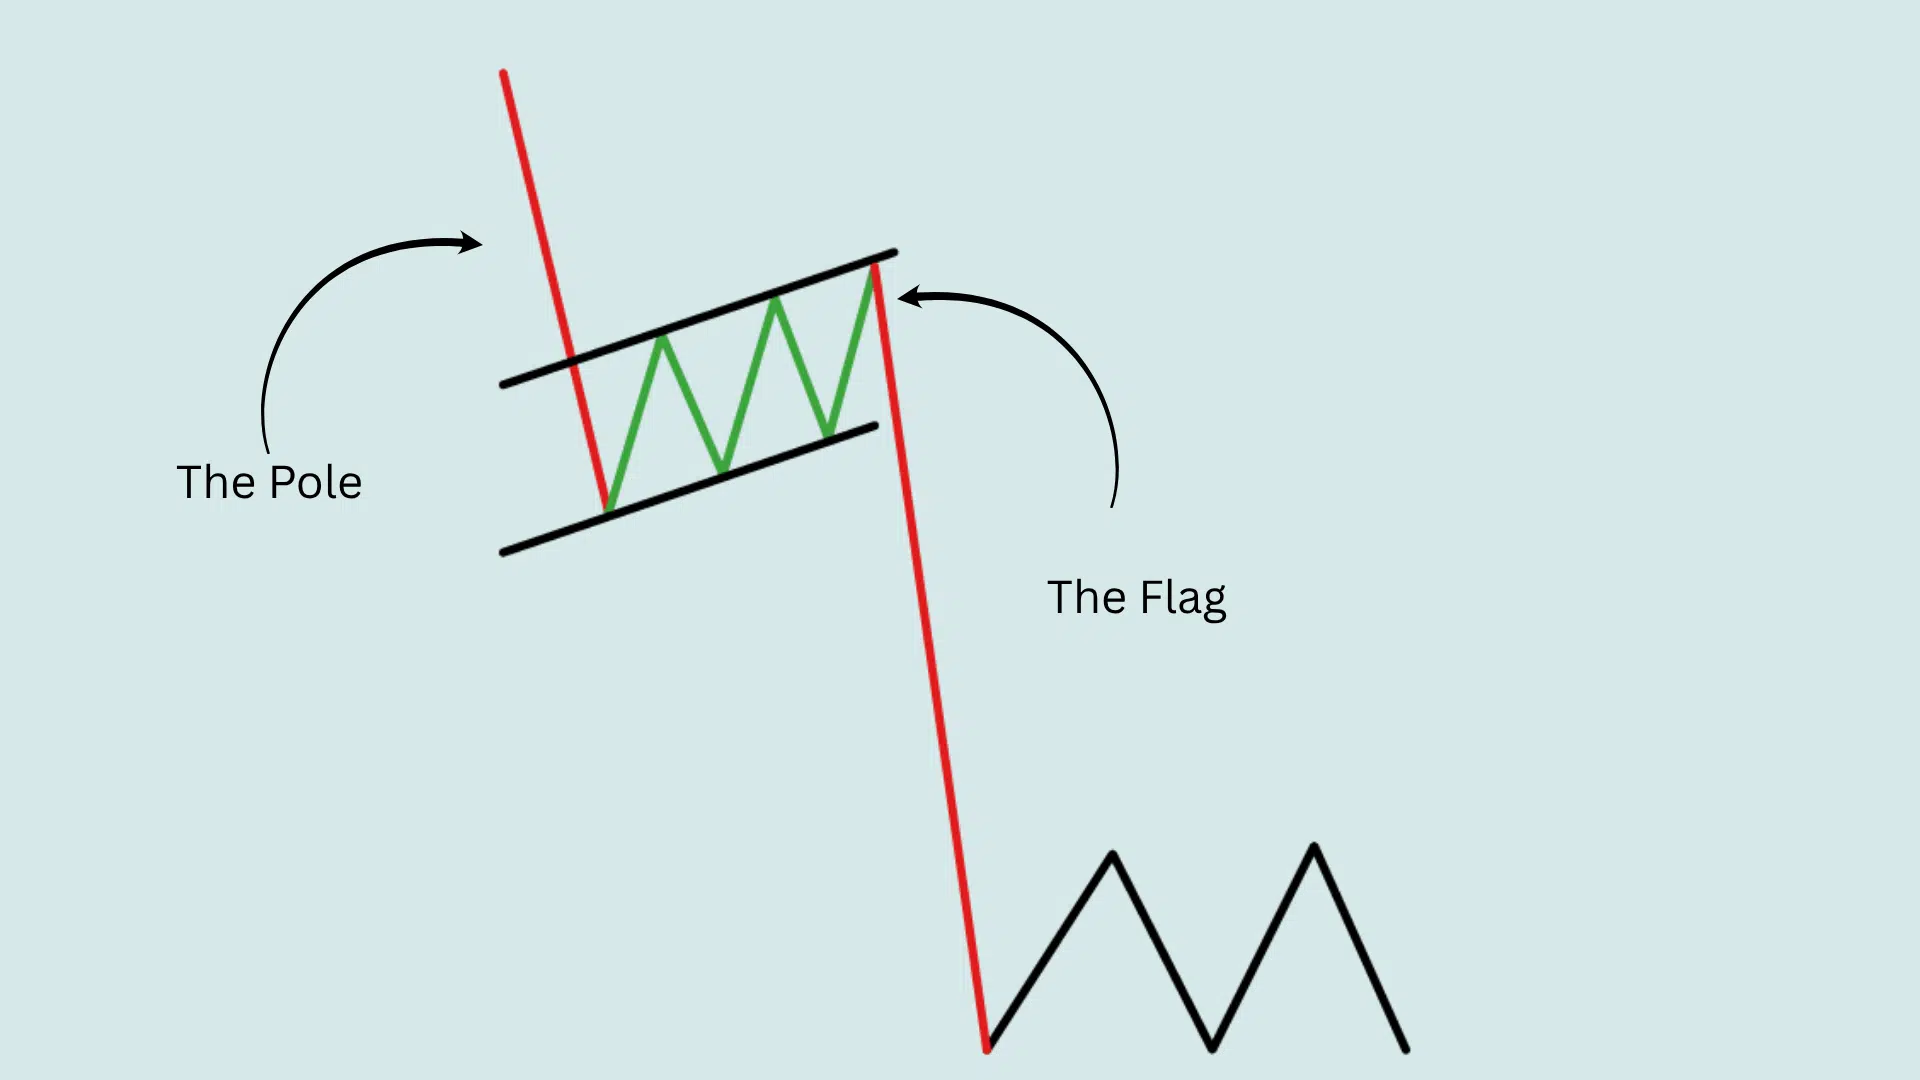
A steep downward move followed by a small upward consolidation channel. Sellers dominate initially, pushing prices down rapidly on high volume. The flag appears as a minor bounce where buyers briefly step in before sellers regain control.
- Signal: A continuation pattern indicates that more selling pressure is expected after the pause.
- How to Trade: Short when the price breaks below the flag’s lower line. Set the stop above the flag top. Measure the pole length for the profit target.
- Pro Tip: Best when seen in stocks already in strong downtrends with negative news catalysts.
3. Cup and Handle
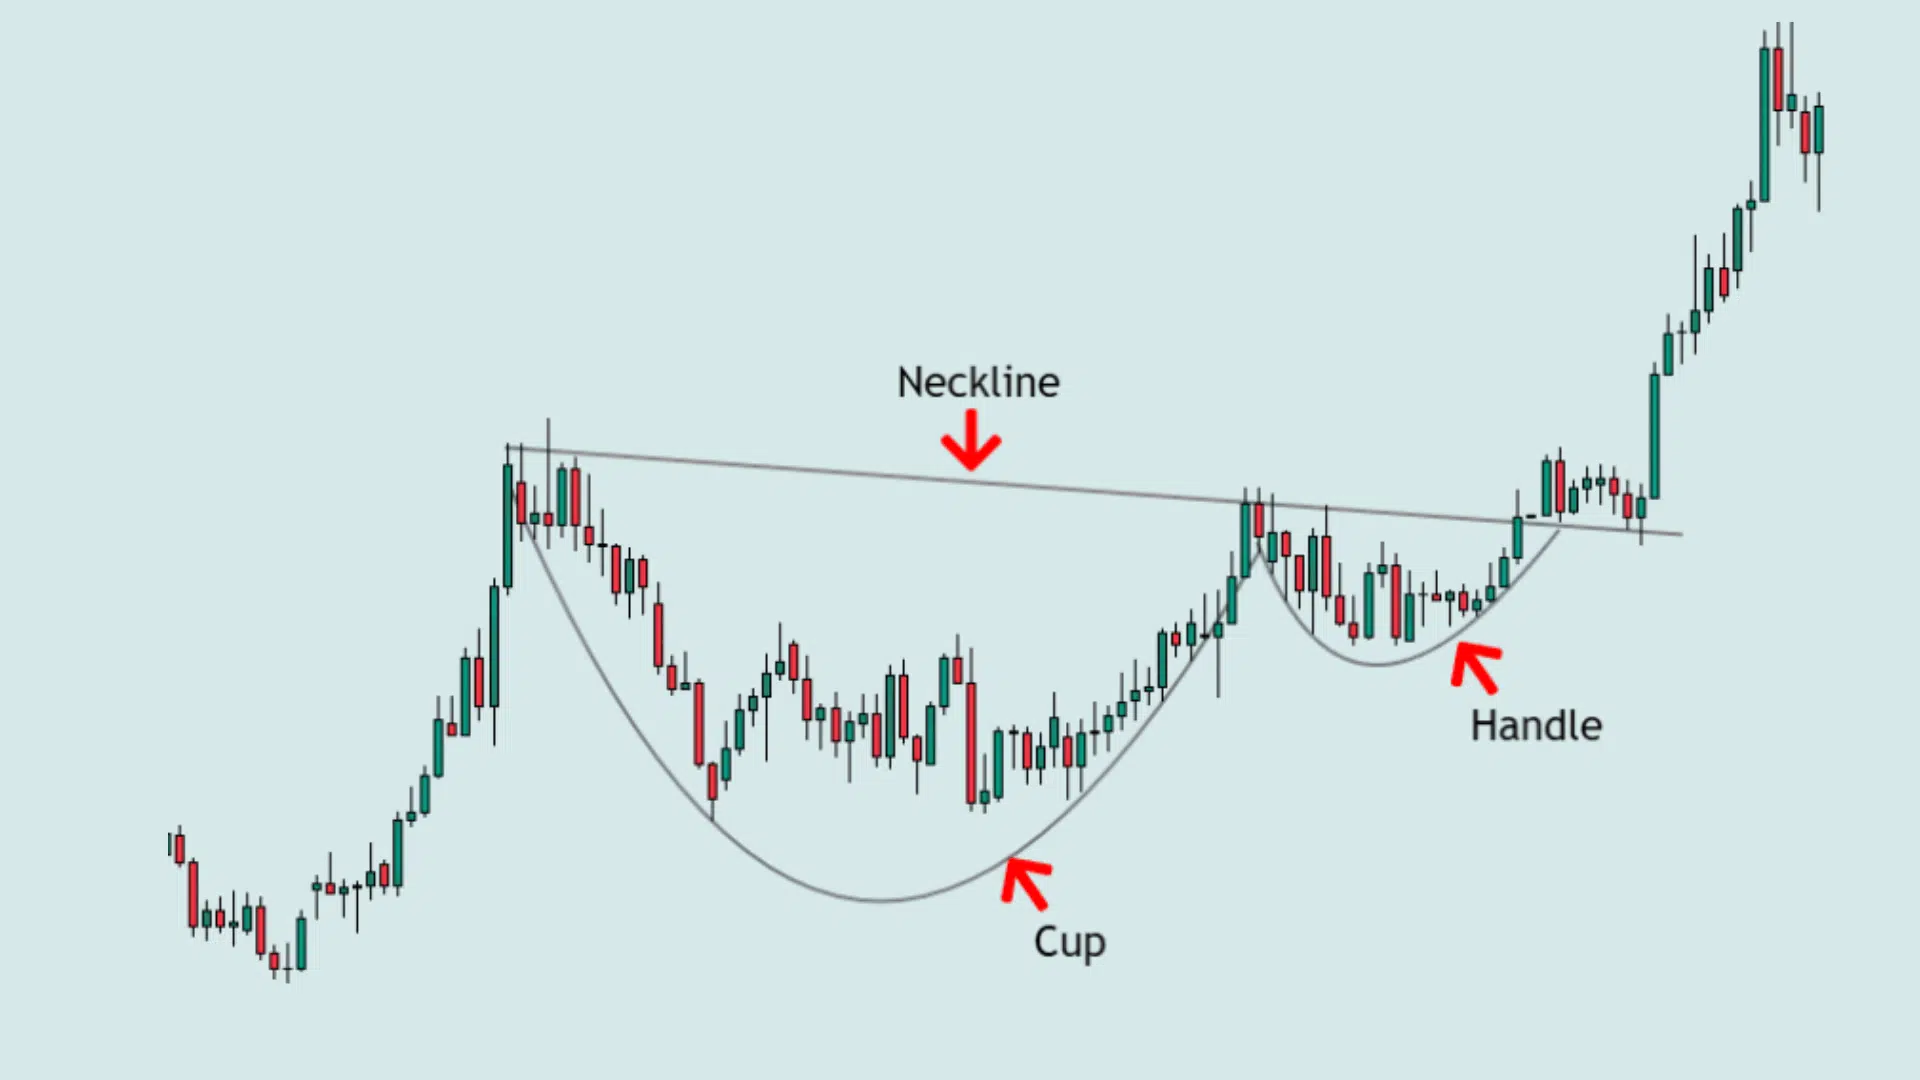
A U-shaped, rounded bottom (cup) followed by a smaller downward drift (handle). The cup forms over weeks or months as the price gradually recovers from a decline. The handle is a short consolidation that shakes out weak holders before the breakout.
- Signal: Bullish continuation showing accumulation before a strong upward breakout.
- How to Trade: Enter when the price clears the handle high with volume. Stop below the handle low. Works best on daily or 60-minute charts.
- Pro Tip: The handle should form in the upper half of the cup for stronger setups.
4. Double Top
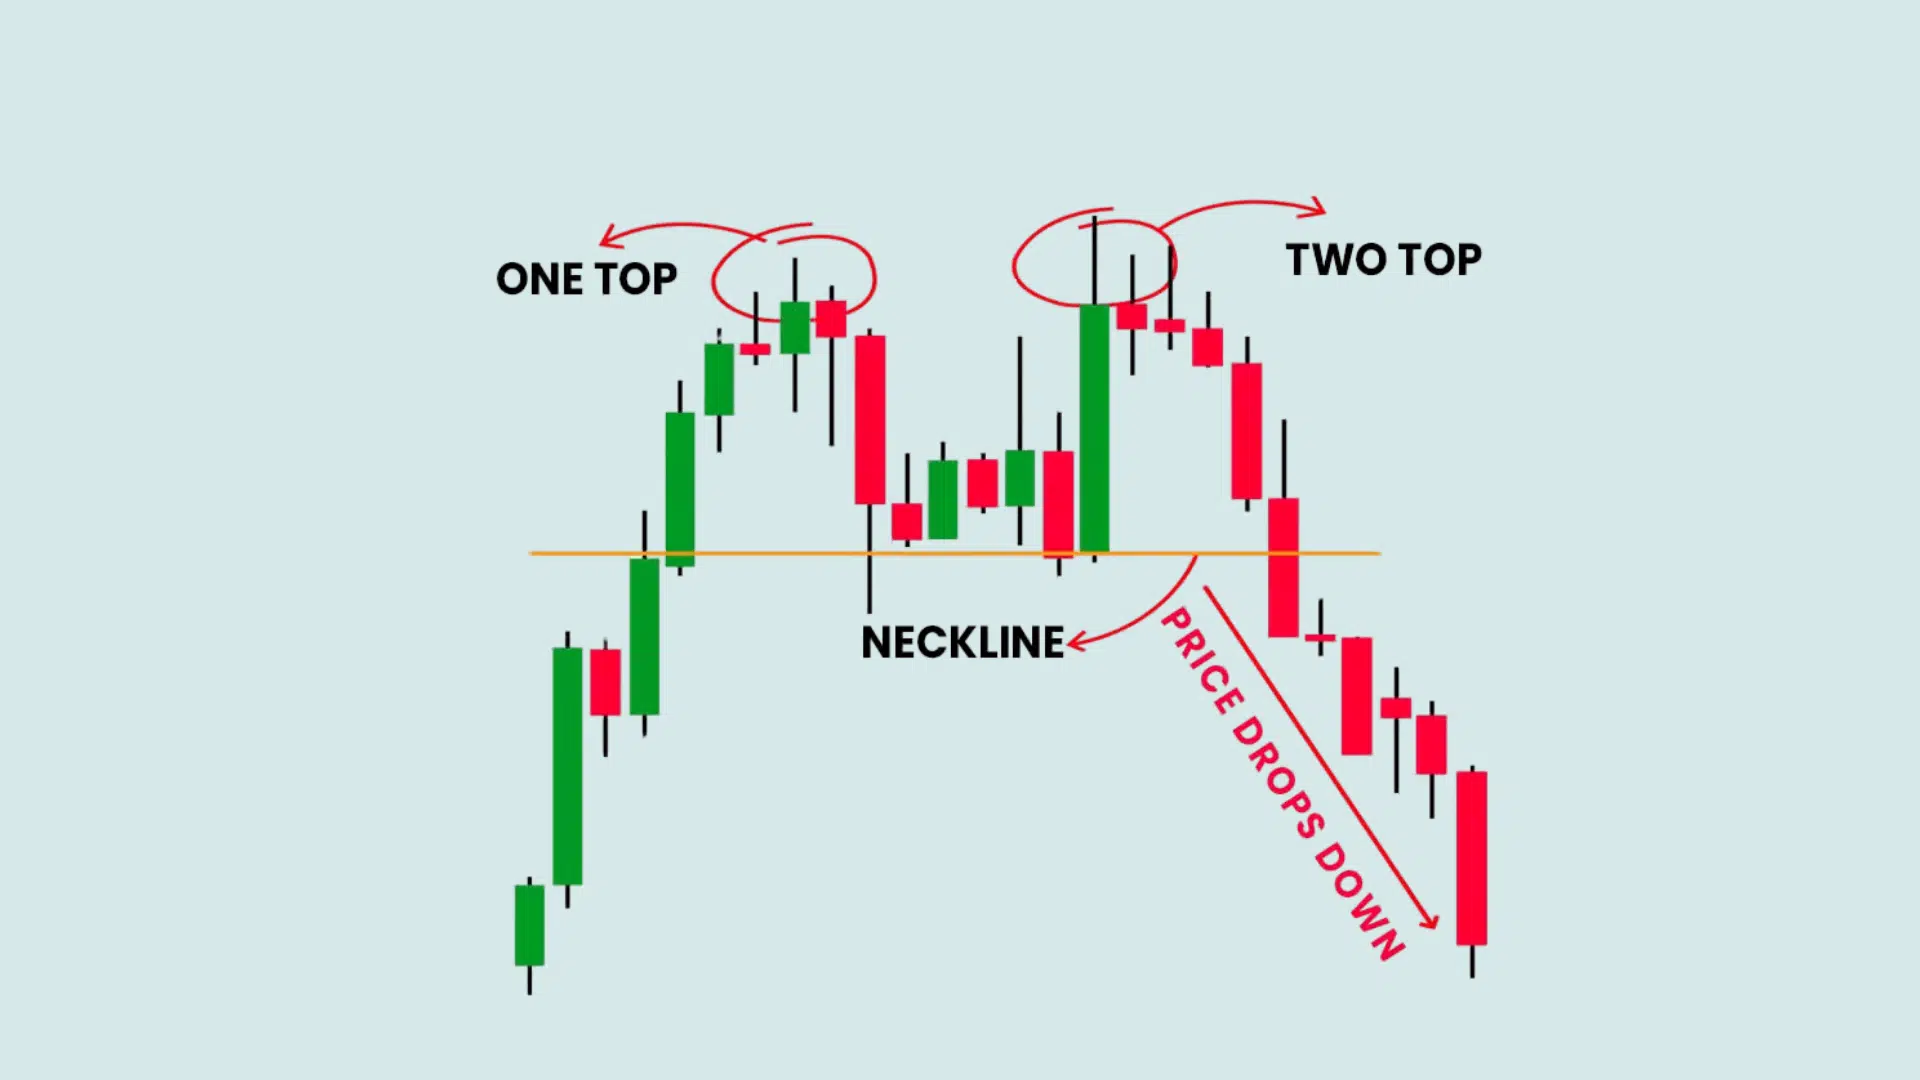
Price hits the same resistance level twice and fails to break through. Each peak reaches approximately the same height, indicating that sellers are defending that price zone. The pattern completes when the price drops below the valley between the two peaks.
- Signal: Strong reversal pattern marking the end of an uptrend.
- How to Trade: Sell or short after price breaks below the valley (neckline) between the two tops. Stop above the second peak. The target is the height from the top to the neckline.
- Pro Tip: Wait for volume increase on neckline break to avoid false signals.
5. Double Bottom
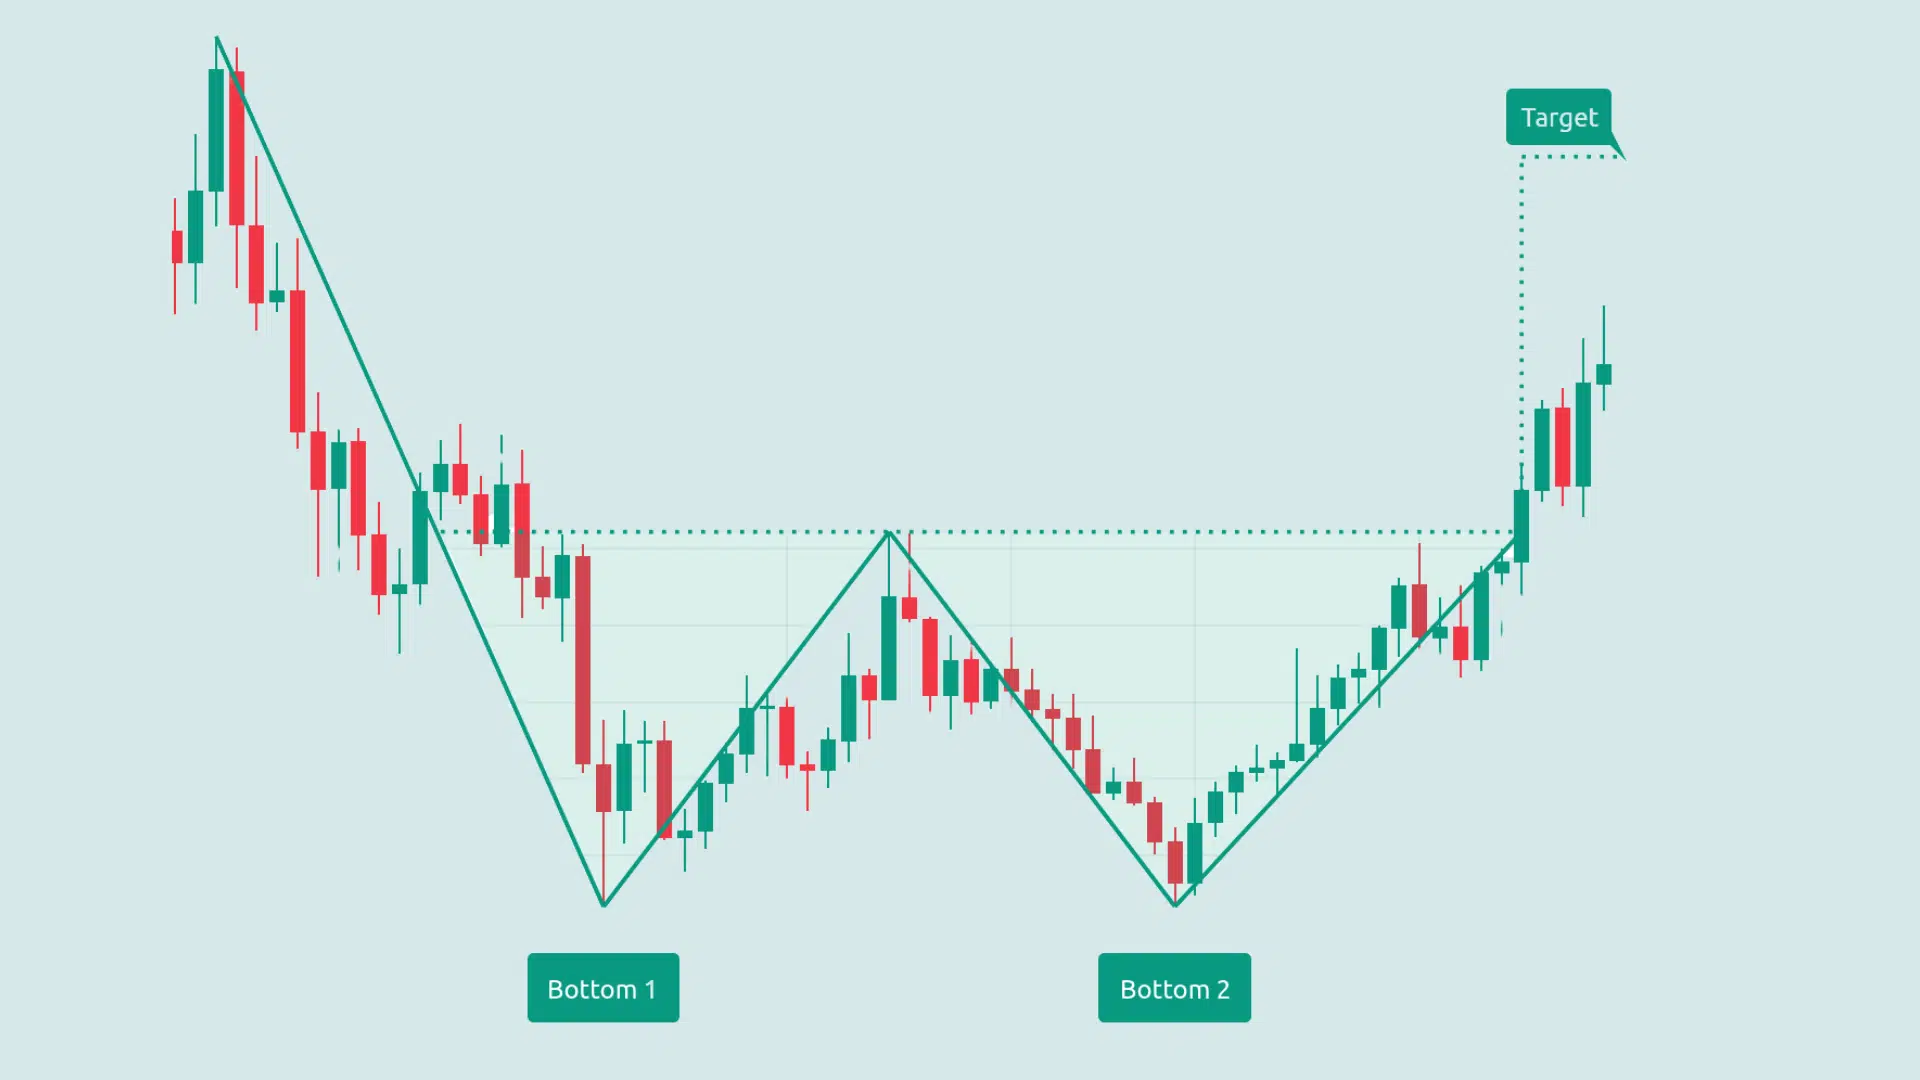
Price tests the same support level twice without breaking lower. Buyers defend the low both times, preventing further decline. The pattern confirms when the price breaks above the peak formed between the two bottoms.
- Signal: Bullish reversal showing buyers are stepping in to defend the low.
- How to Trade: Buy when the price breaks above the peak (neckline) between the two bottoms. Stop below the second bottom. Measure the distance from the bottom to the neckline for the target.
- Pro Tip: The Second bottom often forms with less volume than the first, showing selling exhaustion.
6. Head and Shoulders
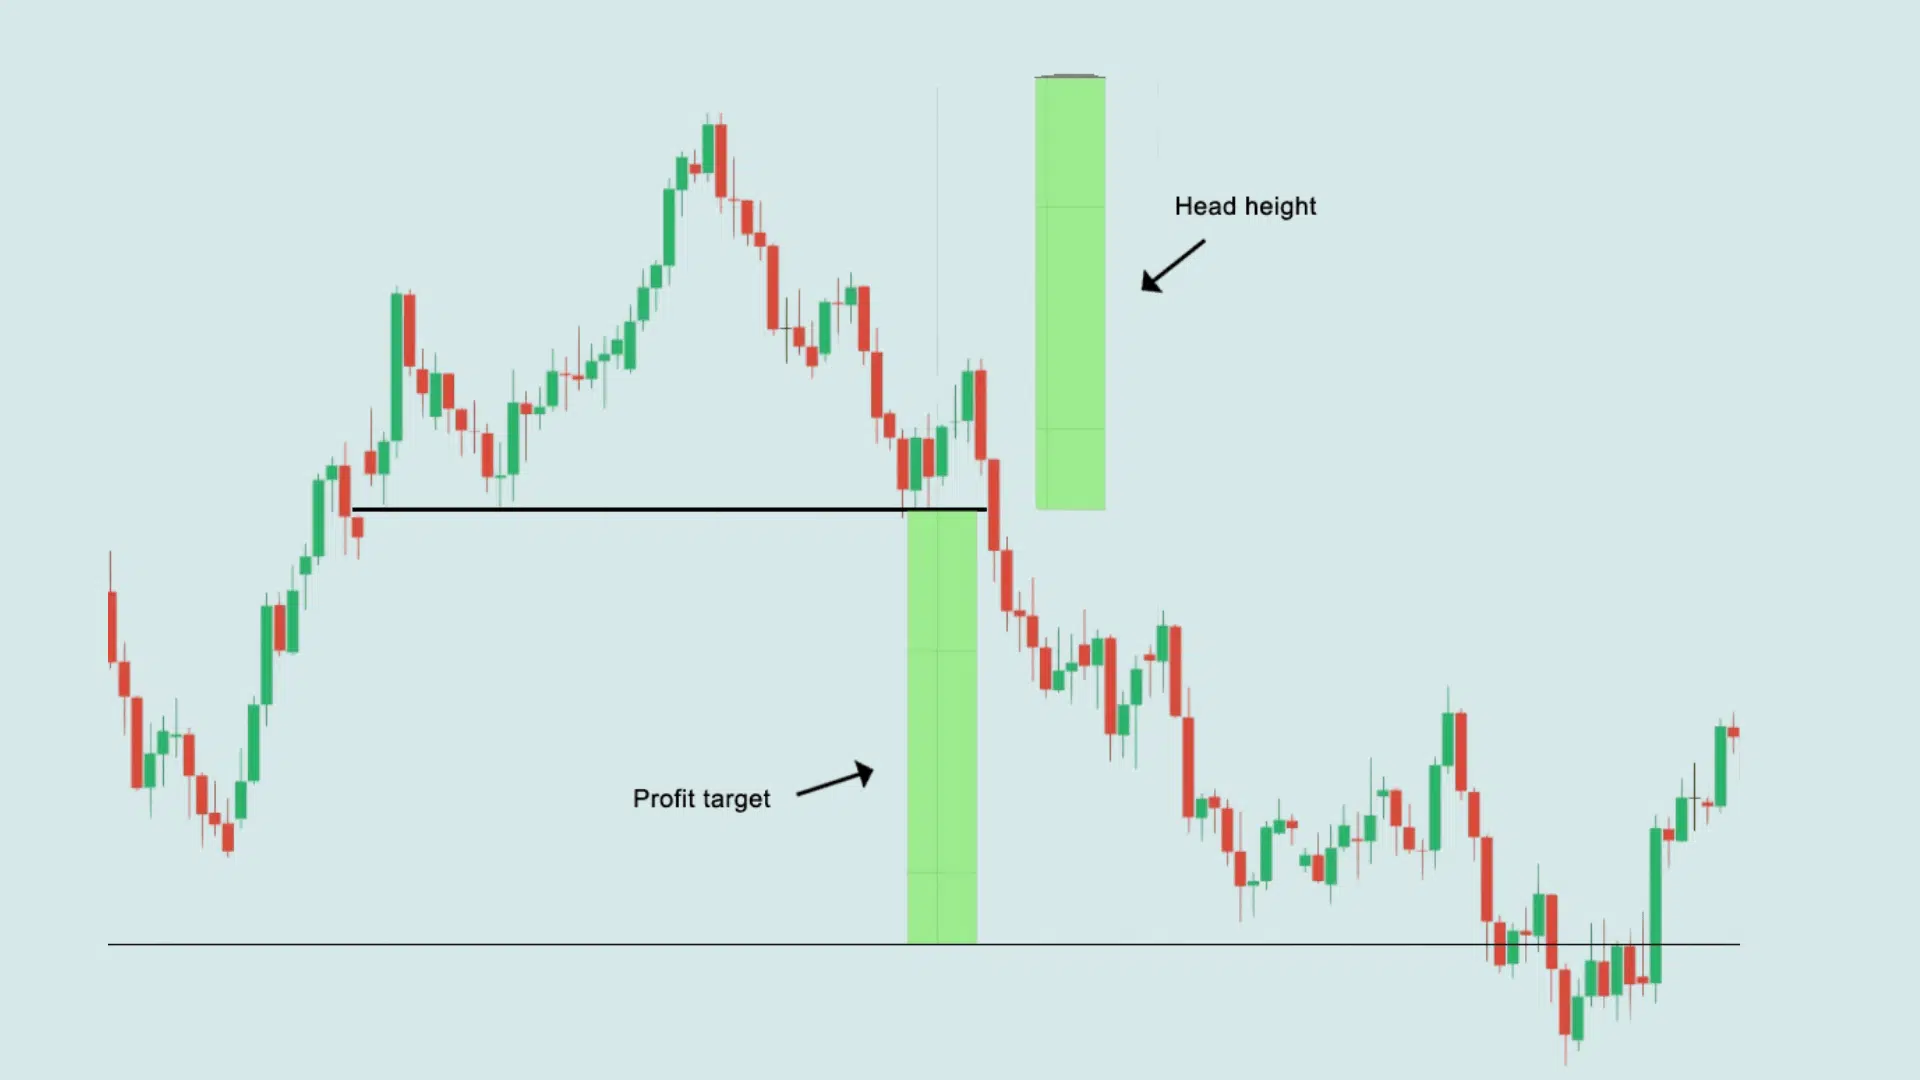
Three peaks where the middle one (head) is tallest and the outer two (shoulders) are roughly equal. The left shoulder forms first as the price reaches a high, then pulls back. Price then rallies higher to form the head before declining again to create the right shoulder.
- Signal: Classic reversal pattern signaling the uptrend is losing steam.
- How to Trade: Short after the price closes below the neckline connecting the two troughs. Stop above the right shoulder. The target is the projected distance from the neckline to the head.
- Pro Tip: Forming the right shoulder on low volume strengthens pattern reliability.
7. Inverse Head and Shoulders
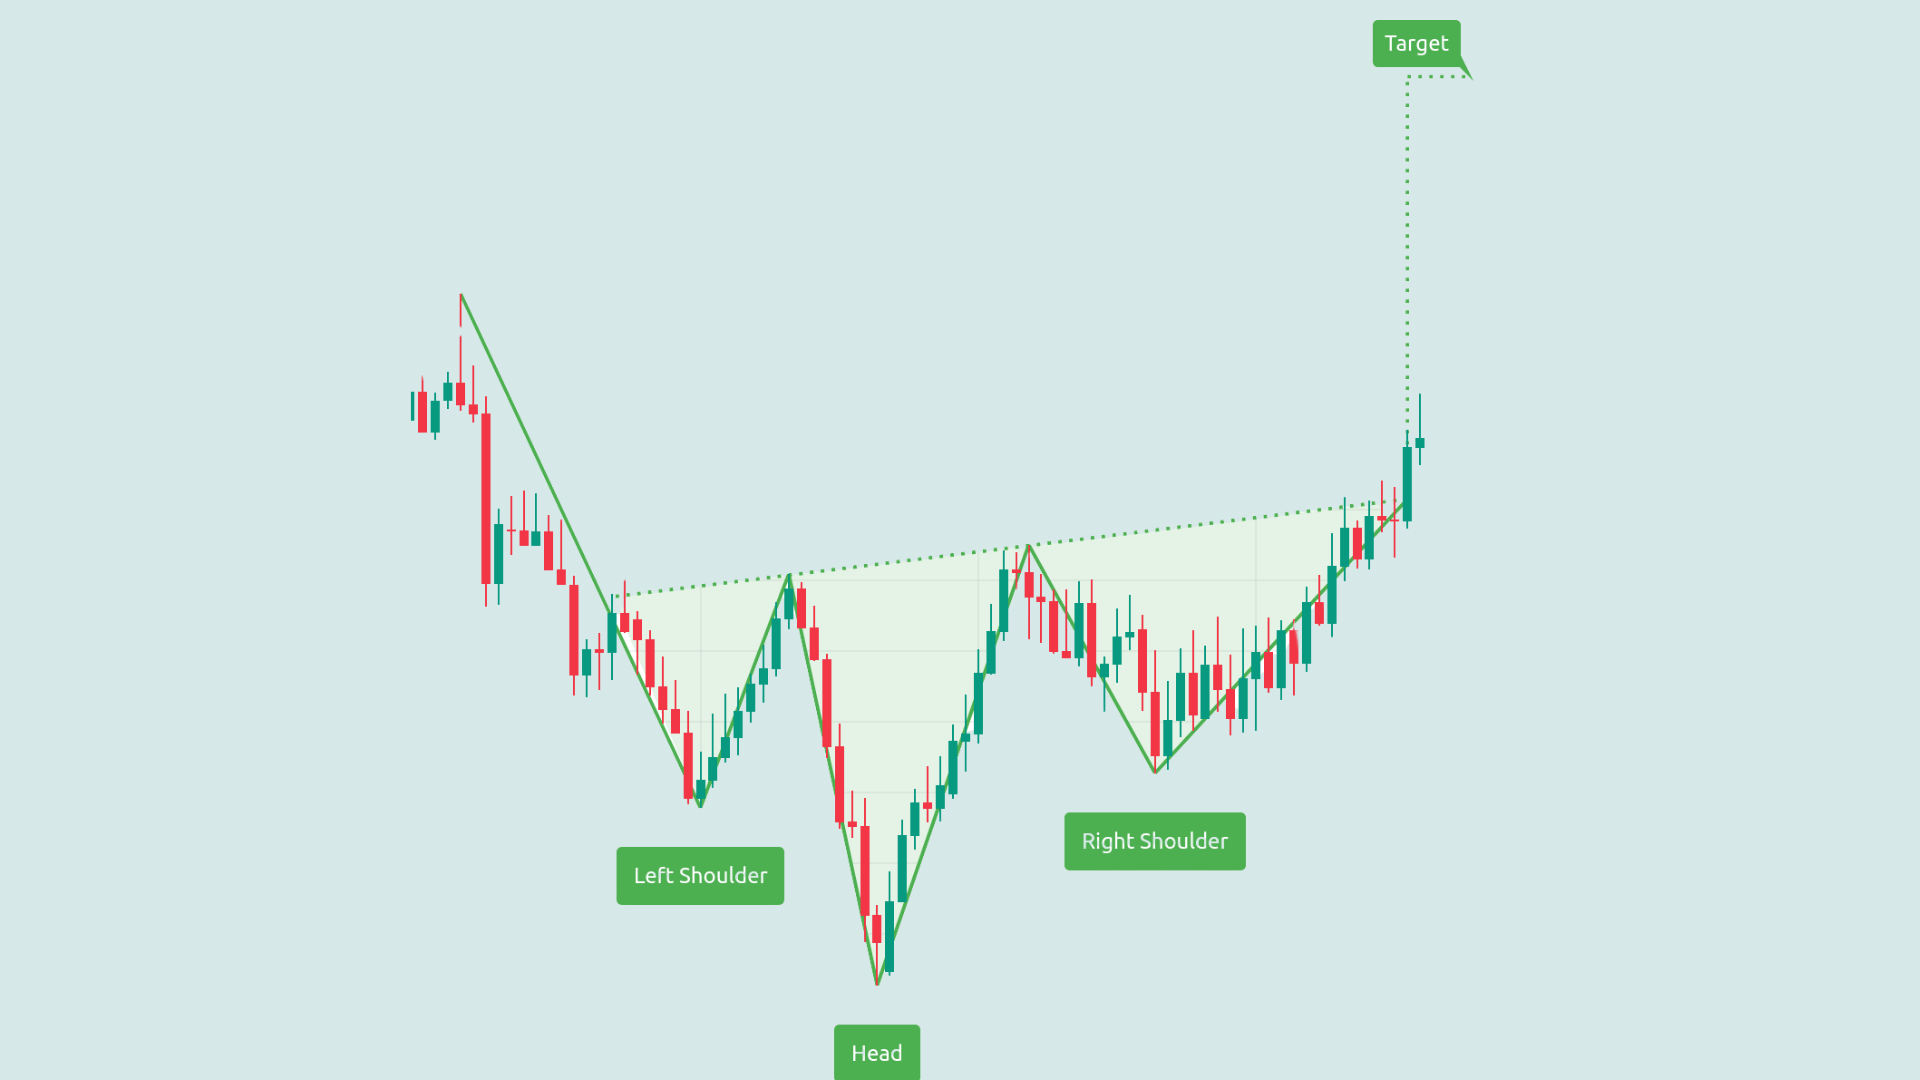
Three valleys with the middle one (head) lowest and the two outer ones (shoulders) at similar levels. The price dips to form the left shoulder, drops even lower for the head, and then bounces back up. The right shoulder forms at a higher low than the head, indicating that buyers are gaining strength.
- Signal: A bullish reversal indicating that buyers are gaining control after a downtrend.
- How to Trade: Buy after the price breaks above the neckline. Stop below the right shoulder. Project the head-to-neckline distance upward for the target.
- Pro Tip: Volume should expand on the neckline breakout for confirmation.
8. Ascending Triangle
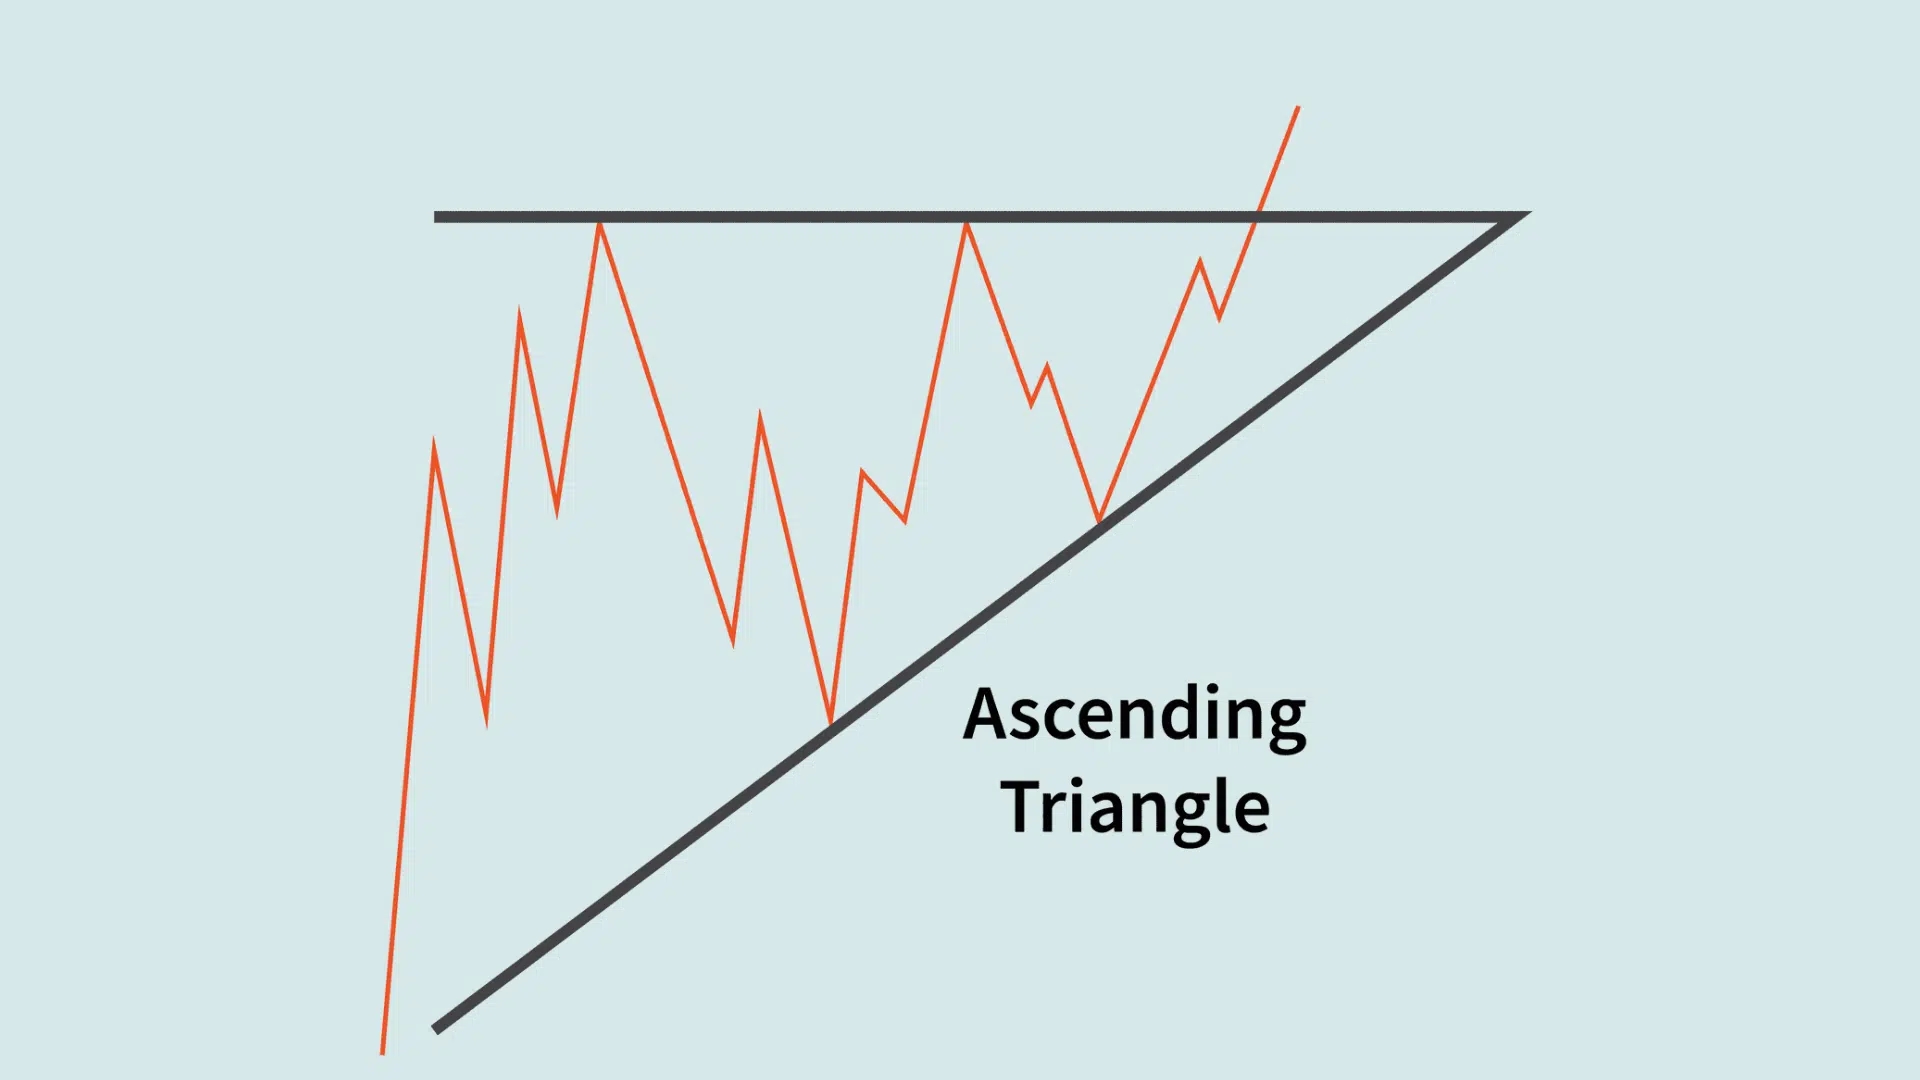
Flat horizontal resistance line with rising support creating a triangle. Price repeatedly tests the same high but can’t break through yet. Meanwhile, buyers push each low higher, squeezing price into a tighter range near resistance.
- Signal: Bullish continuation showing buyers pushing higher lows while resistance holds temporarily.
- How to Trade: Buy the breakout above resistance with a volume spike. Stop below the last higher low. Measure the triangle’s height to determine the profit target.
- Pro Tip: Watch for at least three touches on each trendline before considering it valid.
9. Descending Triangle
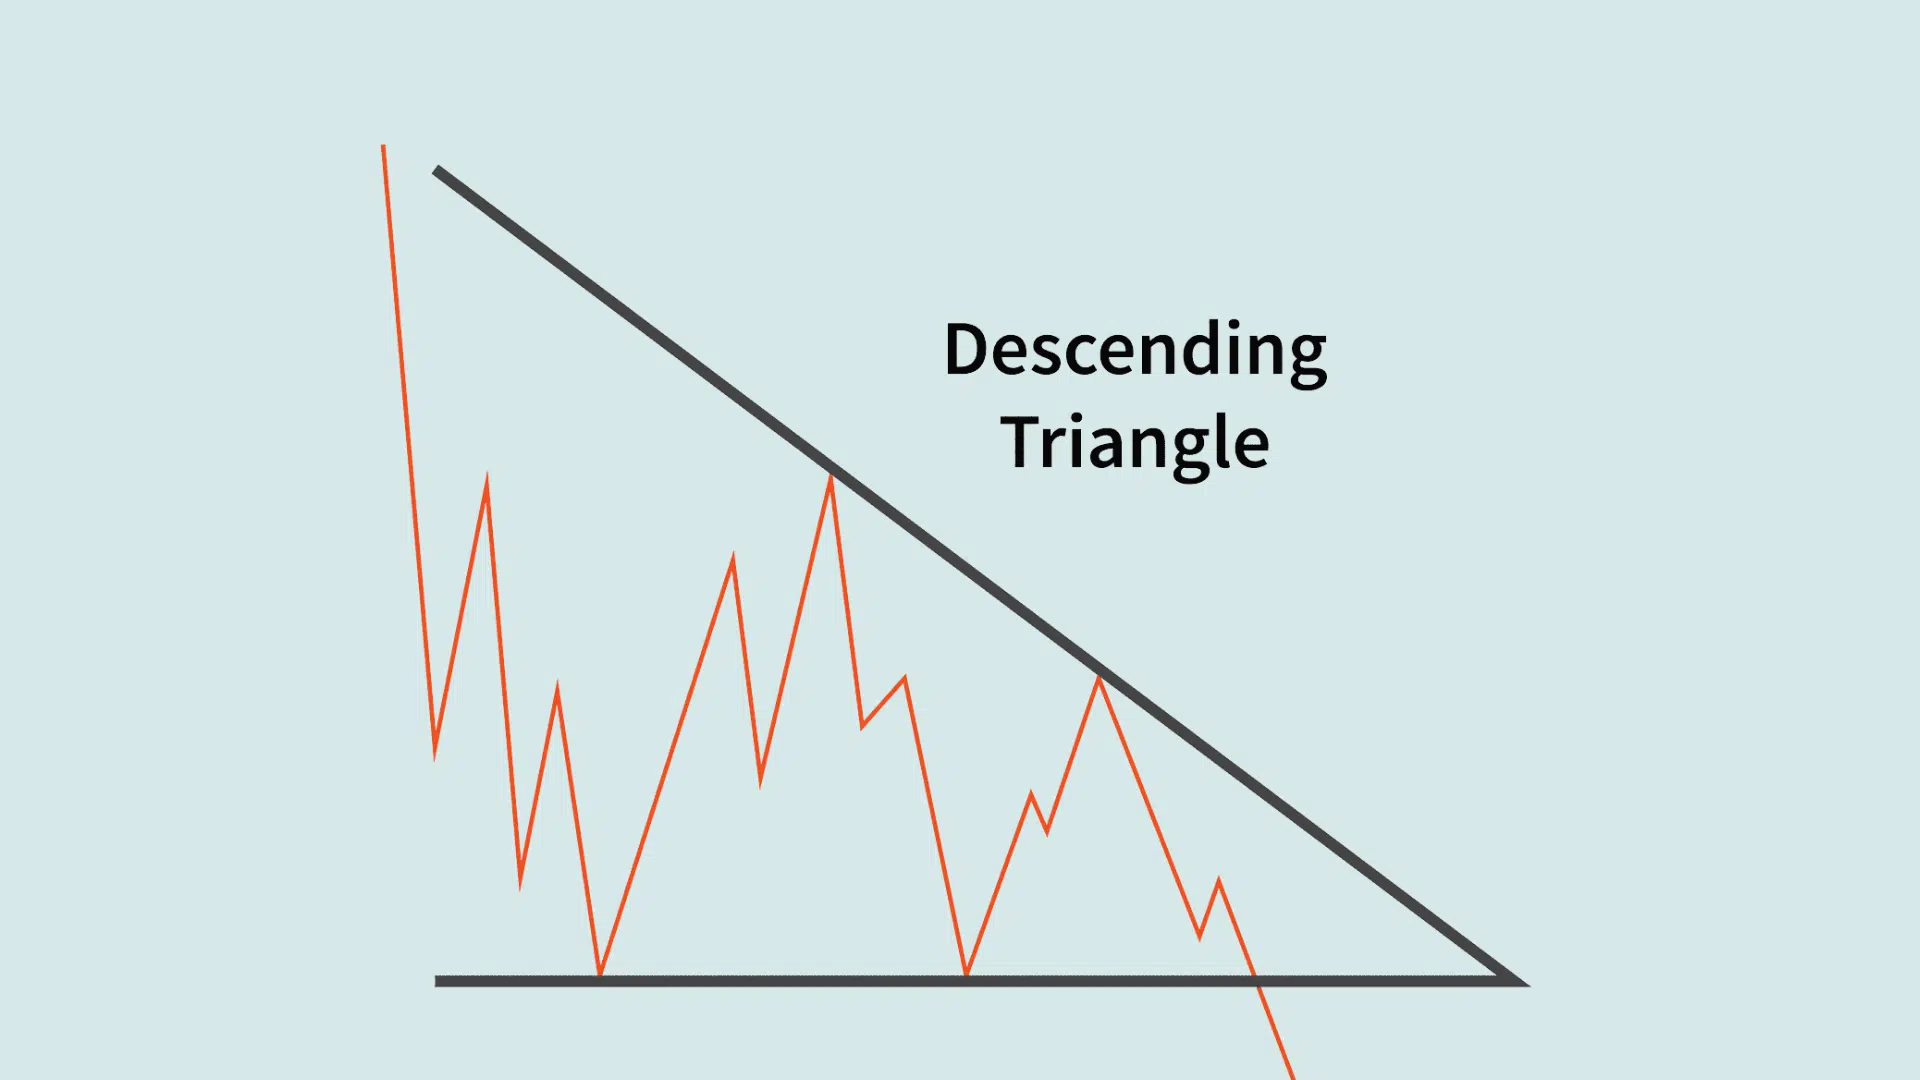
Flat horizontal support with descending resistance forming a downward triangle. Sellers keep pushing prices to lower highs while buyers defend the same support level. The squeeze builds pressure until support finally breaks.
- Signal: A bearish continuation pattern shows sellers making lower highs while support weakens.
- How to Trade: Short when the price breaks below the support level. Stop above the last lower high. Target equals the triangle height projected downward.
- Pro Tip: Breakdowns often happen quickly, so have orders ready before the break.
10. Symmetrical Triangle
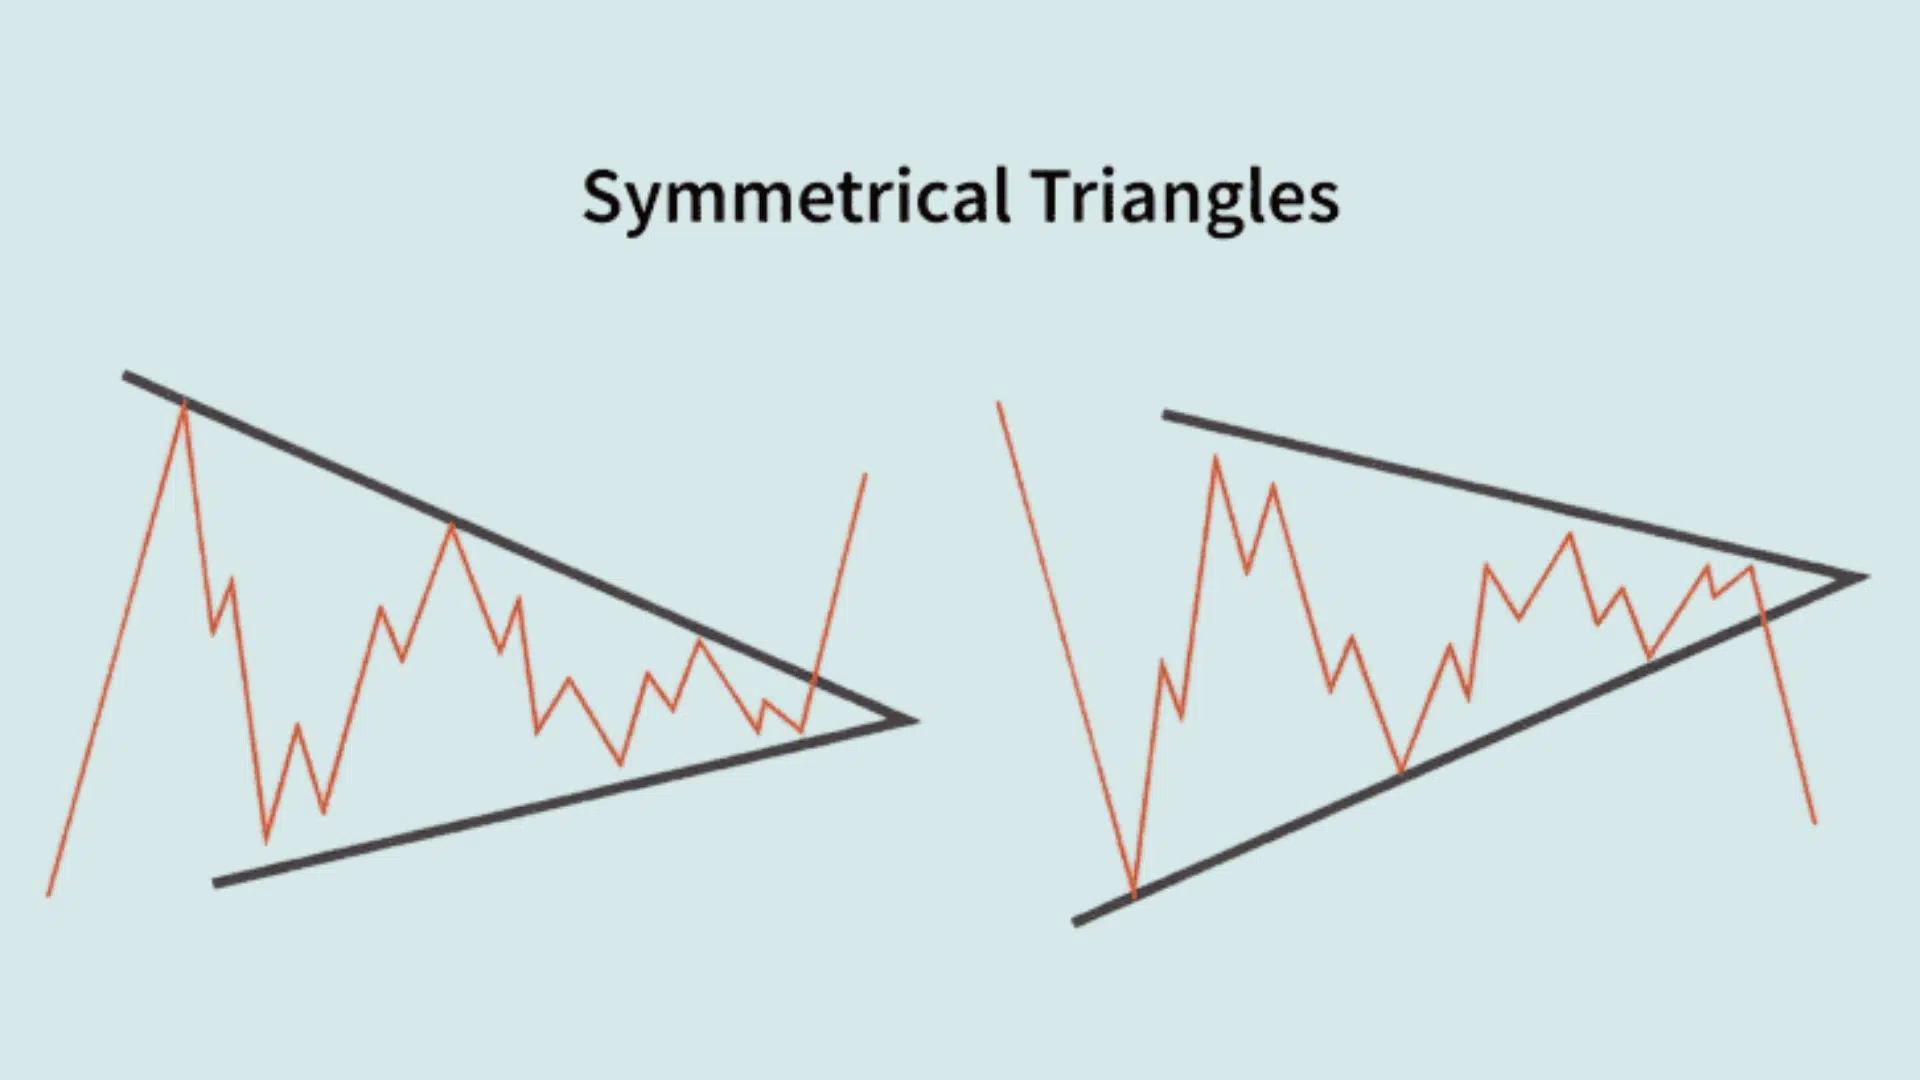
Converging trendlines with lower highs and higher lows create a triangle. Neither buyers nor sellers have clear control as price oscillates in a tightening range. The pattern shows indecision that will resolve with a strong breakout in either direction.
- Signal: Neutral pattern that can break either direction depending on market momentum.
- How to Trade: Wait for volume-confirmed breakout in either direction. Enter the breakout direction with a stop on the opposite side. The target is the height of the triangle from the breakout point.
- Pro Tip: Avoid trading inside the triangle as price whipsaws between boundaries.
11. Falling Wedge
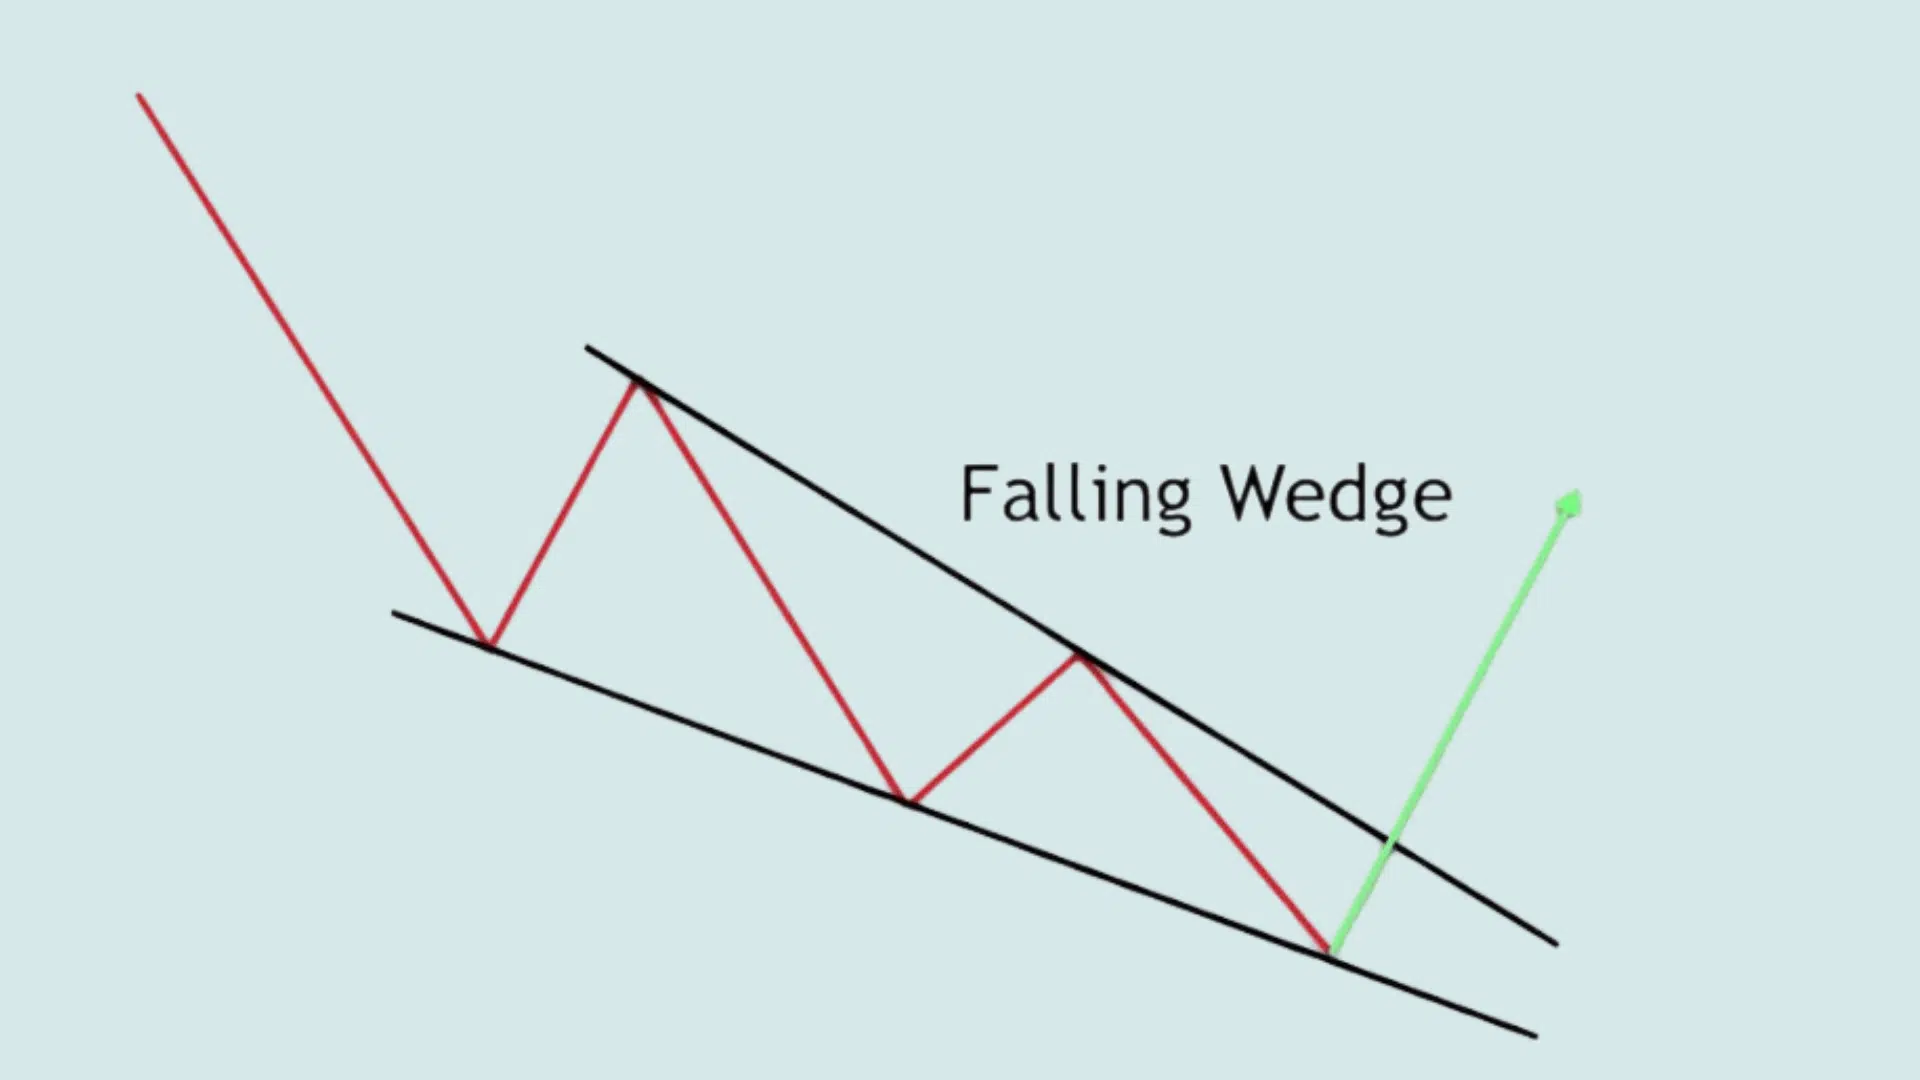
A downward sloping channel where both support and resistance trend lower but converge. Price makes lower lows and lower highs, but the range between them narrows over time. This compression indicates that selling momentum is fading as buyers prepare to take control.
- Signal: Bullish reversal showing selling pressure weakening as price compresses.
- How to Trade: Buy when the price breaks above the upper trendline with volume. Stop below the wedge. Target equals widest part of wedge projected upward.
- Pro Tip: Pattern works best after an extended downtrend showing exhaustion.
12. Rising Wedge
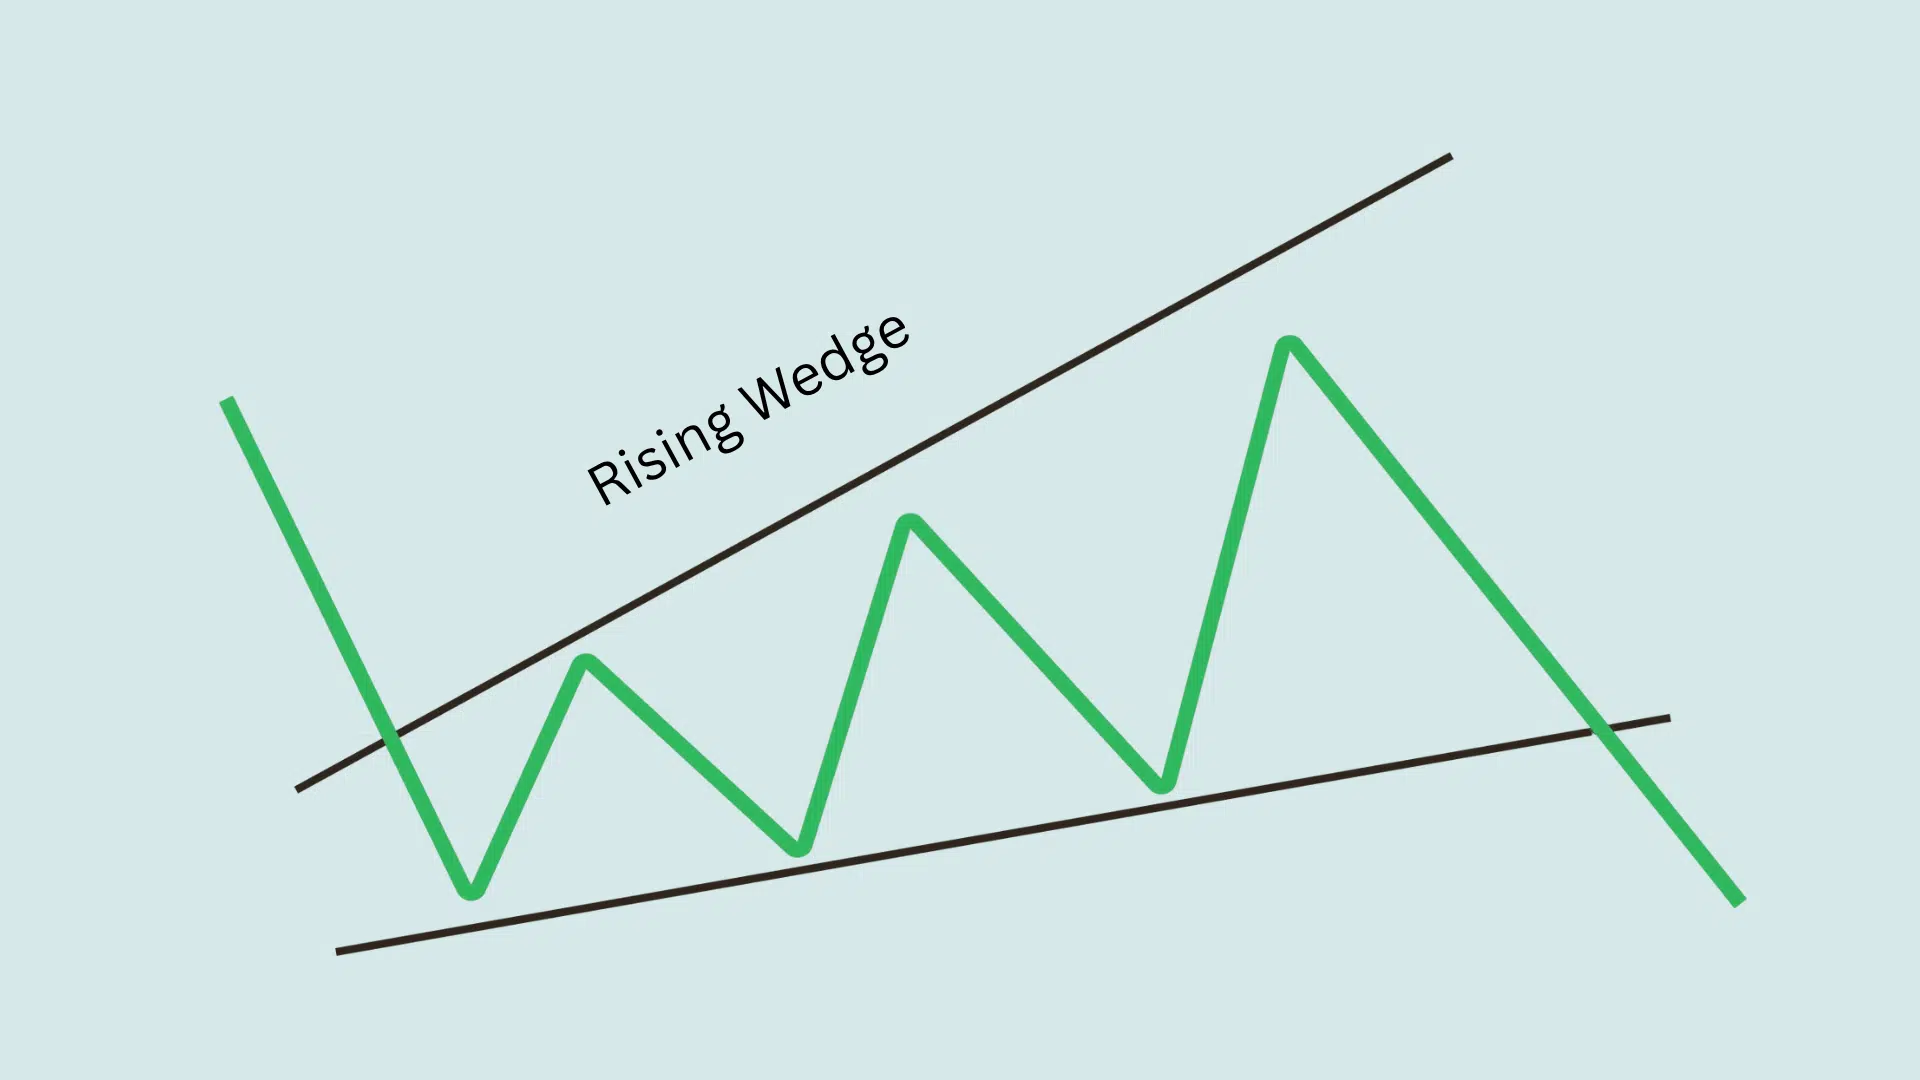
Upward sloping channel where both lines angle higher but converge at the top. Price continues making higher highs and higher lows, but gains become smaller with each push. The narrowing range signals buyers are losing steam despite the upward appearance.
- Signal: Bearish reversal, indicating buying momentum is fading despite higher prices.
- How to Trade: Short when price breaks below the lower trendline. Stop above recent high. Measure widest wedge point for downside target.
- Pro Tip: Volume typically decreases as wedge forms, confirming weakening momentum.
13. Rectangle Pattern (Range Consolidation)
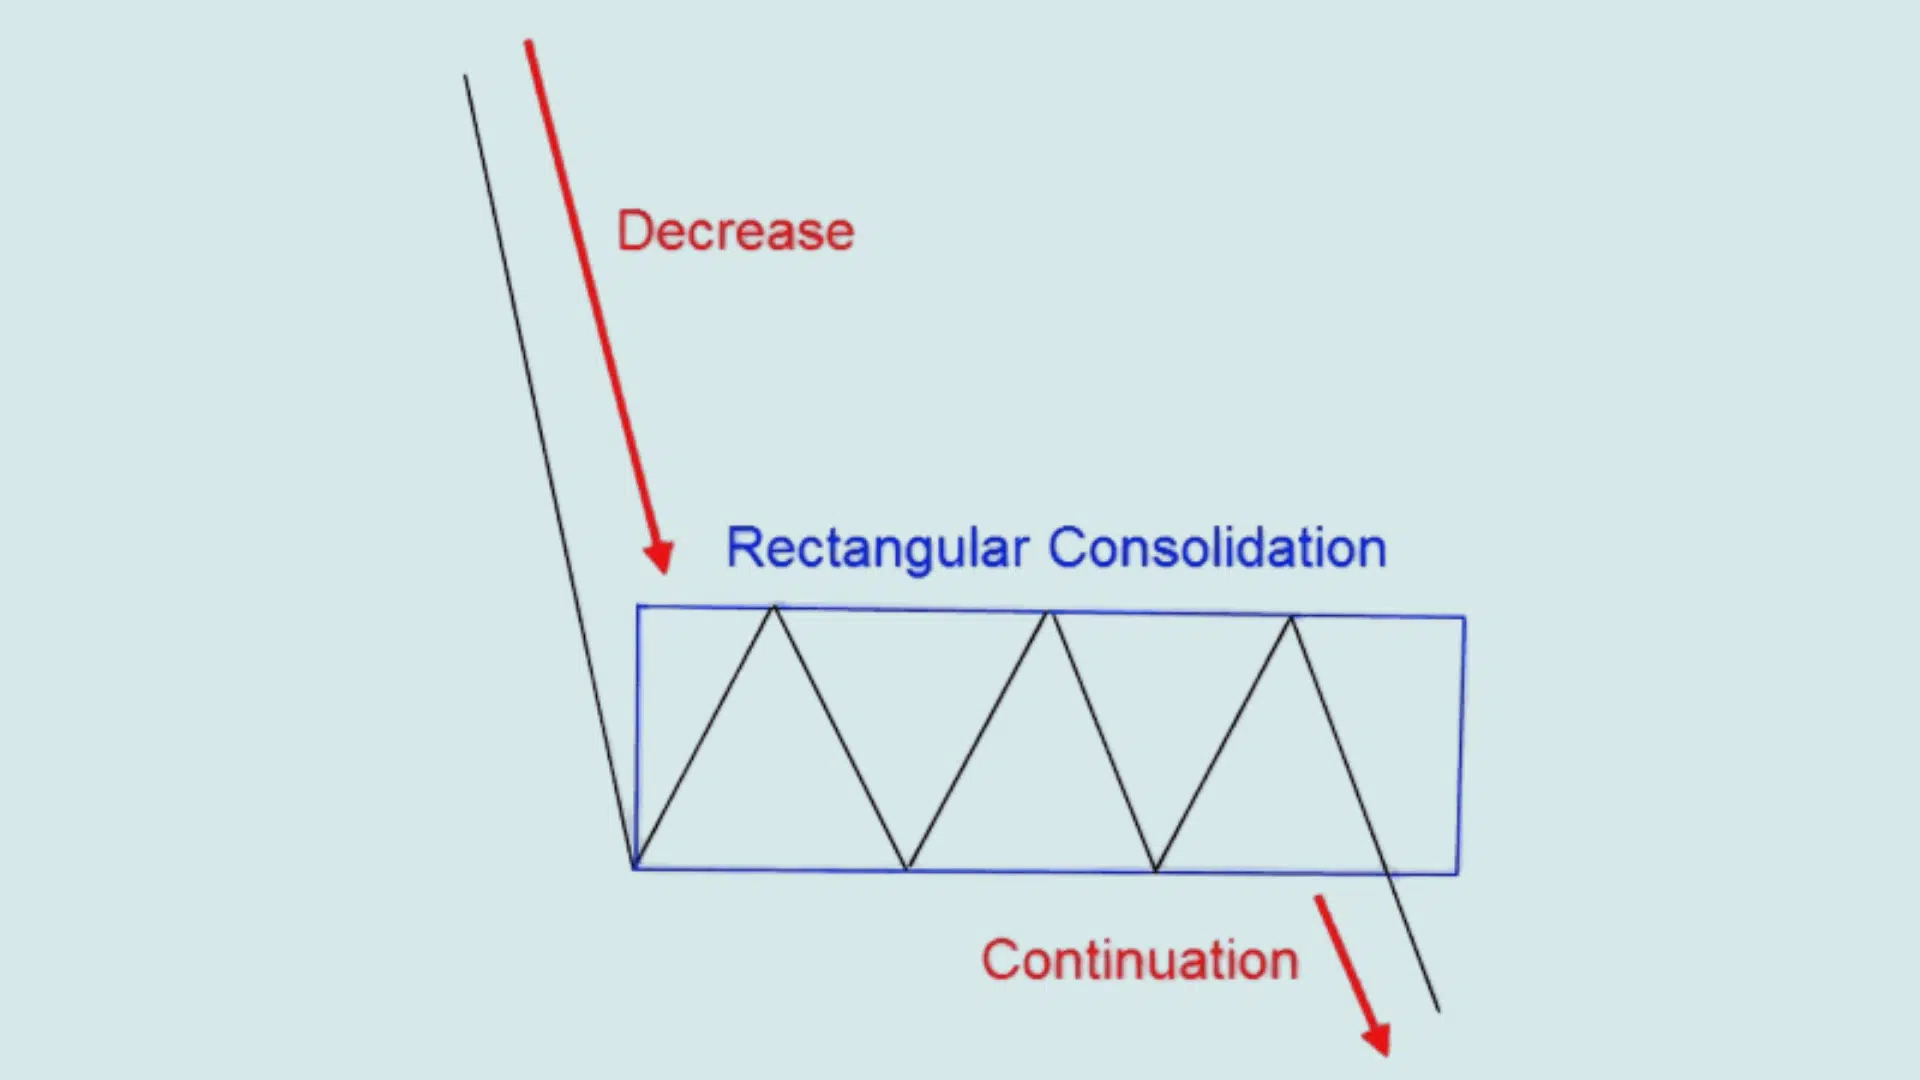
Price bounces between parallel horizontal support and resistance lines. The stock trades sideways in a defined range as buyers and sellers reach temporary equilibrium. Multiple tests of both levels show the boundaries holding firm until a breakout occurs.
- Signal: Neutral consolidation until breakout determines next direction.
- How to Trade: Trade the breakout above resistance (buy) or below support (sell) with volume. Avoid entries inside the range. The target is the rectangle height from the breakout.
- Pro Tip: More touches on boundaries make the eventual breakout more reliable.
14. Gap and Go Pattern
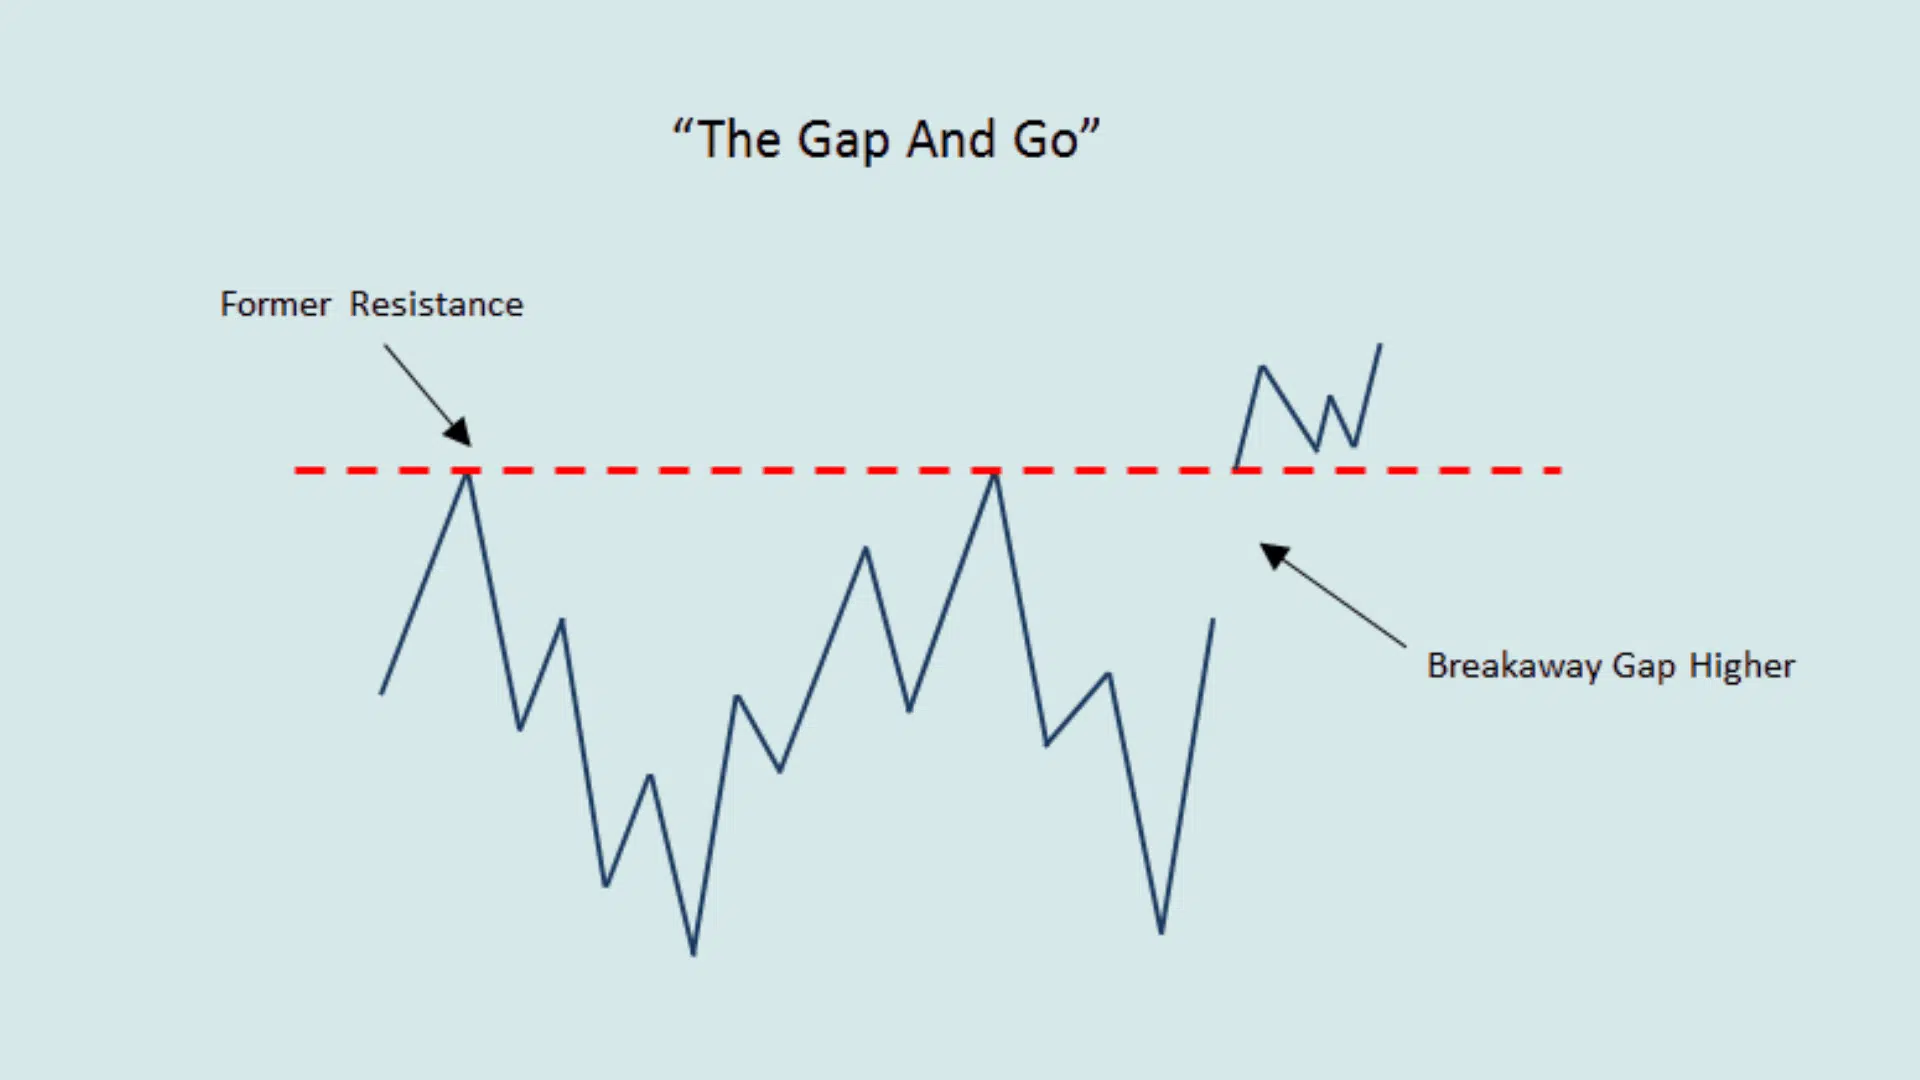
Stock opens significantly higher or lower than the previous close, creating a price gap. This happens when news, earnings reports, or major events trigger heavy buying or selling before market open. The gap leaves empty space on the chart with no trading activity at those price levels.
- Signal: Strong intraday momentum play driven by news, earnings, or market catalysts.
- How to Trade: Enter in the gap direction once the price confirms continuation with volume. Use the first pullback as an entry. Stop below/above the gap zone.
- Pro Tip: Best traded in the first 30-60 minutes of market open when volume is highest.
15. Breakout Failure (Fakeout) Pattern
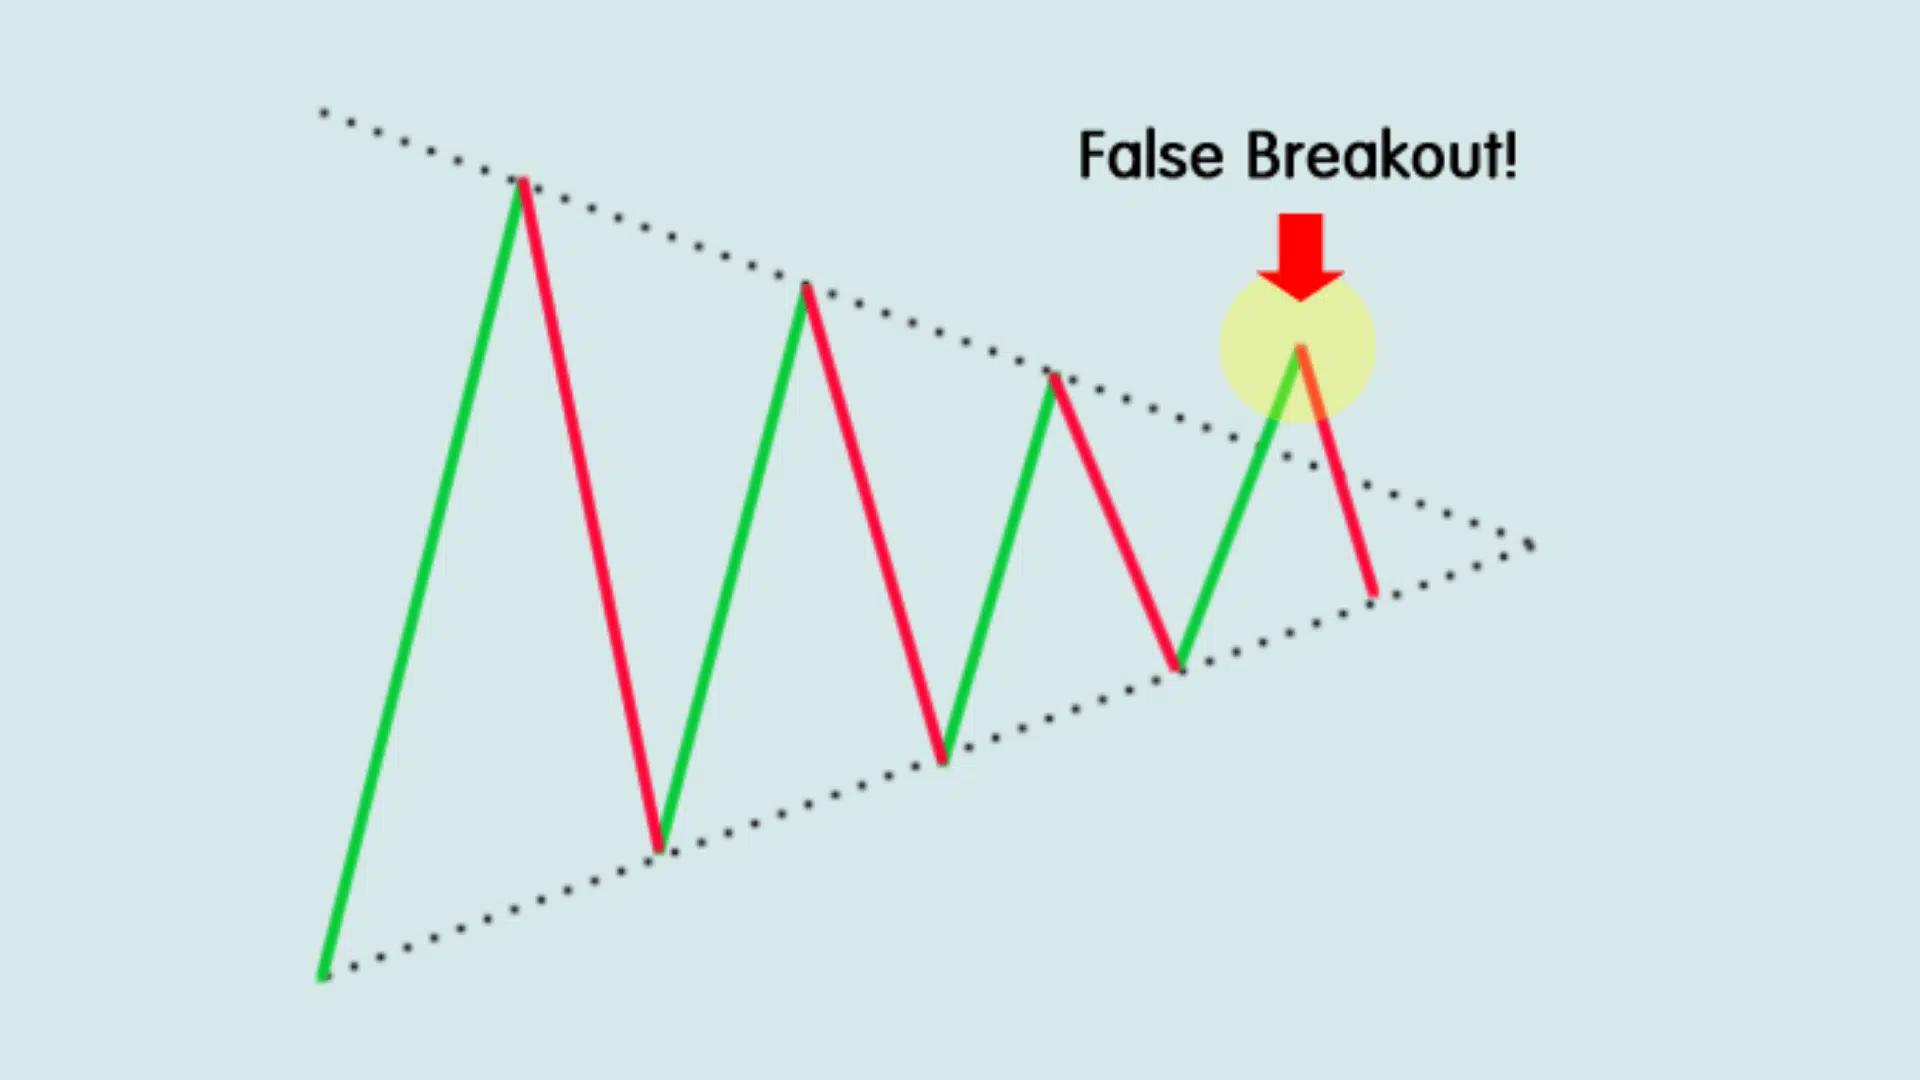
A price break that breaks through support or resistance but quickly reverses back inside the range. The false move triggers stop losses and traps traders who entered the breakout too early. This creates fuel for a strong move in the opposite direction as trapped traders exit.
- Signal: False breakout that traps traders on the wrong side, leading to a fast reversal.
- How to Trade: Enter opposite the failed breakout direction once the price closes back inside the range. Stop beyond the false breakout level. Target opposite boundary.
- Pro Tip: Fakeouts often happen on low volume, then reverse with a strong volume spike.
16. Hammer & Inverted Hammer
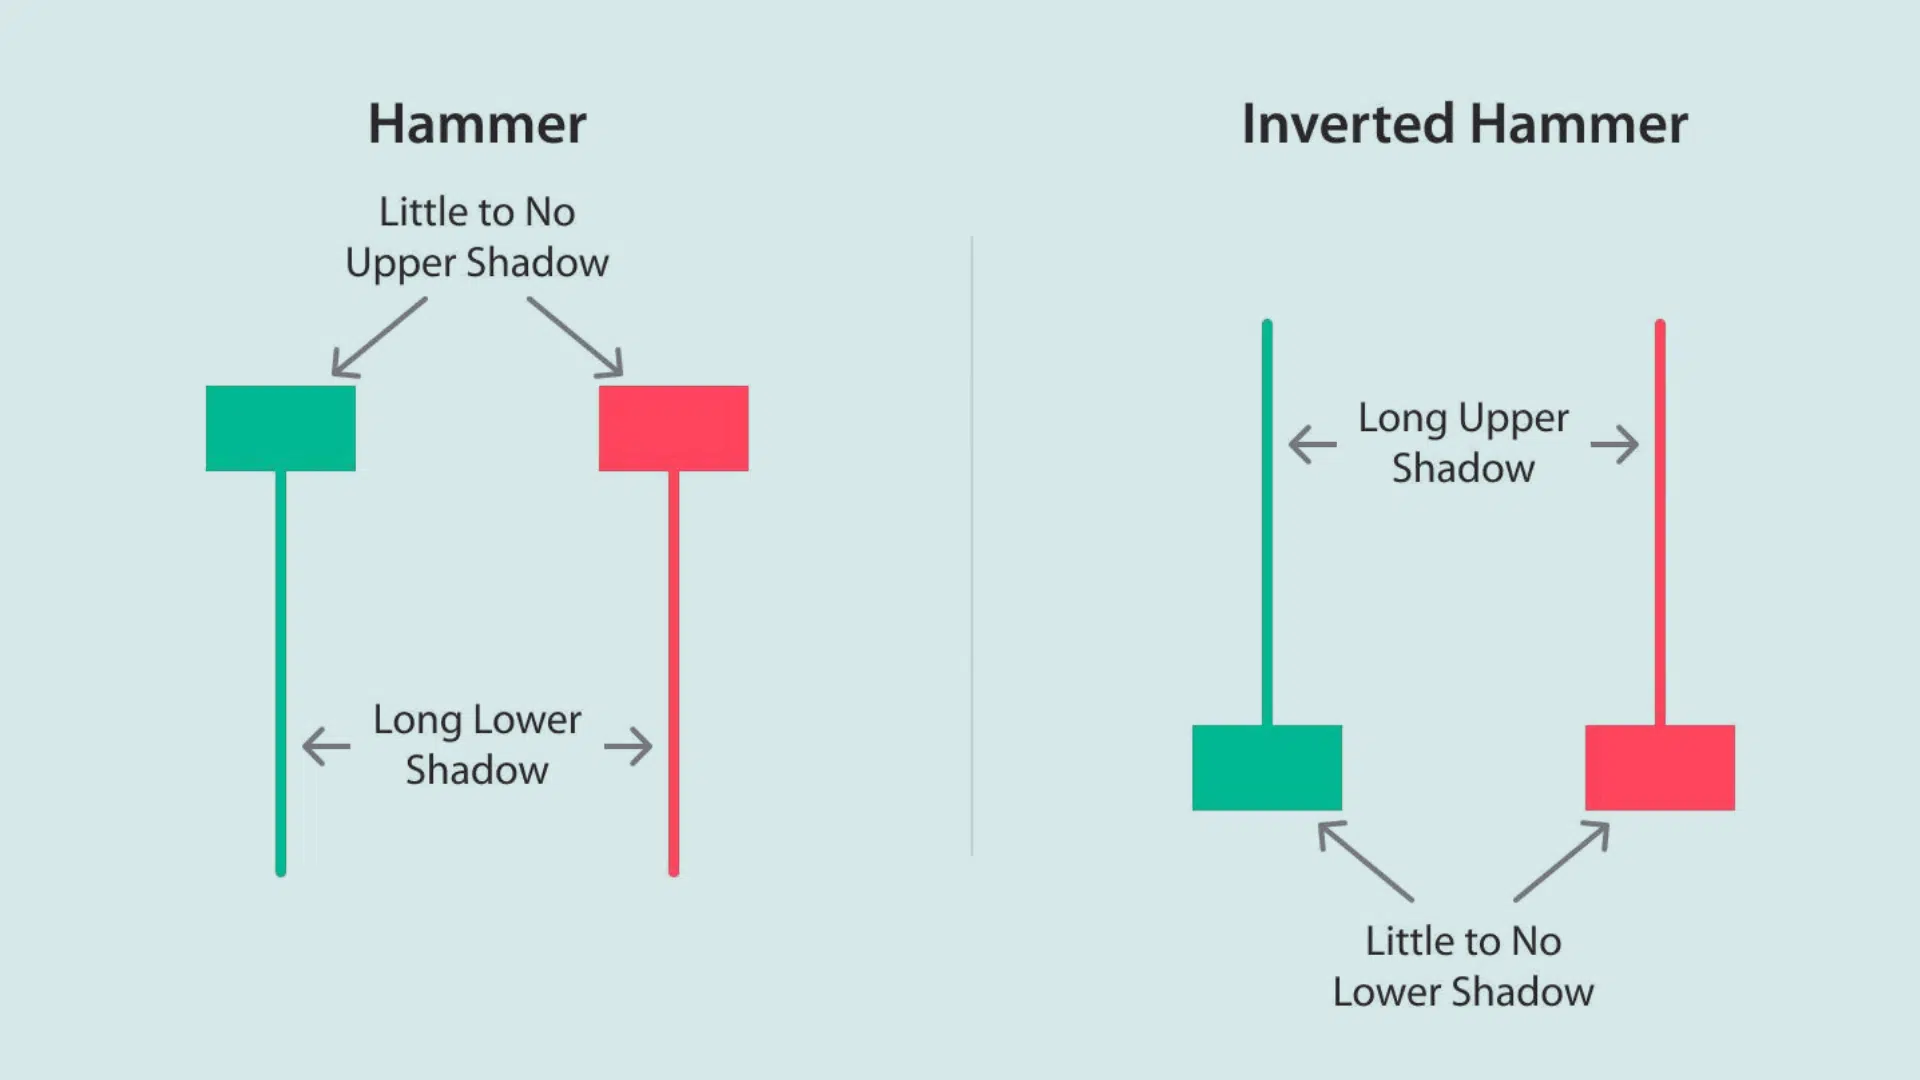
Candlestick with a small body and long lower wick (hammer) or upper wick (inverted hammer). The long wick indicates that the price was pushed significantly lower or higher during the period, but it closed near the open. This rejection indicates strong buying at lows or selling at highs.
- Signal: Shows price rejection at lows or highs, indicating potential reversal.
- How to Trade: Hammer at support: buy next candle if it closes higher. Inverted hammer: wait for bullish confirmation. Use tight stops below/above the wick.
- Pro Tip: Works best on 5-minute or 15-minute charts for quick intraday reversal trades.
17. Engulfing Pattern (Bullish & Bearish)
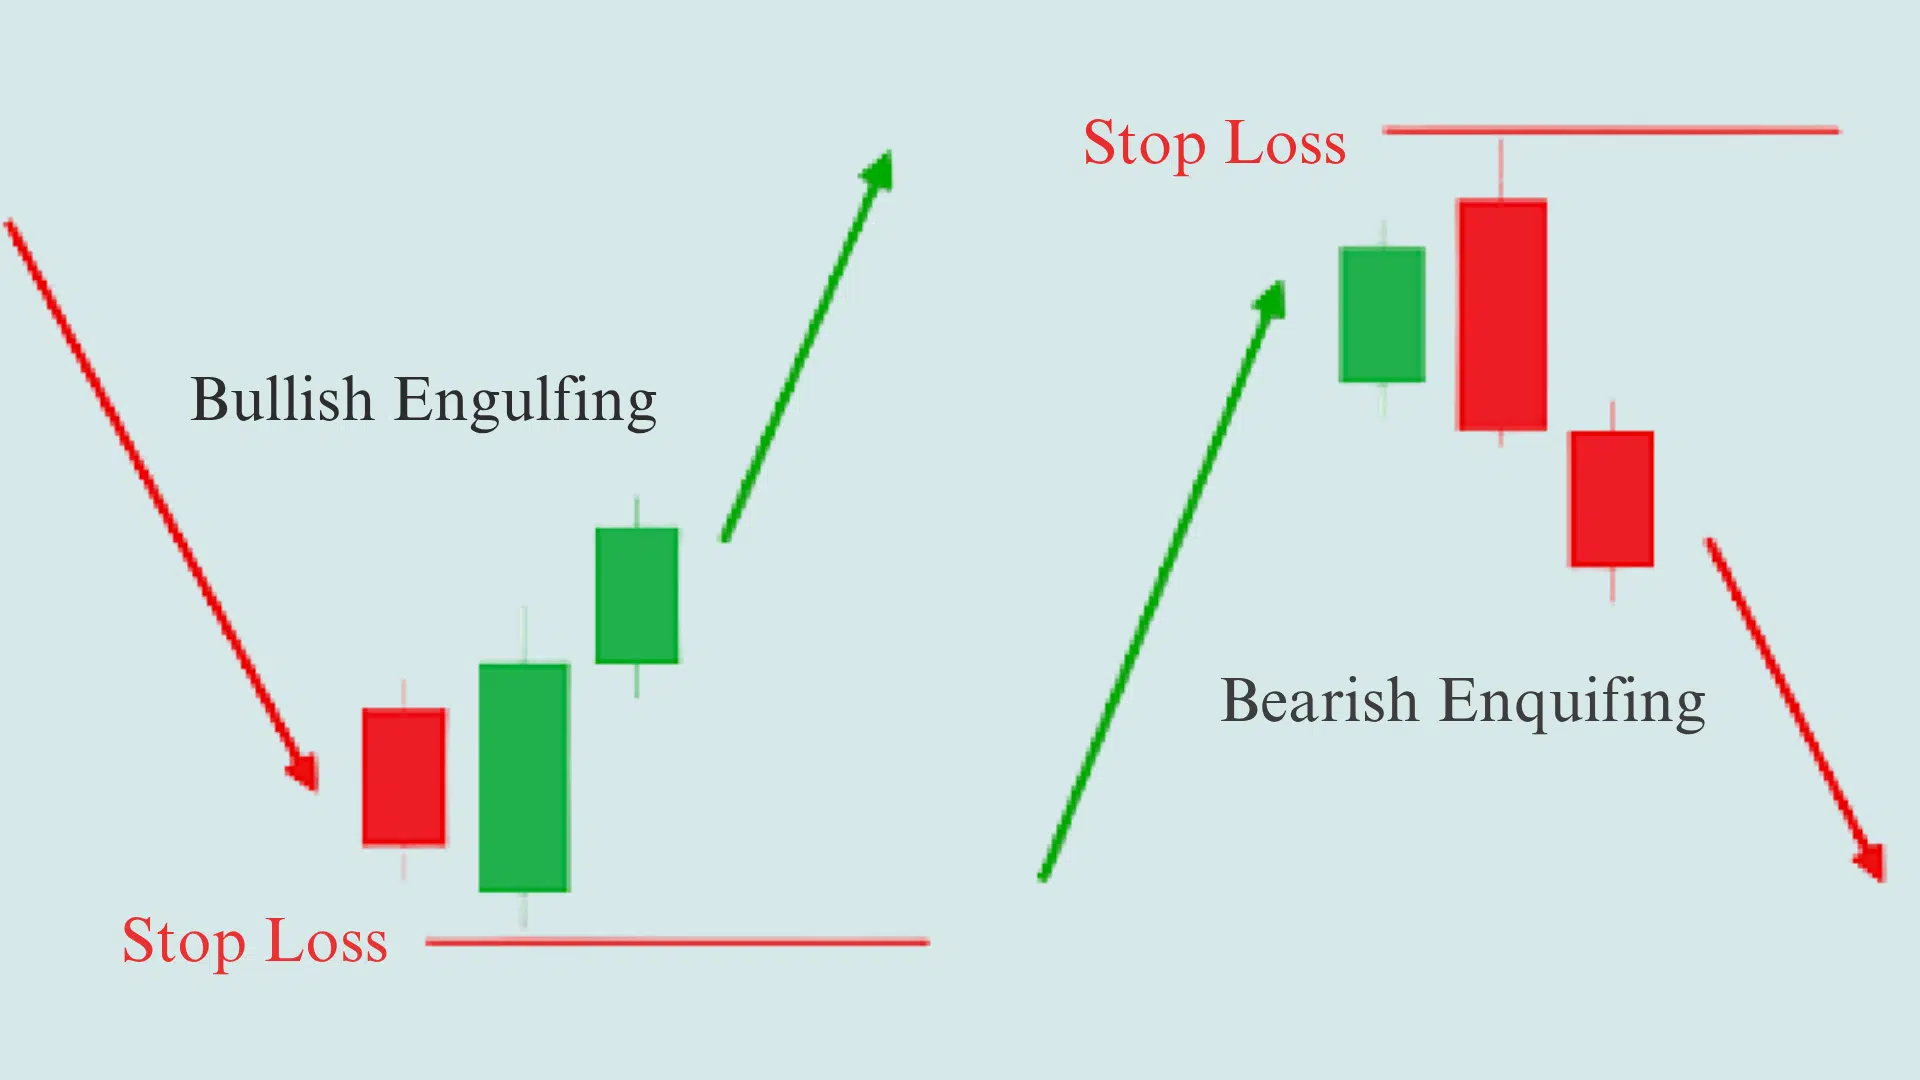
The large candle completely covers the previous candle’s entire body. Bullish engulfing shows a green candle swallowing a red one, while bearish engulfing is the opposite. The size difference between candles demonstrates a sudden shift in control between buyers and sellers.
- Signal: Shows power shift between buyers and sellers with momentum change.
- How to Trade: Bullish engulfing at support: buy with a stop below the pattern. Bearish engulfing at resistance: short with stop above. Volume should support the engulfing candle.
- Pro Tip: Pattern is stronger when it appears after extended trend or at key support/resistance levels.
How to Trade Day Trading Patterns Effectively
Trading patterns are successfully identified by more than just spotting shapes on a chart. First, always confirm the pattern structure with volume.
A breakout without strong volume is often fake and will reverse quickly. Use multiple timeframes to validate your setup.
Check both a 15-minute chart and a 1-hour chart to ensure the pattern aligns on both. Never enter a trade without a clear plan.
Decide your entry price, stop loss level, and profit target before you click buy or sell. Avoid stocks with low liquidity or thin volume.
These can trap you in positions with wide spreads and unpredictable moves. Finally, keep a pattern journal to track every trade.
Write down which pattern you traded, the result, and what you learned. This journal will show you which patterns work best for your style and help you improve your win rate over time.
Common Mistakes Traders Make with Patterns
You’ve learned the best day trading patterns, but knowing them isn’t enough. Many traders still lose money because they repeat the same pattern-trading mistakes. Here’s what to watch out for.
| Mistake | Why It Fails | Fix |
|---|---|---|
| Entering too early | Caught in false breakouts | Wait for volume-confirmed close beyond pattern |
| Ignoring volume or news | Patterns fail without context | Check volume and headlines first |
| Over-reliance on one pattern | Stops working when the market shifts | Learn multiple setups for flexibility |
| Trading all 17 patterns | Never master any single one | Focus on 3-5 patterns only |
| No journaling or backtesting | Repeat the same mistakes | Track trades and test on past charts |
Pro Tips to Master Day Trading Patterns
Let’s explore a few expert tips and strategies that can help you level up your skills and master day trading patterns like a pro.
- Focus on 3–5 patterns that fit your style. Master a few patterns deeply rather than trying to trade every setup you see, which builds confidence and consistency.
- Backtest before going live. Test your chosen patterns on historical charts for at least 50-100 trades to understand win rates and failure points before risking real money.
- Learn pattern failure signals, often the best reversal setups. Failed patterns often create the strongest trades in the opposite direction because they trap breakout traders who must exit quickly.
- Combine with trendlines, EMAs, and VWAP for better accuracy. Use additional indicators like the 9 EMA, 20 EMA, or VWAP alongside patterns to filter out weak setups and confirm stronger entries.
- Review daily: take screenshots of your pattern trades for learning. Take screenshots of every trade with entry, exit, and reasoning notes so you can review what worked and what didn’t at day’s end.
Conclusion
Mastering day trading patterns gives you structure in a chaotic market. These patterns provide a clear framework for spotting opportunities before the crowd reacts.
But knowing them isn’t enough. You need to practice daily, keep a journal, and focus on the 3 to 5 setups that match your personality. Start small.
Pick one or two patterns this week and trade them on a simulator first. Screenshot your trades and review them each evening. Learn from both wins and losses.
Remember, discipline beats knowledge every time. The patterns are just tools. Your execution and risk management determine success.
What pattern will you master first? Comment below which pattern you’re focusing on, or share your biggest trading challenge. Want more tips? Subscribe to get weekly trading strategies sent straight to your inbox.