

Traders miss profitable opportunities every day because they don’t recognize continuation signals. When a strong uptrend pauses, most people panic and exit their positions.
But experienced traders know these pauses often lead to even bigger moves. The bull pennant pattern helps you spot these moments before the next surge happens.
This pattern shows you exactly when buyers are taking a quick break and when they’re ready to push prices higher again.
In this guide, you’ll learn how to identify the bullish pennant flag, understand its structure, and trade it with confidence.
We’ll cover entry points, stop loss placement, profit targets, and real examples from actual charts. You’ll also learn how to avoid false breakouts and combine this pattern with other tools for better results.
What is a Bull Pennant Pattern?
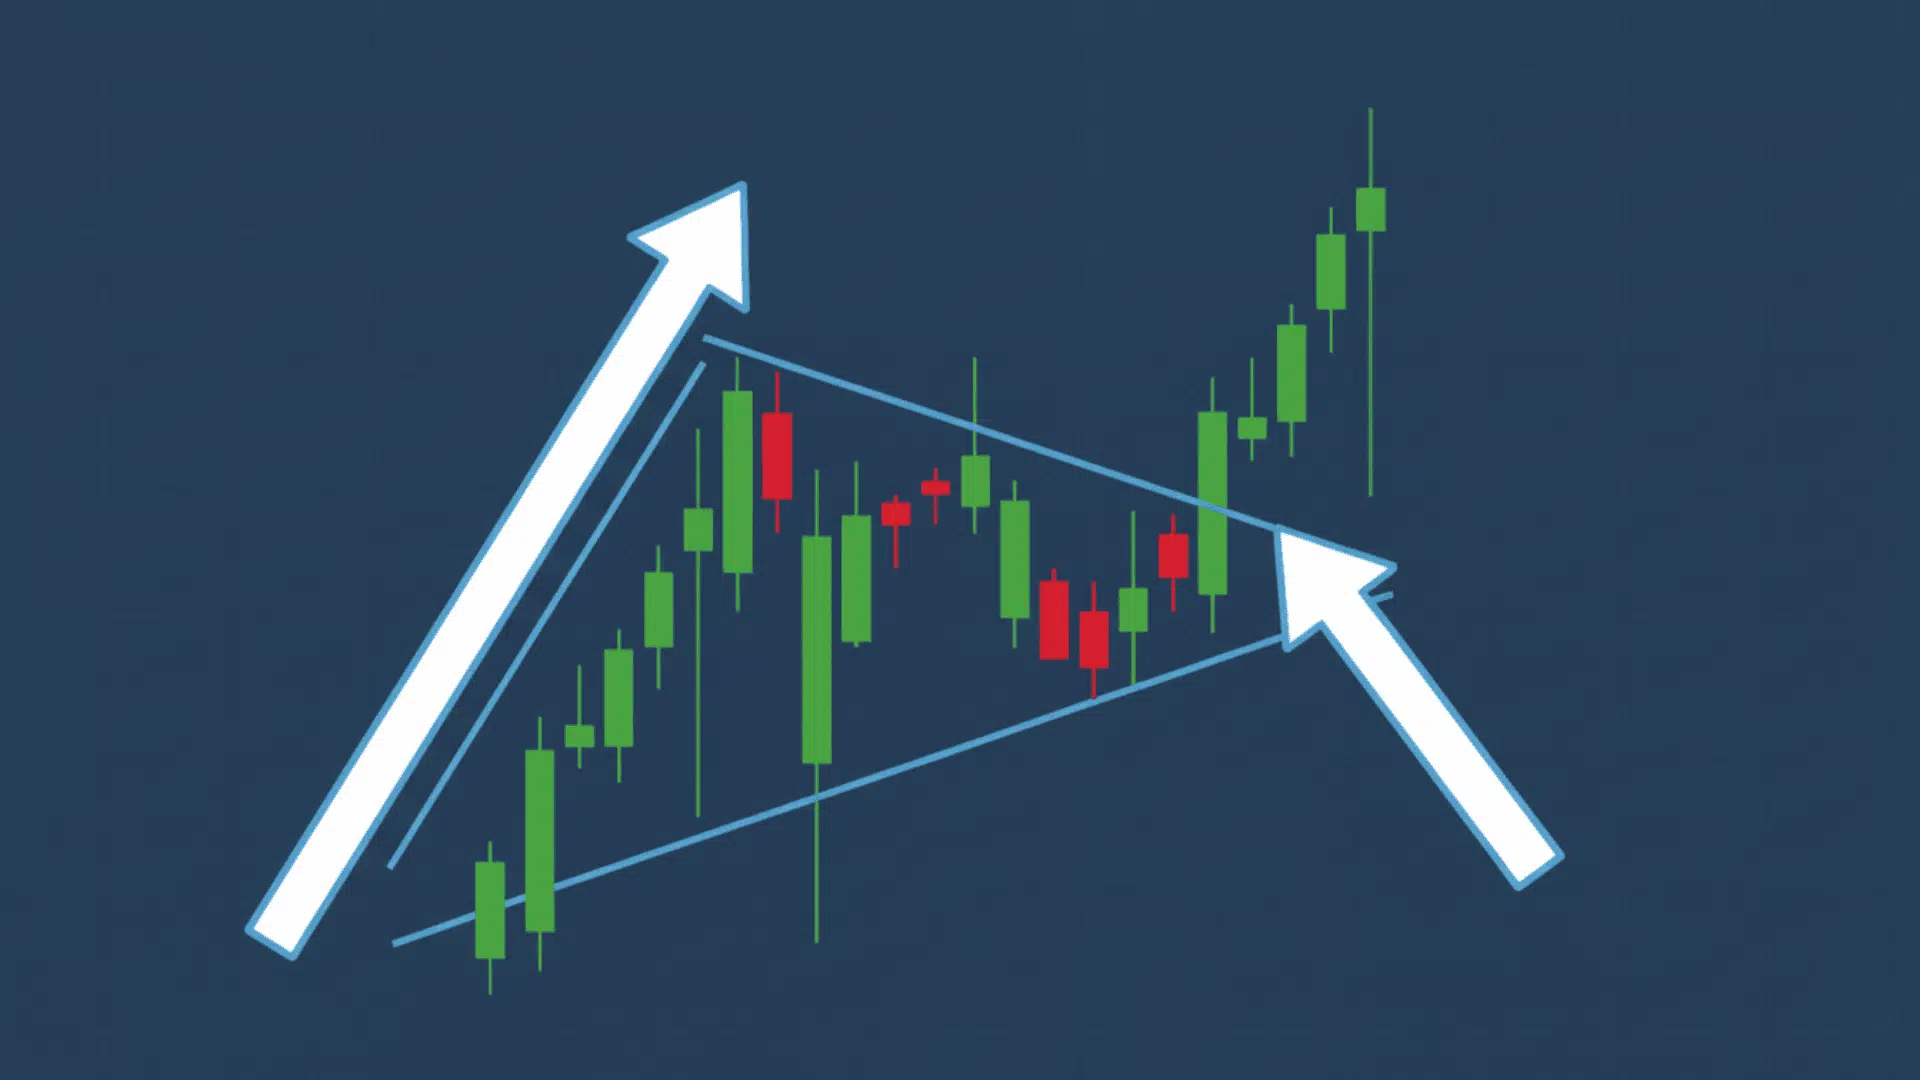
A bull pennant pattern is a short pause in an uptrend that signals the price will likely keep rising. Think of it like a flagpole with a small pennant attached.
The flagpole is the sharp price jump that happens first. The pennant is the tight, sideways movement that follows. This consolidation usually lasts a few days to a few weeks.
You’ll see this pattern form in stocks, forex, crypto, and commodities. Traders watch for it because it often means buyers are taking a quick break before pushing prices higher again.
The pattern works best when it shows up after a strong move upward. Volume typically drops during the pennant phase, then spikes when the breakout happens.
Key Elements of a Bull Pennant Pattern
Understanding each part of the bull pennant helps you spot it faster on charts. The pattern has four main elements that work together. Each one tells you something about what buyers and sellers are doing. Let’s break down the structure.
| Component | Description | What It Means |
|---|---|---|
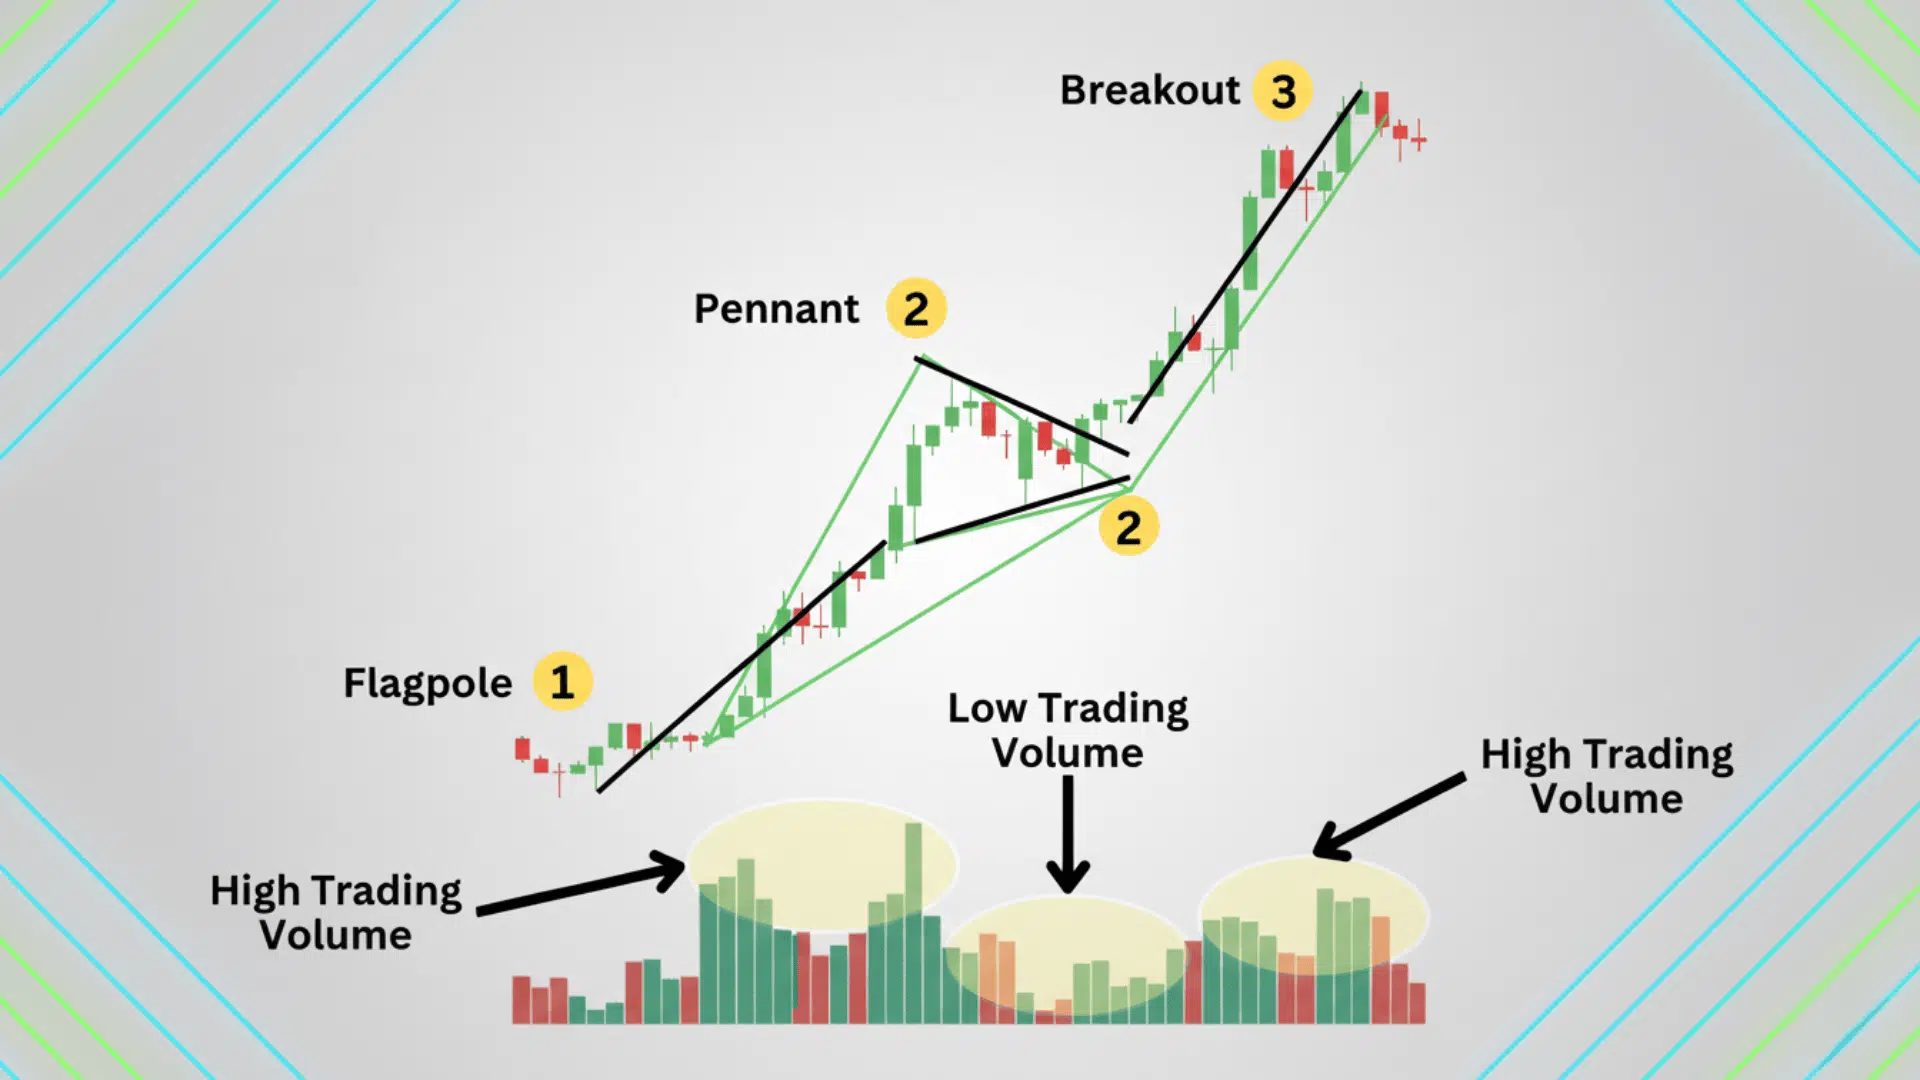
| Flagpole | A strong, nearly vertical price surge | Establishes bullish momentum |
| Pennant | A brief, converging consolidation | Reflects temporary profit-taking or indecision |
| Breakout | Price closing above the upper trendline | Signals continuation of the uptrend |
| Volume Pattern | High → Low → Spike | Confirms accumulation and renewed buying pressure |
Key insight: The pennant phase represents “compression.” Energy builds during this time before another upward expansion occurs.
The flagpole shows strong buying interest right from the start. Then the pennant forms as early buyers take profits. Trendlines converge as the price range gets tighter.
This creates pressure that eventually leads to the breakout. Volume behavior confirms whether the pattern is real or false.
Why the Bull Pennant Pattern Works?
The bull pennant works because it reflects real trader behavior. The flagpole shows dominant buyers driving momentum upward with force.
Then the pennant forms as a brief balance occurs while traders take profits. Some sellers enter, but not enough to reverse the trend.
The breakout confirms that demand overwhelms supply again. Buyers who missed the first move get a second chance to enter. This psychology repeats across all markets, making the pattern reliable.
Why It’s Powerful:
- This strategy captures re-entry zones within existing uptrends for traders who missed the initial move.
- This strategy offers measurable risk-reward setups with clear entry points, stop losses, and profit targets.
- Works consistently across timeframes and markets, from 15-minute charts to daily charts.
The pattern gives you a structured way to trade continuation moves. You know where to enter, where to exit, and where to place your stop. This clarity makes it easier to manage risk and stay disciplined.
How to Identify the Bull Pennant Pattern
Now that you understand the structure of the bull pennant pattern, let’s look at how to identify it accurately on a price chart.
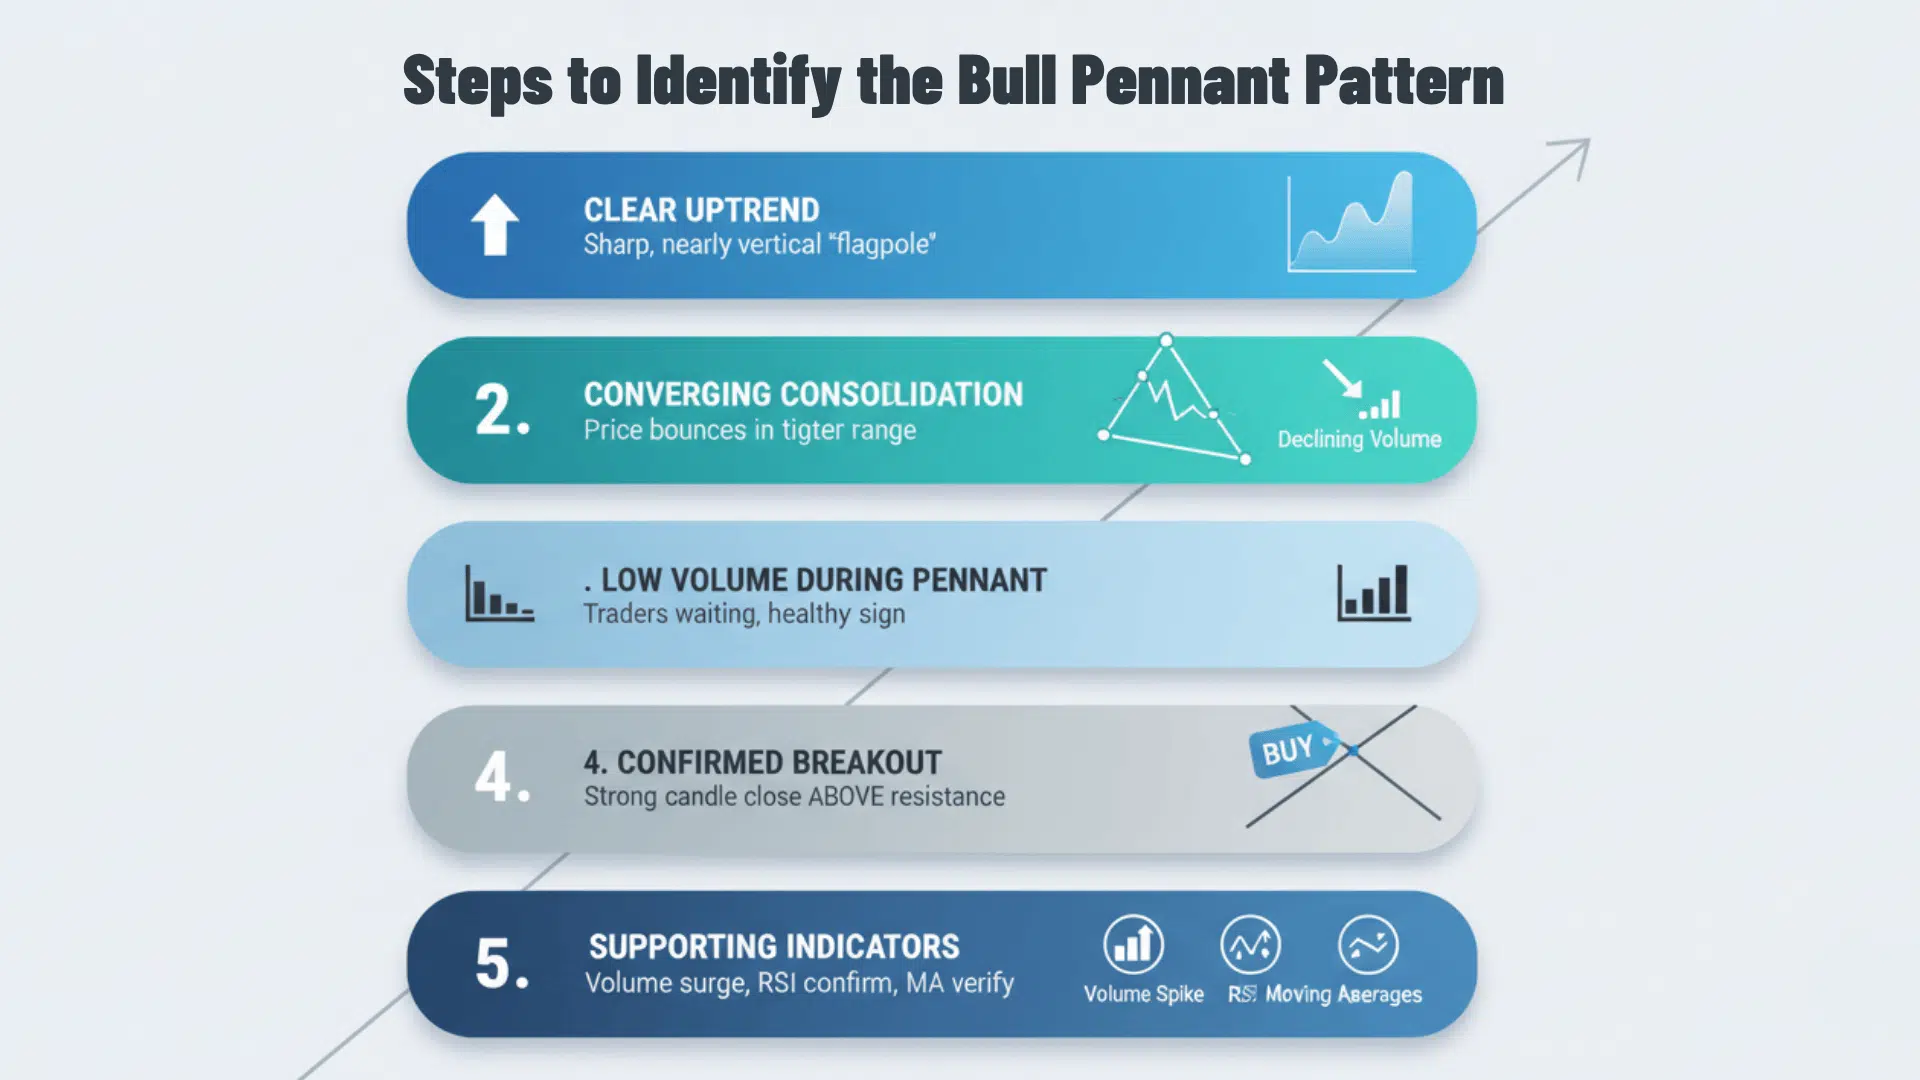
1. Confirm a clear preceding uptrend
Look for a strong upward price move before the pattern forms. This should be sharp and nearly vertical, like a flagpole standing tall.
2. Identify tight, converging consolidation
Watch for two trendlines that slope inward and meet at a point. The price should bounce between these lines in a smaller and smaller range.
3. Observe declining volume during this phase
Volume should drop as the pennant forms, showing traders are waiting. Low activity during consolidation is a healthy sign that the pattern is valid.
4. Wait for a confirmed breakout above resistance
Don’t jump in early. Wait for the price to close above the upper trendline with a strong candle.
5. Use supporting indicators to confirm strength
Check if volume spikes on the breakout to confirm real buying pressure. Use RSI to ensure momentum supports the move, or add moving averages to verify the trend remains intact.
Trading Strategy: How to Trade the Bull Pennant Pattern
After identifying the bull pennant pattern on a chart, the next step is knowing how to trade it effectively for maximum accuracy and profitability.
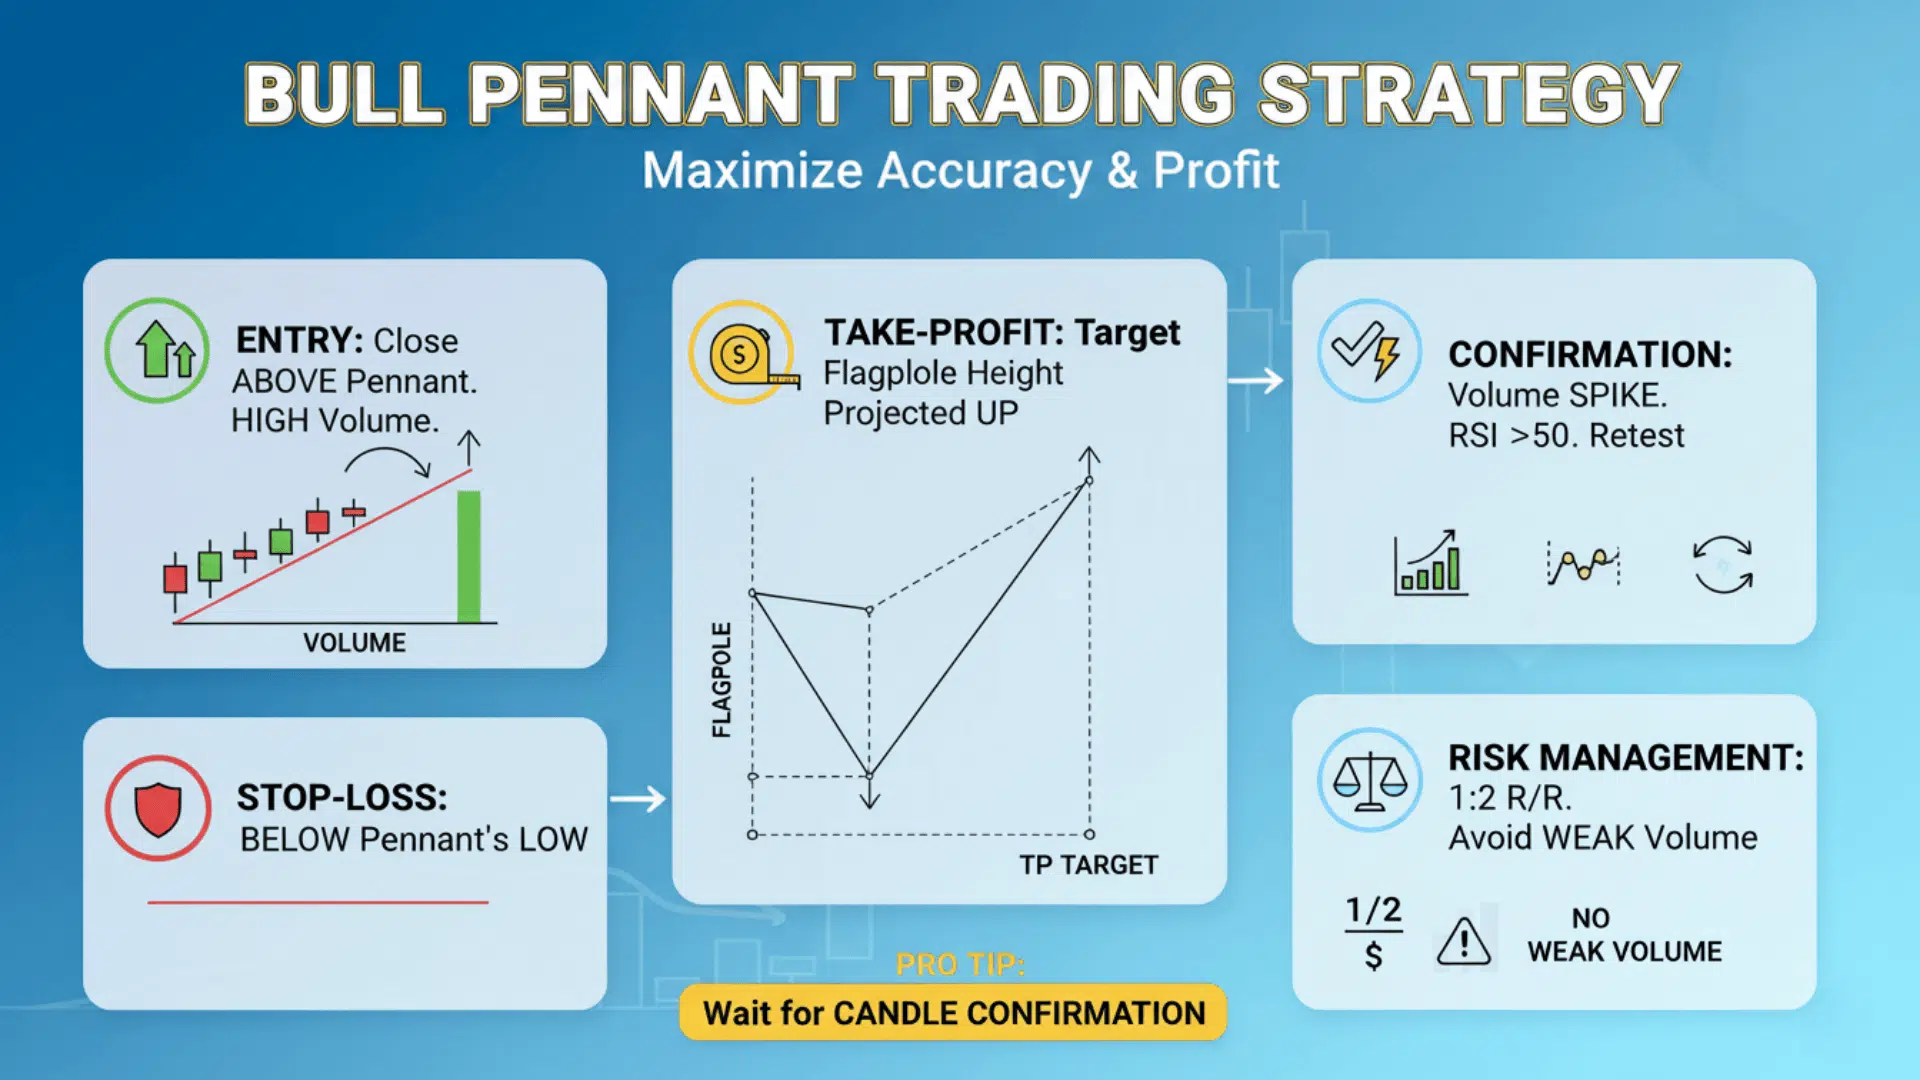
1. Entry
Enter after the breakout closes above the pennant with higher-than-average volume. Wait for a candle to close completely above the upper trendline. The breakout needs strong volume to confirm real buying interest. If volume is weak, the breakout might fail and trap you in a false move.
2. Stop-Loss
Place just below the pennant’s lower boundary or consolidation base. Set your stop loss below the pennant’s lowest point to protect your capital. This level acts as your safety net if the pattern fails. Keep the distance tight enough to maintain a good risk-reward ratio.
3. Take-Profit Target
Measure the flagpole’s height and project it upward from the breakout point. Measure from the flagpole’s base to its peak in price points. Add that same distance to your breakout entry point. This gives you a realistic target based on the pattern’s momentum.
4. Confirmation Tools
Volume spike, momentum indicators, or successful retest. Look for volume to jump at least 50% above average during the breakout. Use RSI above 50 or moving average support as extra confirmation. Some traders wait for the price to retest the breakout level and bounce before entering.
5. Risk Management
Use favorable risk/reward (e.g., 1:2) and avoid entering during weak volume. Your potential profit should be at least twice your potential loss. Never enter if volume looks weak or the market is choppy. Position sizing matters too, so risk only 1-2% of your account per trade.
Pro tip: Avoid anticipating breakouts; wait for candle confirmation to reduce false signals. Patience saves you from getting caught in fake moves that reverse quickly.
Real-Life Example: Bull Pennant in Action
Example: Bitcoin (BTC/USD) Daily Chart Showing Classic Pennant Setup
Let’s look at how a bull pennant formed on Bitcoin’s daily chart. This example shows why traders trust this pattern when conditions align properly.
Walkthrough:
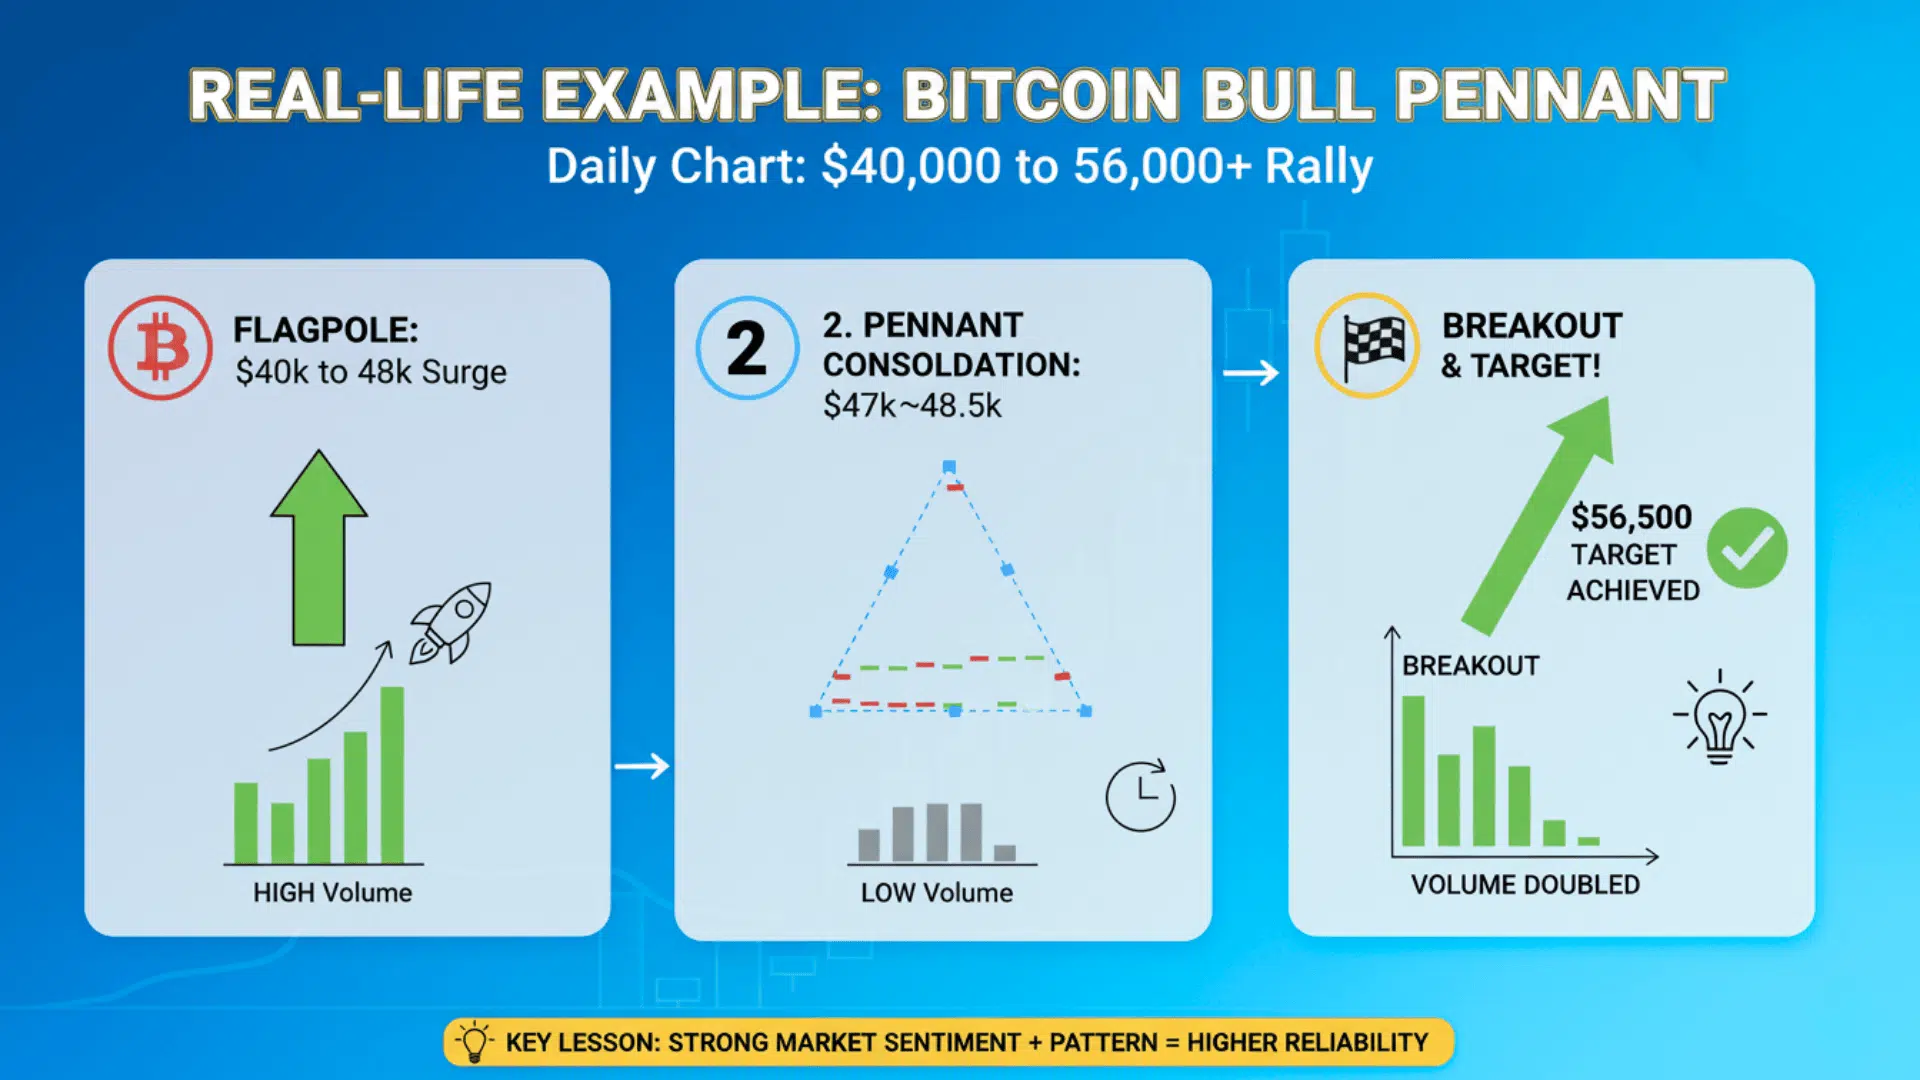
1. Initial surge (flagpole)
Bitcoin jumped from $40,000 to $48,000 in just five days. The move was sharp and nearly vertical on the chart. Volume was extremely high as buyers pushed aggressively. This created the flagpole, which established the pattern.
2. Pennant consolidation with volume drop
Price then moved sideways between $47,000 and $48,500 for the next two weeks. The range got tighter each day as trendlines converged. Volume dropped to less than half the average during this phase. Traders were clearly waiting for the next big move.
3. Breakout candle and target projection achieved
Bitcoin closed above $48,500 with a strong green candle and doubled the volume. The flagpole measured $8,000 in height from base to peak. Adding that to the breakout point gave a target of $56,500. Price reached that target within eight trading days after the breakout.
Lesson: Pattern reliability improves when paired with strong market sentiment
This setup worked because broader market conditions supported Bitcoin at the time. The news flow was positive, and investors showed clear interest. The pattern alone isn’t enough; you need the right environment for it to play out fully.
Bull Pennant vs. Bull Flag: Spot the Difference
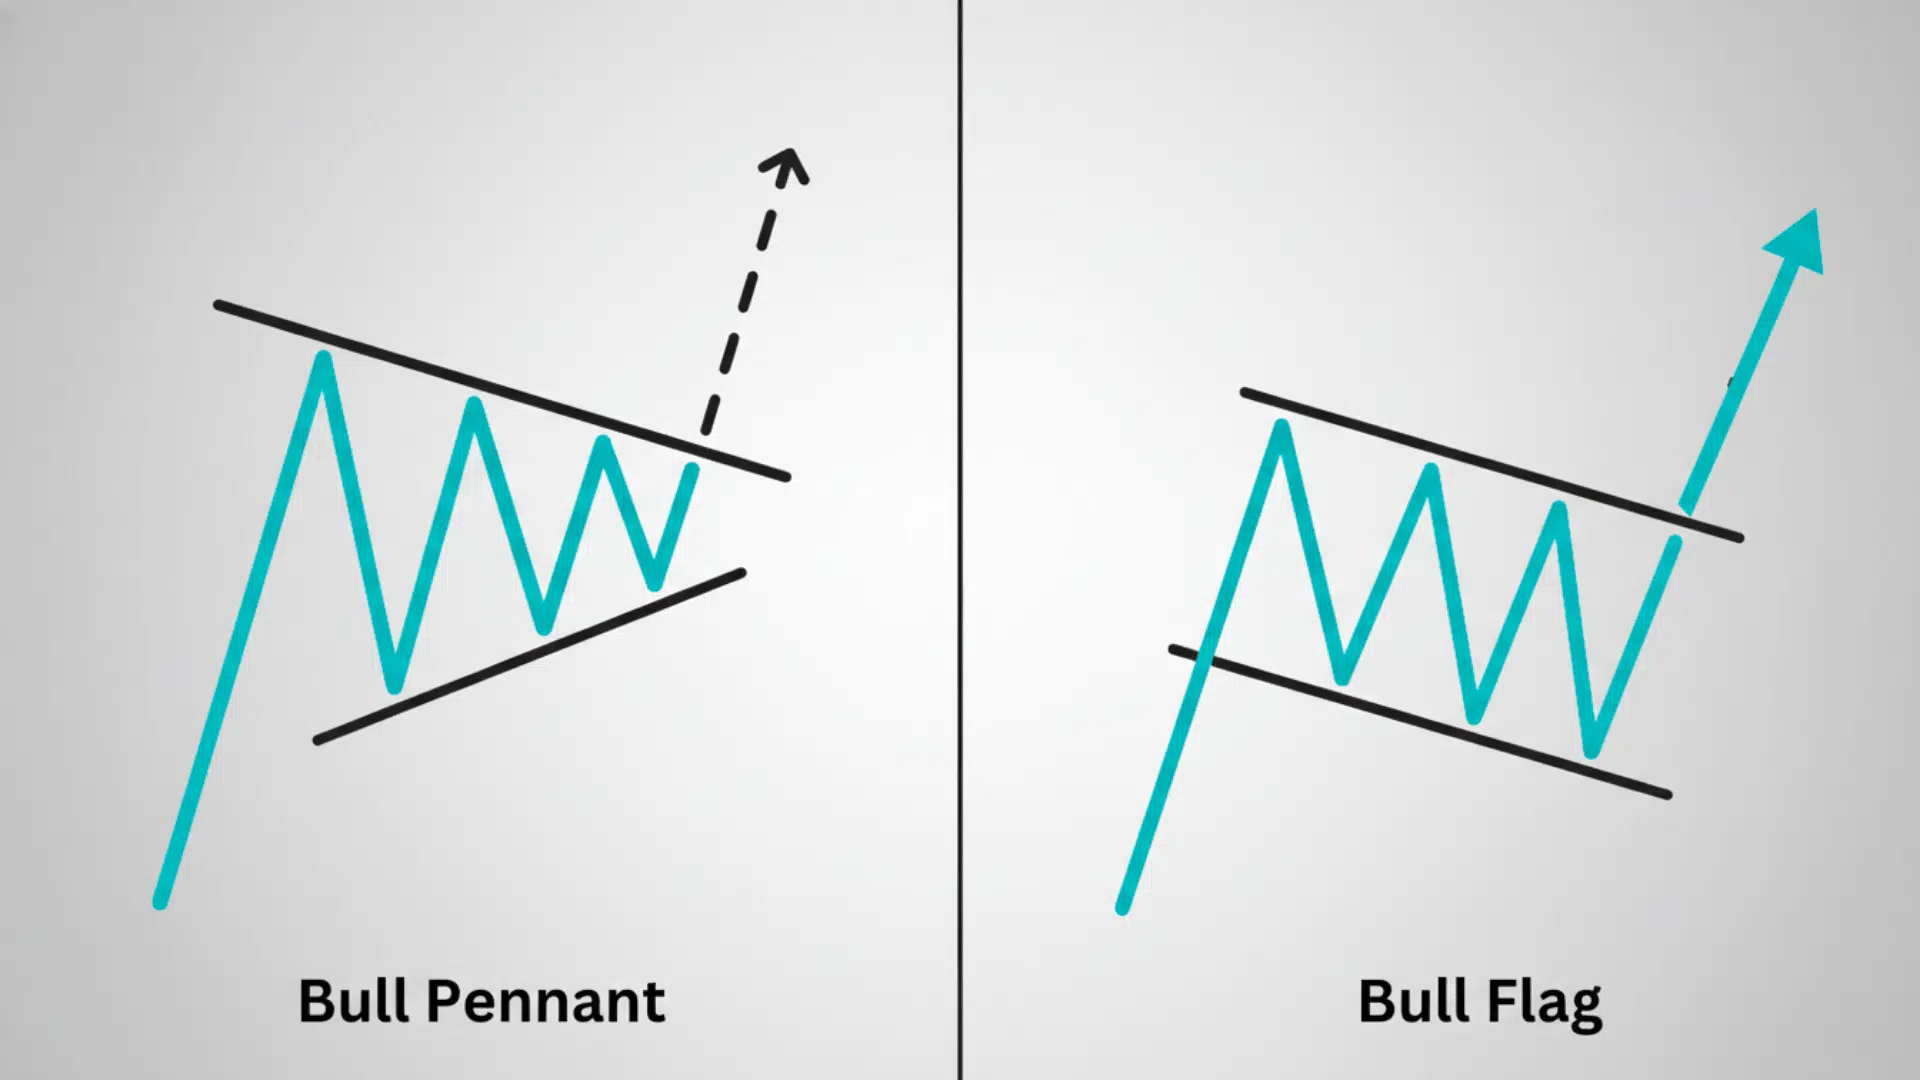
Both patterns signal continuation, but they look and behave differently. Knowing the difference helps you trade each one correctly. Here’s how to tell them apart.
| Feature | Bull Pennant | Bull Flag |
|---|---|---|
| Shape | Converging triangle | Parallel channel |
| Duration | Short consolidation | Slightly longer rest |
| Trendlines | Inward-sloping | Parallel |
| Energy Release | Sudden and sharp | Gradual and steady |
The bull pennant tightens like a coiled spring before snapping upward. The bull flag moves in a more controlled, rectangular drift downward or sideways.
Both work well, but pennants tend to produce faster breakouts. Flags give you more time to prepare your entry. Choose your strategy based on which pattern you spot on the chart.
Strengths and Weaknesses of the Bull Pennant Pattern
Every pattern has strengths and weaknesses. Understanding both sides helps you trade smarter and avoid common mistakes.
| Advantages | Limitations |
|---|---|
| Clear structure for entry and target – You know exactly where to enter and where to take profit based on the flagpole measurement. | False breakouts in low-volume markets – Weak volume can trigger fake moves that quickly reverse and stop you out. |
| Works on multiple timeframes – The pattern appears on 15-minute, hourly, daily, and weekly charts with similar reliability. | Easy to confuse with small symmetrical triangles – Both look similar during formation, but triangles don’t require a preceding uptrend. |
| Provides defined risk control – Stop loss placement is clear at the pennant’s lower boundary, giving you measurable risk. | Must occur after a clear upward move to be valid – Without a strong flagpole first, the pattern loses its predictive power and becomes unreliable. |
The key is knowing when conditions favor the pattern. High volume, strong trends, and clear structure increase your success rate. Avoid trading pennants in choppy or sideways markets where false signals are common.
Bull Pennant Trading Tips for Consistent Results
Before we wrap up, let’s look at some practical bull pennant trading tips that can help you achieve consistent results and avoid common mistakes.
- Confirm volume and momentum before entering: Always check that volume spikes above average on the breakout and momentum indicators like RSI support the move.
- Back-test the setup across assets: Test the pattern on at least 50 historical examples across stocks, forex, and crypto to understand its success rate in different conditions.
- Combine with trend indicators for better reliability: Use moving averages or trendlines to confirm the broader trend supports your trade direction before entering.
- Avoid trading during sideways or news-driven volatility: Stay away from pennants that form during consolidation phases or right before major news events that can cause unpredictable price swings.
Wrapping the Story
The bull pennant pattern gives you a clear roadmap for trading continuation moves in uptrends.
You now know how to spot the flagpole, wait through the consolidation, and enter on confirmed breakouts. Remember that patience beats guessing every time.
Wait for volume confirmation and never jump in before the breakout closes above resistance. This pattern works across all markets and timeframes when you follow the rules.
The key is combining it with proper risk management and supporting indicators. Practice identifying pennants on historical charts before risking real money. Back-test your strategy and track your results to improve over time.
Ready to spot your next bull pennant? Start scanning your charts today and look for those sharp flagpoles followed by tight consolidations.
Drop a comment below sharing which market you trade most in and whether you’ve spotted this pattern before.