

When I first started trading crypto, the charts looked like chaos, with lines, candles, and shapes everywhere. However, once I learned about crypto chart patterns, everything began to fall into place.
These patterns illustrate how prices evolve over time, helping traders predict future movements. Why do they work? Because trader emotions, such as fear, greed, and excitement, tend to repeat.
That’s why you’ll see the same patterns again and again in Bitcoin, Ethereum, and other coins.
In this guide, I’ll walk you through some of the most common crypto patterns, how to spot them, and how to use them to make smarter trading decisions, with visuals, examples, and simple strategies you can actually use.
Why Chart Patterns Matter in Crypto Trading
If you’ve ever watched Bitcoin’s price jump or crash within minutes, you know how unpredictable the crypto market can be. That’s exactly why crypto patterns matter; they help bring structure to all that chaos.
These patterns show how traders behave under pressure and can give clues about what’s likely to happen next.
Here’s why they’re so useful:
- They Guide Your Timing: Patterns help spot the best entry and exit points during fast market swings.
- They Reveal Market Mood: Each formation reflects trader psychology: fear, greed, or uncertainty.
- They Improve Decision-Making: Used with tools like RSI or MACD, patterns make your trades more confident and less emotional.
In short, learning crypto chart patterns helps you trade smarter, not harder, by turning random price movements into readable market stories.
How to Read Crypto Chart Patterns Like a Pro?
Reading crypto chart patterns might seem tricky at first, but once you get the basics, it becomes second nature. Every pattern tells a story about buyers and sellers, who’s in control, and what could happen next.
Here are the core things to understand:
| Concept | Explanation |
|---|---|
| Trendlines | Connect highs or lows to show whether the market is moving up, down, or sideways. |
| Volume | Increasing trading volume often confirms a breakout or signals trend continuation. |
| Time Frames | Patterns on higher time frames (like daily or weekly charts) are usually more reliable. |
| Breakouts | When the price moves beyond a pattern, it signals a potential trend change. |
Always wait for confirmation, like a strong candle close or volume spike; before entering a trade. Imagine it as waiting for the green light before crossing the street.
Mostly Used Crypto Chart Patterns
Here are some of the most used crypto patterns that will help you understand the trend.
Continuation Patterns
Continuation patterns show when a crypto asset is just “taking a break” before continuing its main trend, whether that’s up or down.
1. Ascending Triangle
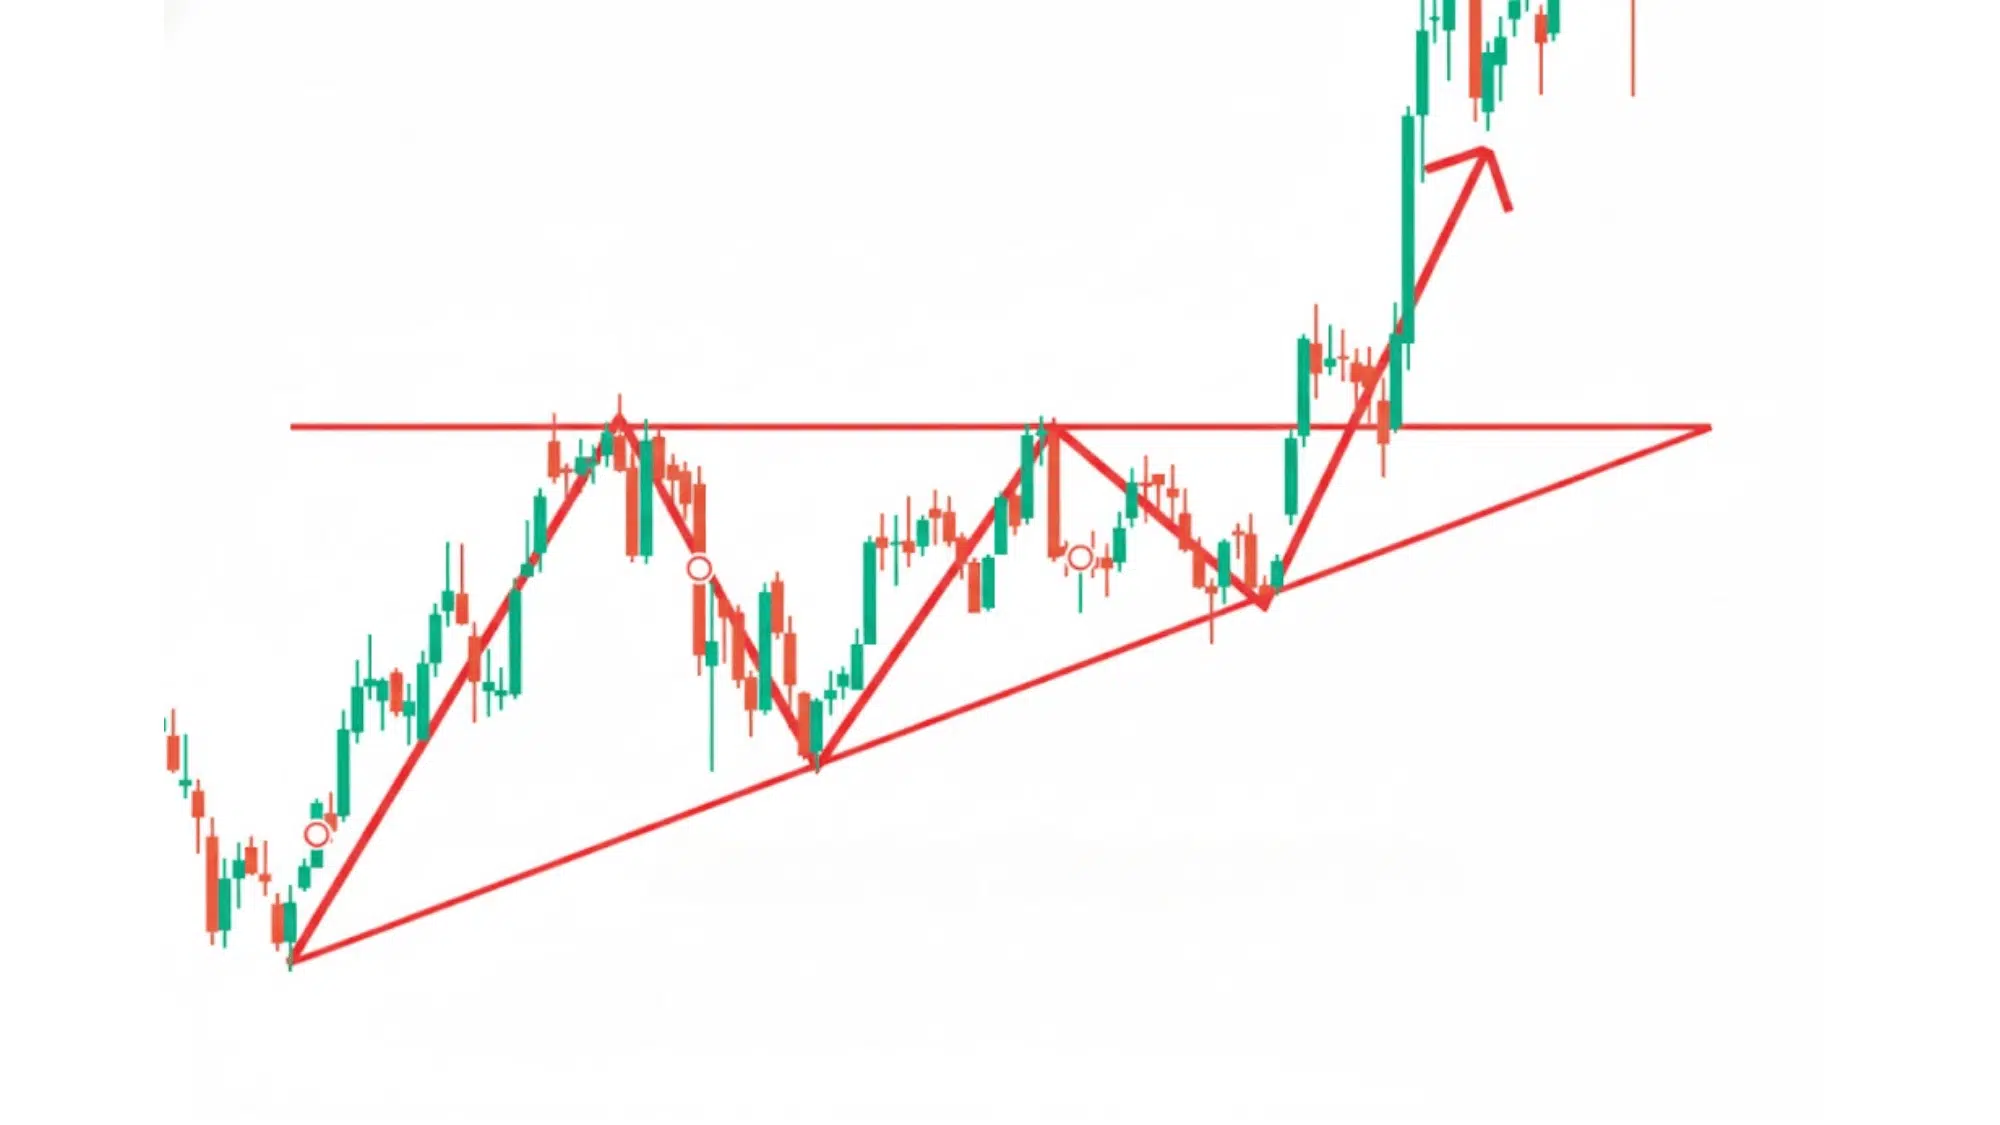
An ascending triangle forms when buyers consistently push prices higher, but sellers hold firm at a resistance level. Over time, the lows keep rising, tightening the pattern until a breakout occurs.
This pattern usually signals a strong bullish move once resistance breaks, supported by growing volume and positive market sentiment.
Key Points:
- Indicates strong buying pressure.
- Often forms after a steady uptrend.
How to Identify: Look for a flat upper resistance and a rising lower trendline that gradually tightens toward the breakout point.
Application: Traders usually buy when the price breaks above resistance with increased volume, setting a stop-loss just below the rising trendline.
2. Descending Triangle
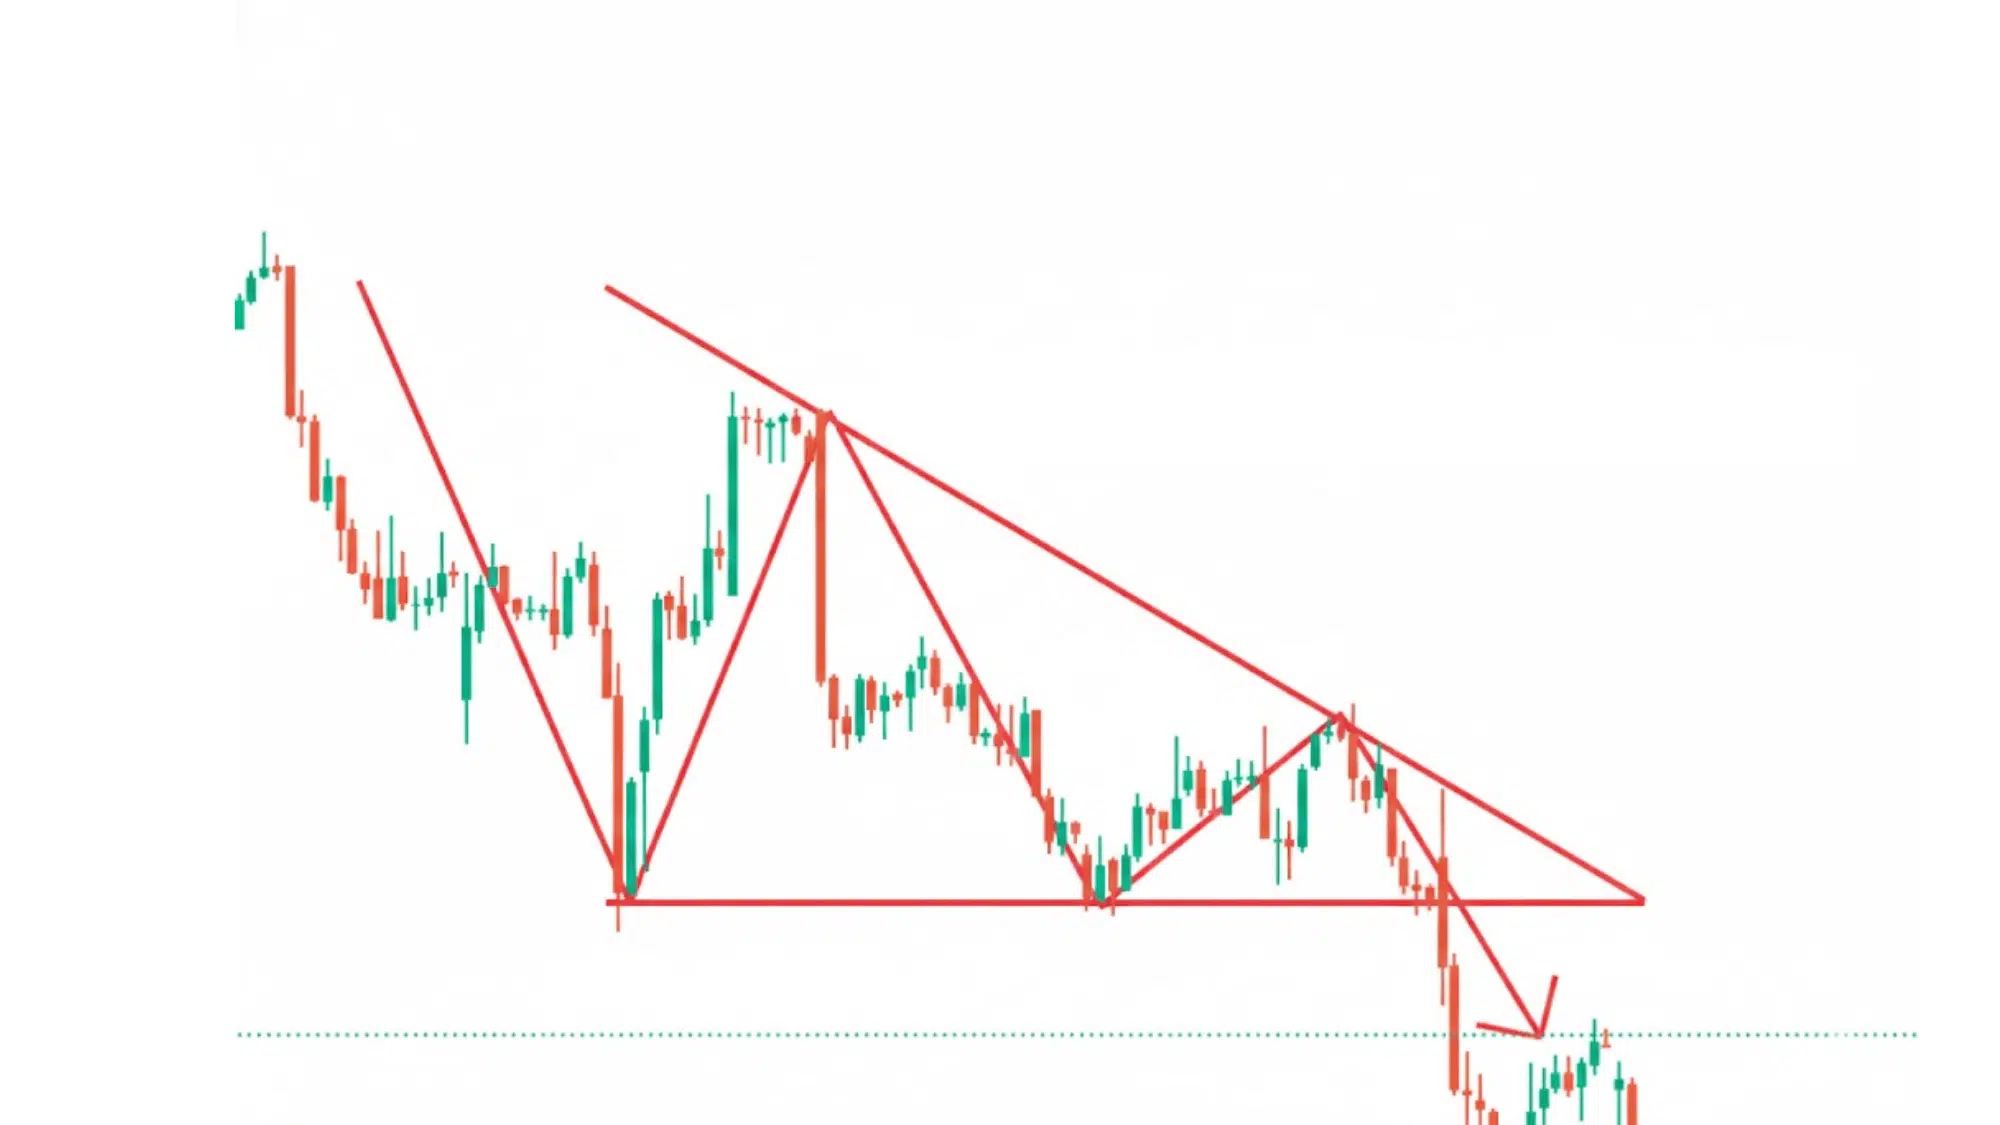
A descending triangle is the bearish counterpart of the ascending triangle. It forms when sellers keep pushing prices lower, while buyers defend a flat support level.
Each bounce grows weaker, showing fading demand. Once support breaks, it often leads to a sharp continuation of the downtrend.
Key Points:
- Suggests growing selling pressure.
- Common in downtrends.
How to Identify: Spot a flat lower support level with descending highs forming a triangle that narrows toward a likely downward breakout.
Application: Traders often enter short positions after a confirmed break below support, using the previous swing high as a stop-loss.
3. Symmetrical Triangle
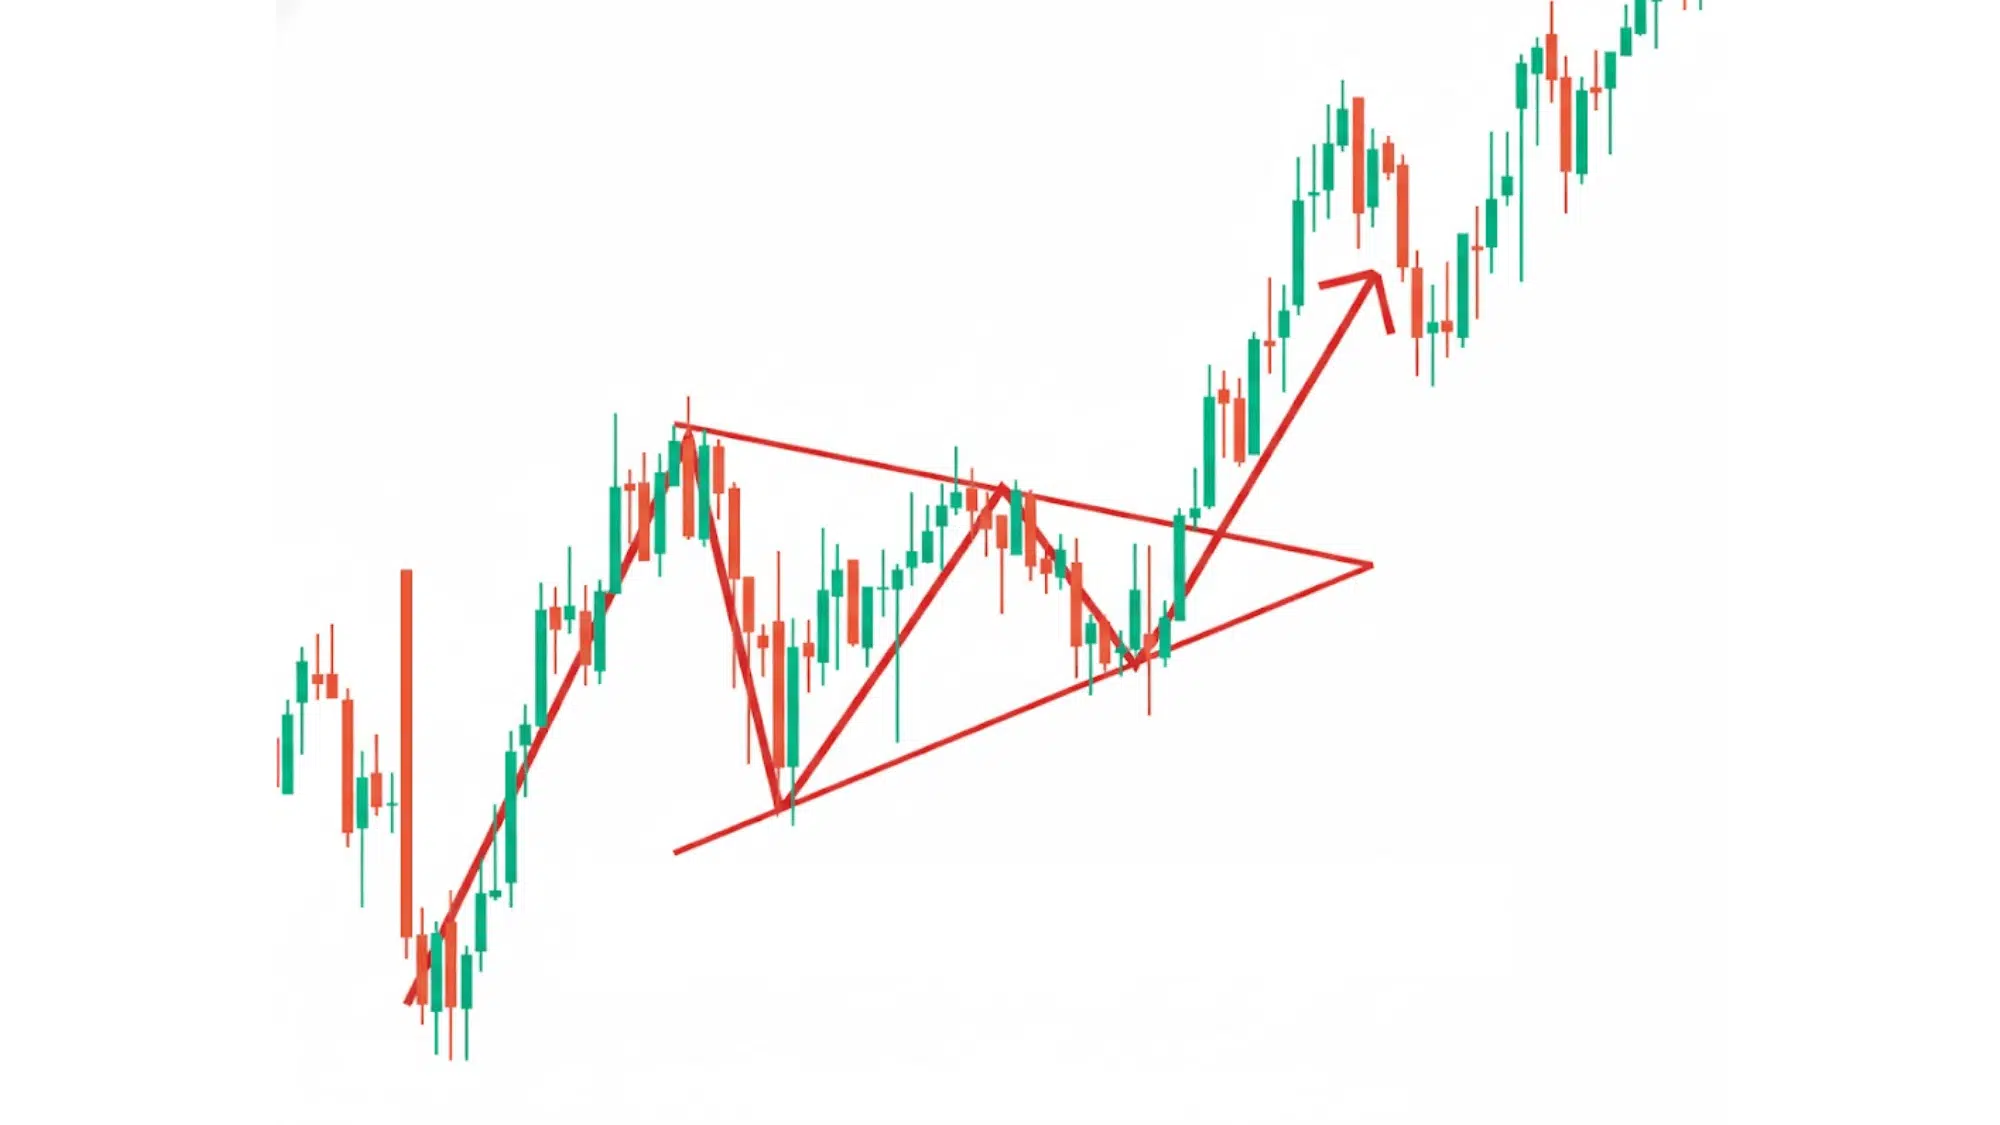
A symmetrical triangle looks like a narrowing cone where both buyers and sellers are losing momentum. Neither side dominates until a breakout confirms the winner.
It’s considered a continuation pattern since the breakout often follows the direction of the existing trend, making it a favorite among technical traders.
Key Points:
- Represents market indecision.
- Breakouts align with the prior trend.
How to Identify: Draw two converging trendlines, one descending from highs and one ascending from lows, forming a tightening triangle shape.
Application: Wait for a breakout in either direction with strong volume, and trade along the direction of the breakout for trend continuation.
4. Bullish Flag
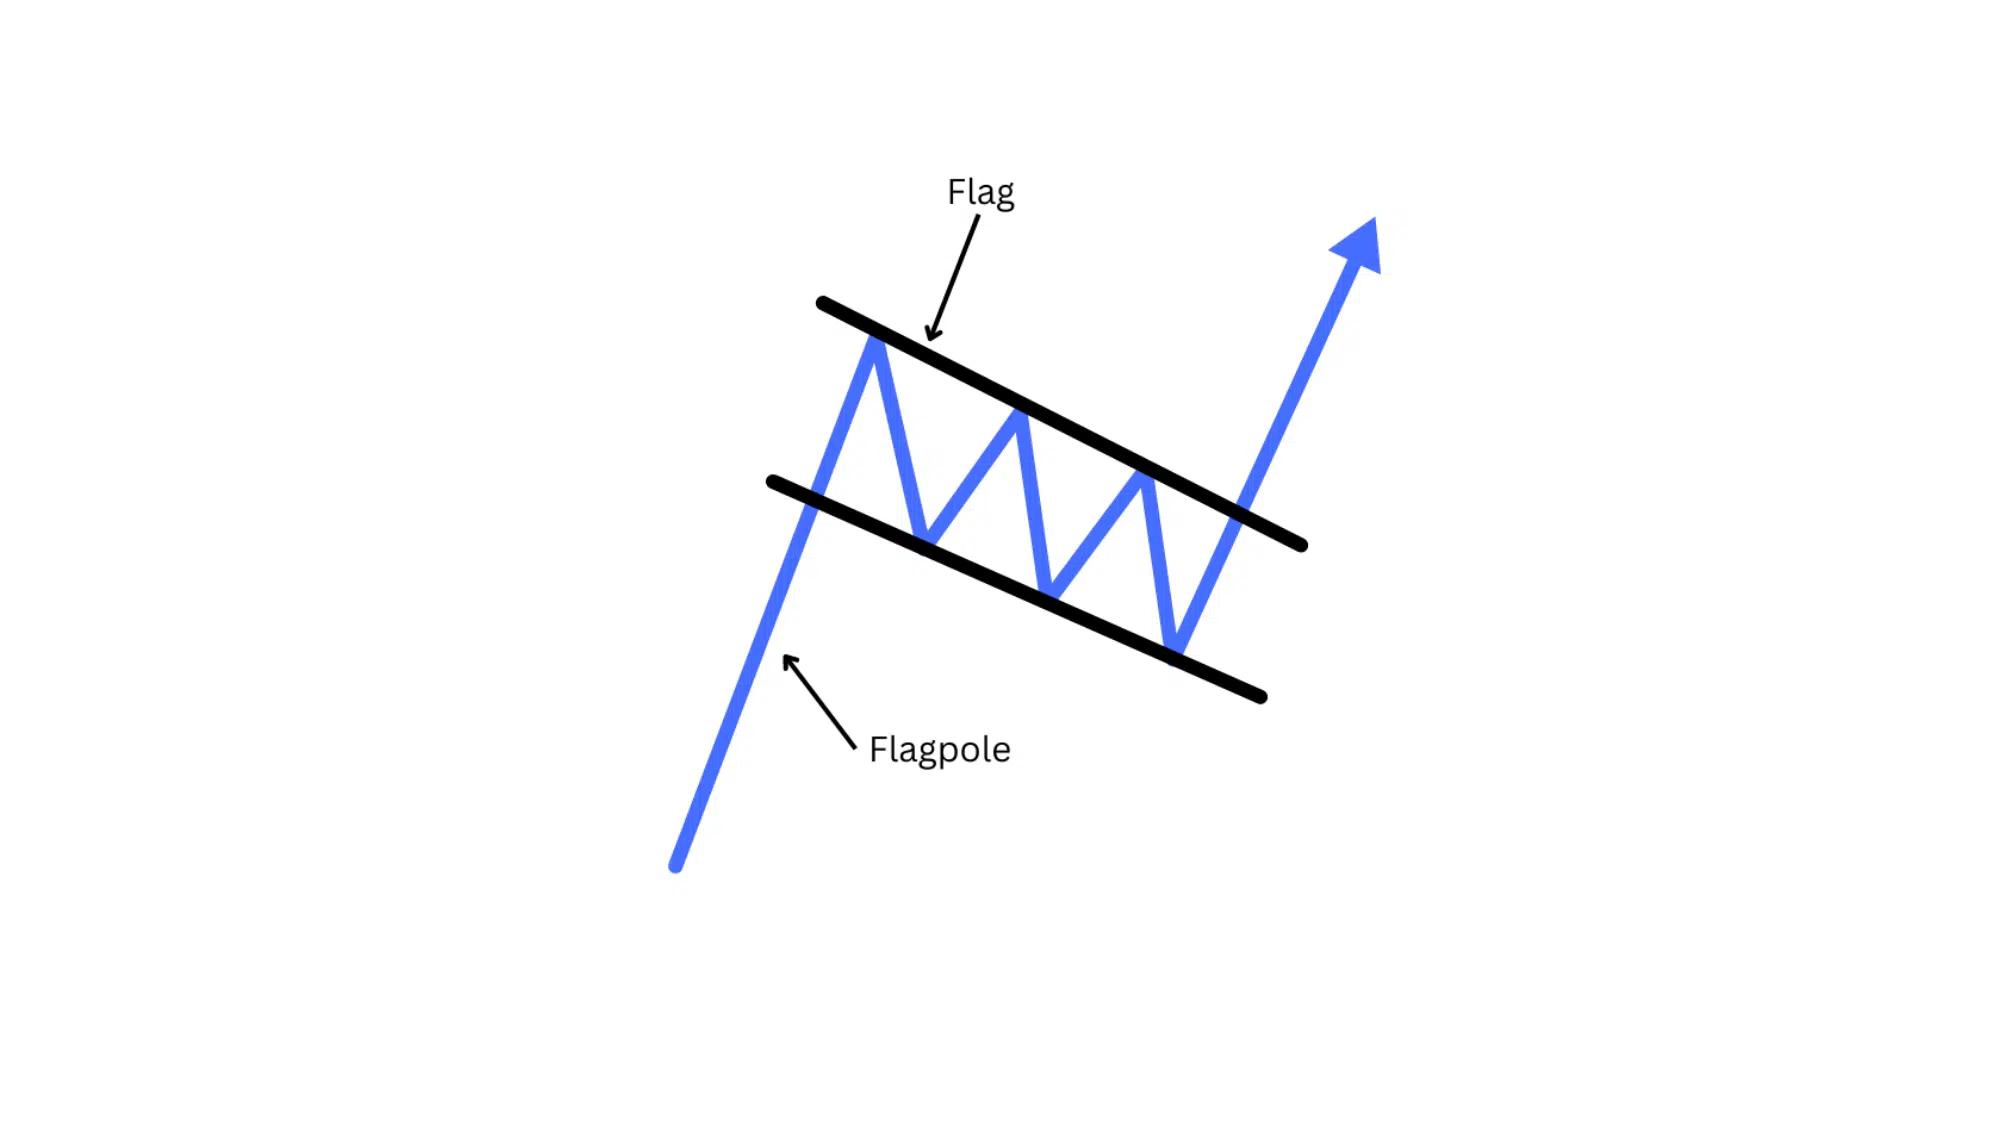
The bullish flag pattern appears after a sharp rally, forming a small downward-sloping channel. It signals that traders are taking profits before the next wave of buying begins.
Once prices break above the flag’s upper boundary, the uptrend typically resumes with renewed strength.
Key Points:
- Appears after a sharp upward rally.
- Short-term correction within a larger uptrend.
How to Identify: Spot a small downward-sloping rectangular channel following a steep upward “flagpole” move.
Application: Enter long trades once price breaks above the flag’s upper boundary with rising volume, targeting a move equal to the flagpole’s height.
5. Bearish Flag
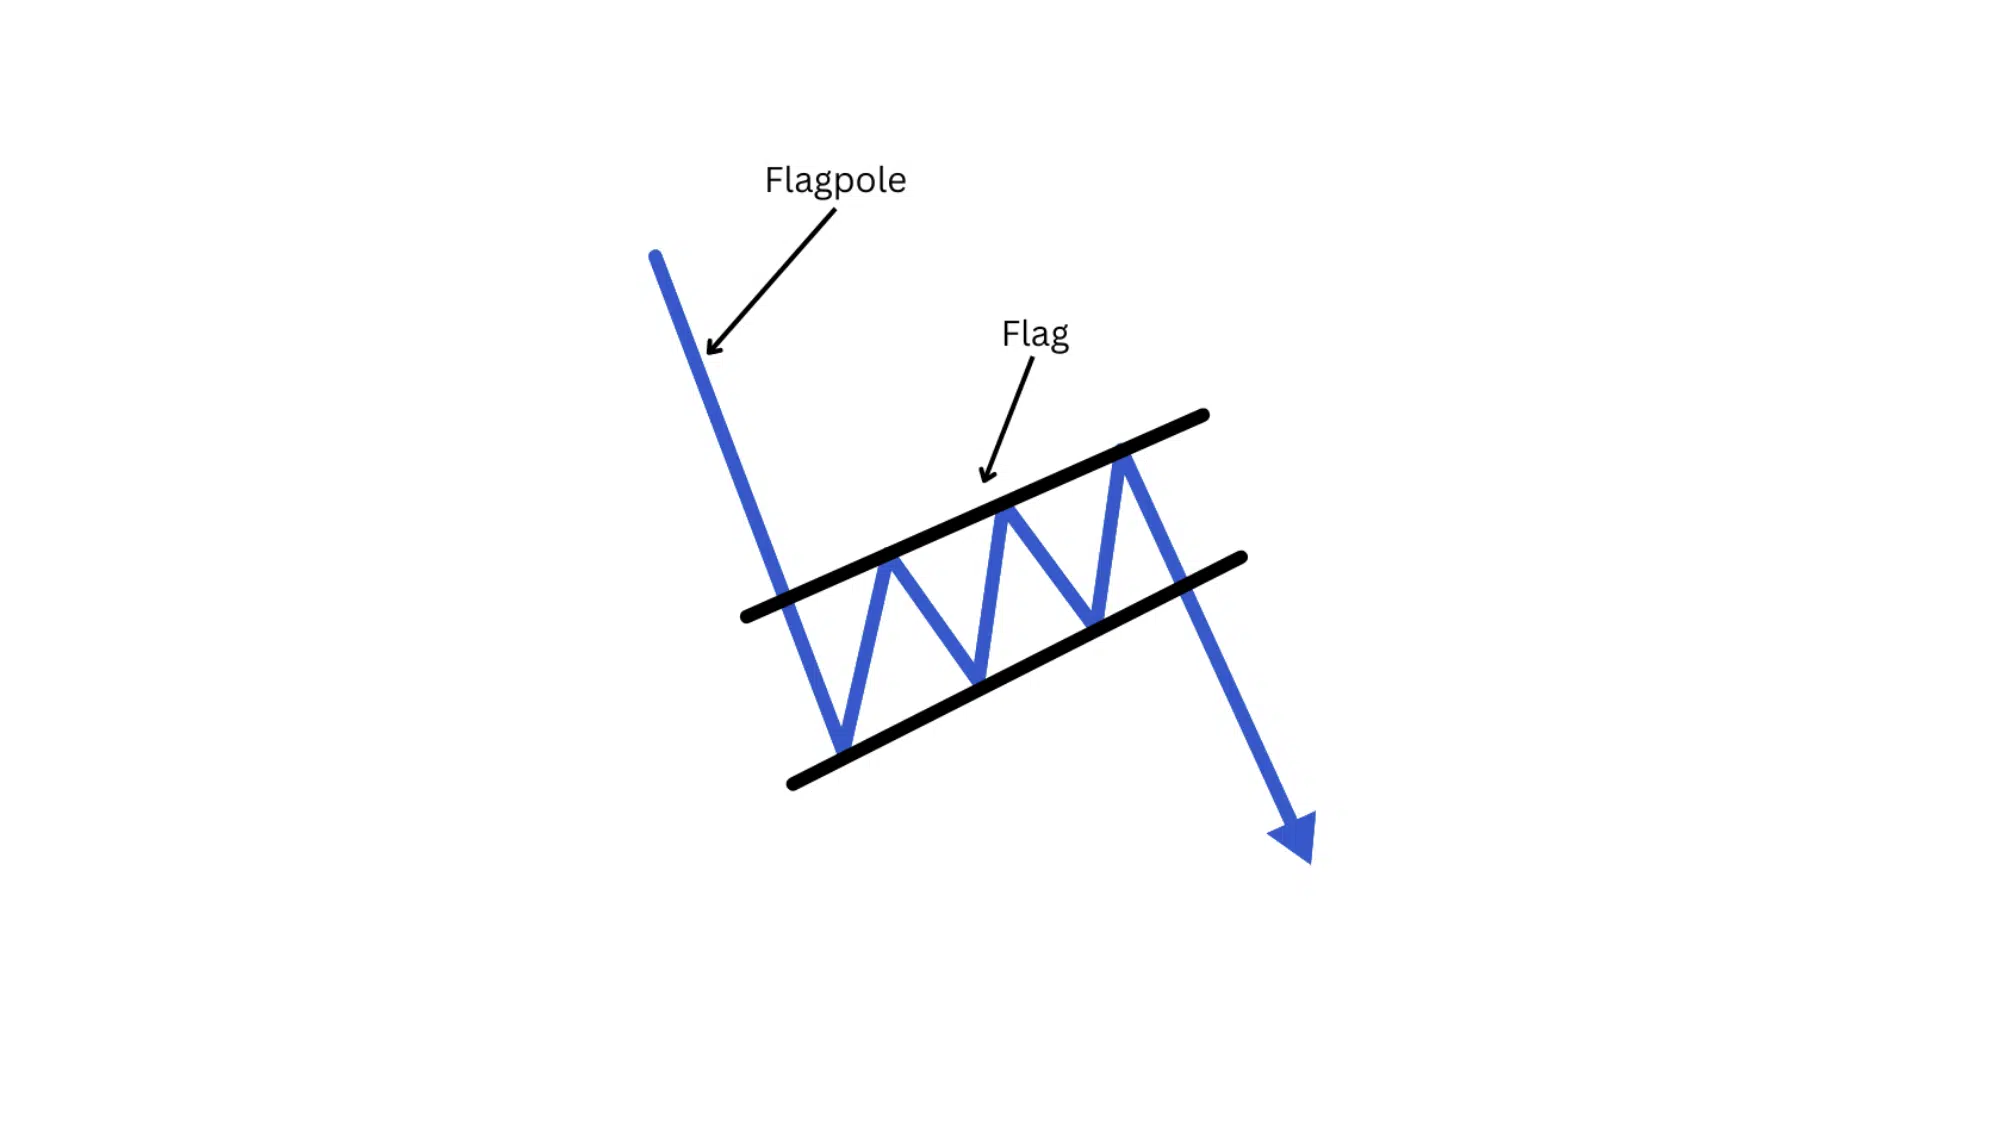
A bearish flag is the mirror image of the bullish flag, forming after a sharp price drop. Prices move slightly upward or sideways within a small rectangular range before continuing the downtrend.
It signals that sellers are still in control, and a further decline is likely after consolidation.
Key Points:
- Appears after a sharp decline.
- Signals continuation of bearish momentum.
How to Identify: Look for a small, upward-sloping rectangular channel that appears after a steep price drop (flagpole).
Application: Traders short when the price breaks below the flag, aiming for a target equal to the previous decline.
6. Bullish Pennant
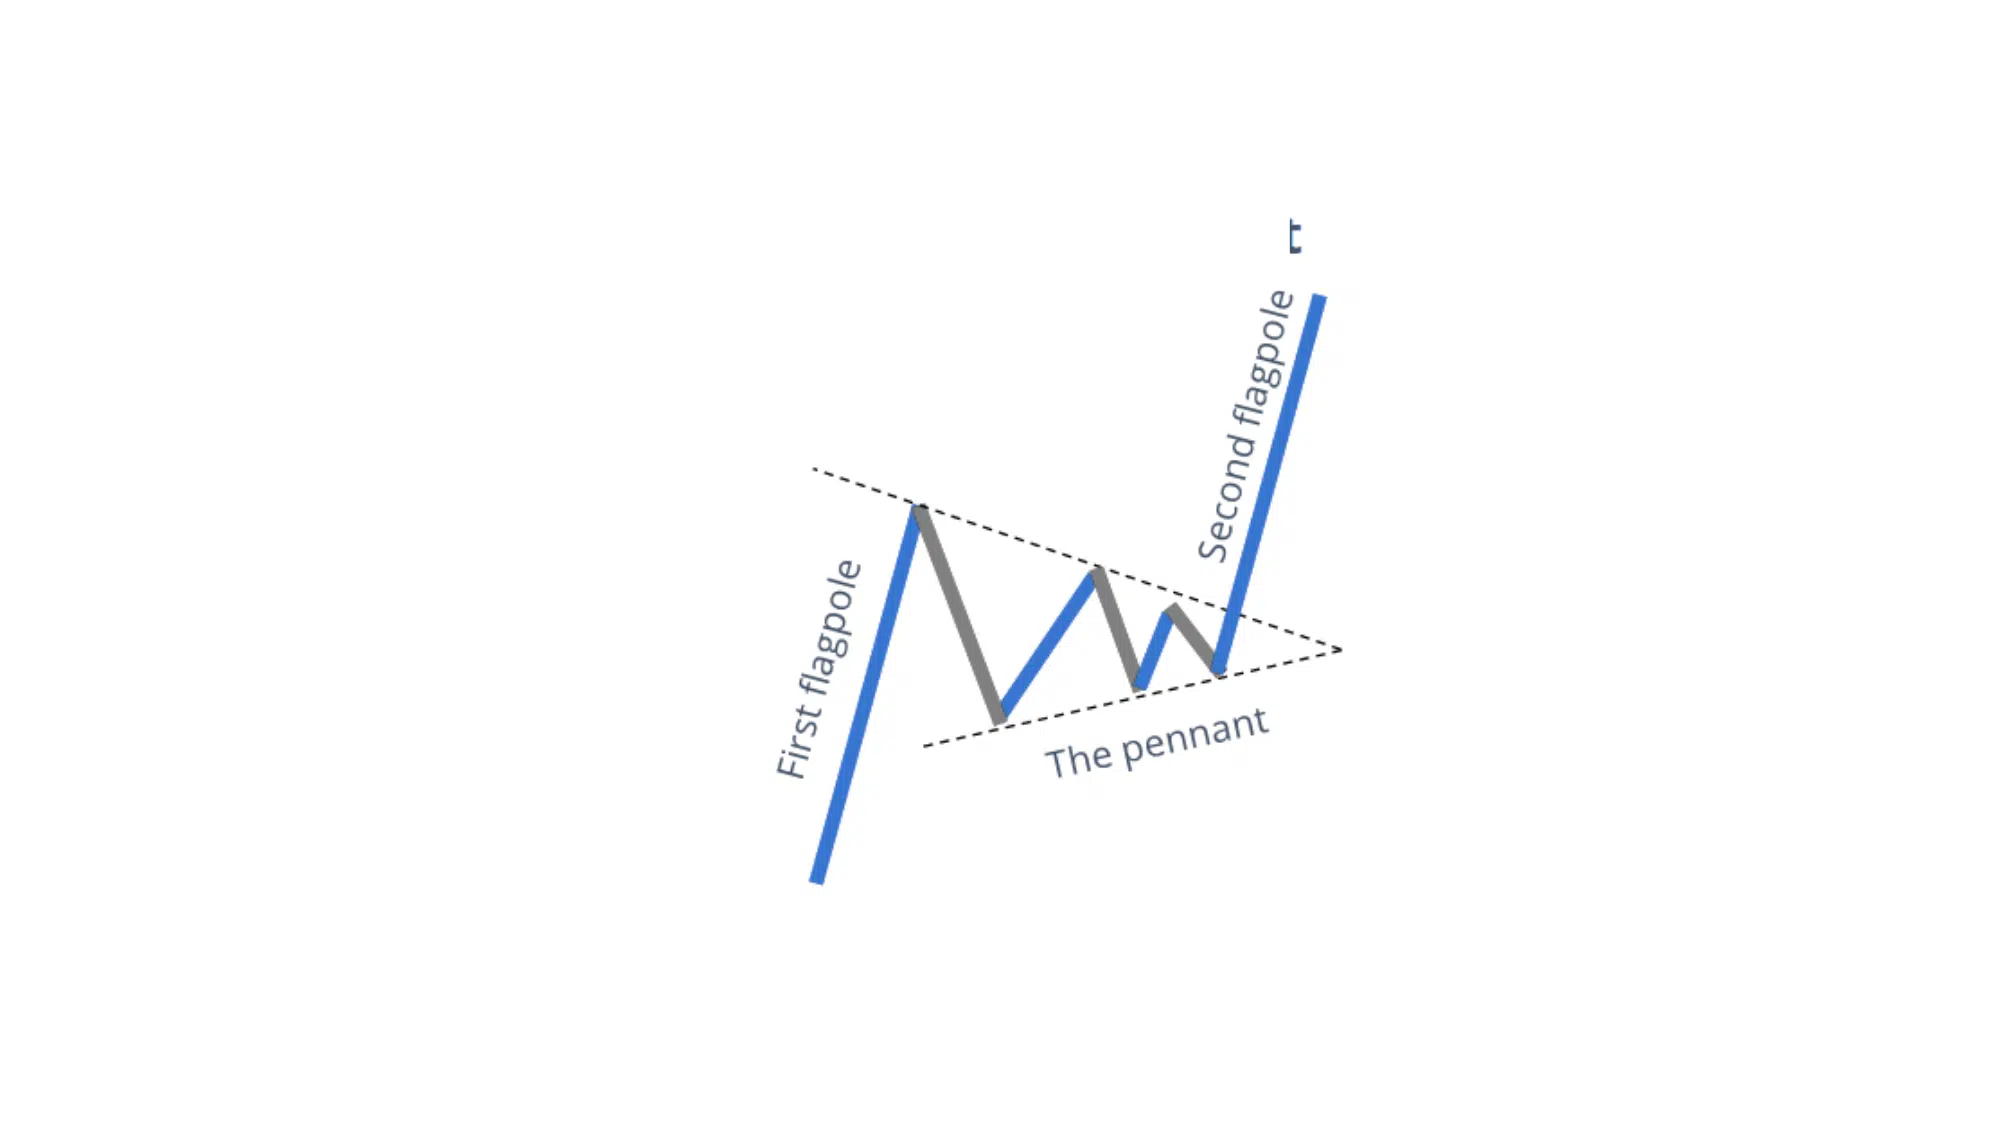
A bullish pennant looks like a small triangle after a strong rally. It shows brief consolidation as traders pause before the next surge.
Once price breaks upward with volume confirmation, the uptrend resumes, often moving the same distance as the initial rally (the flagpole).
Key Points:
- Small triangular shape.
- Indicates a brief rest in an uptrend.
How to Identify: Find a small symmetrical triangle right after a strong upward flagpole, with converging trendlines.
Application: Enter long positions when the price breaks out upward with strong volume, setting a target equal to the height of the flagpole.
7. Bearish Pennant
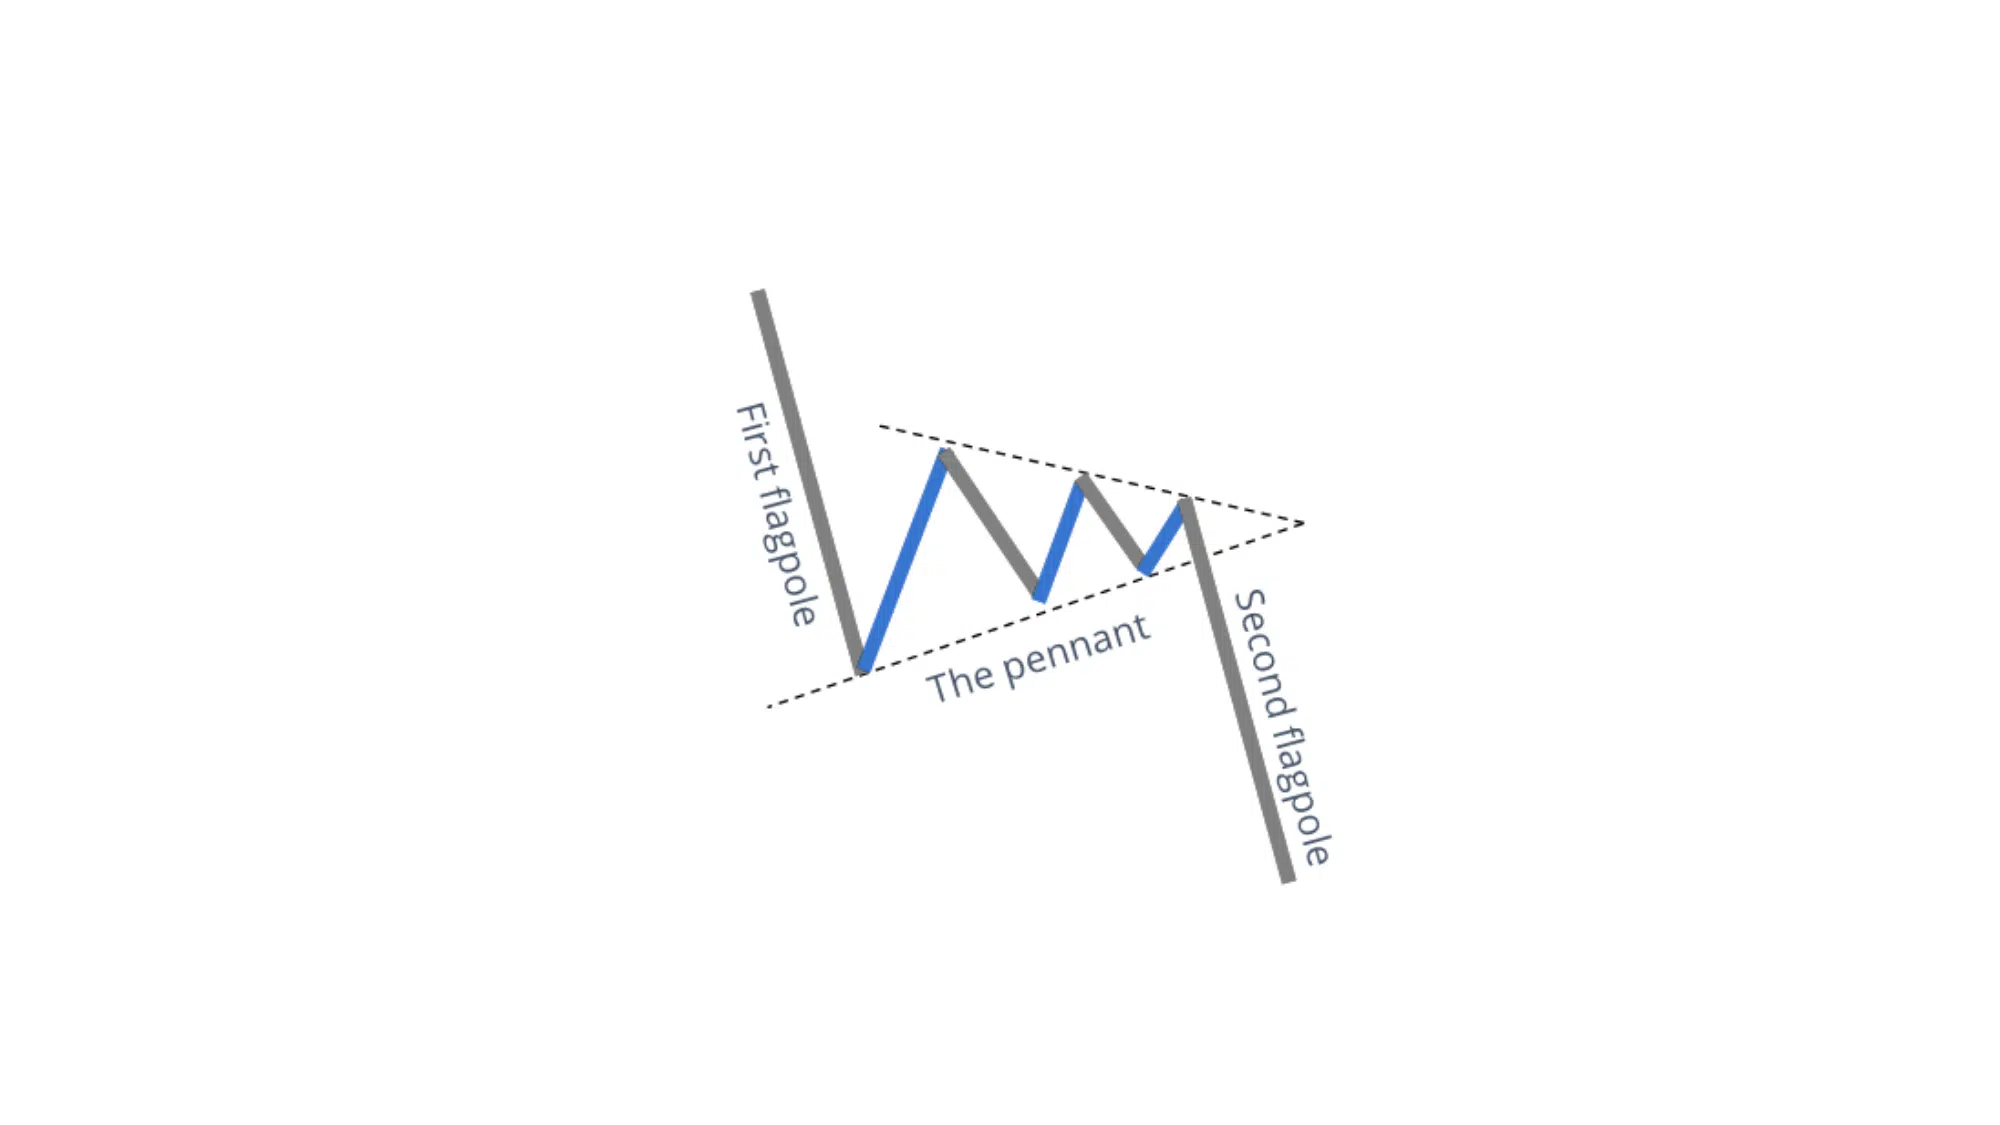
A bearish pennant forms after a steep decline, where the price consolidates slightly upward or sideways before dropping again.
It’s a pause in a downtrend, often caused by traders covering shorts or bargain hunters entering before the selling pressure resumes with force.
Key Points:
- Appears in downtrends.
- Signals continuation of bearish pressure.
How to Identify: Spot a small symmetrical triangle following a steep downward flagpole, with tightening price action.
Application: Enter short after a confirmed breakdown below the pennant with a volume spike, targeting a move equal to the flagpole’s length.
Reversal Patterns (Trend Change Signals)
Reversal patterns signal when a crypto trend is about to change direction, turning an uptrend into a downtrend or vice versa.
Recognizing these patterns early helps you anticipate market reversals, adjust your trades, and manage risk more effectively.
8. Head and Shoulders
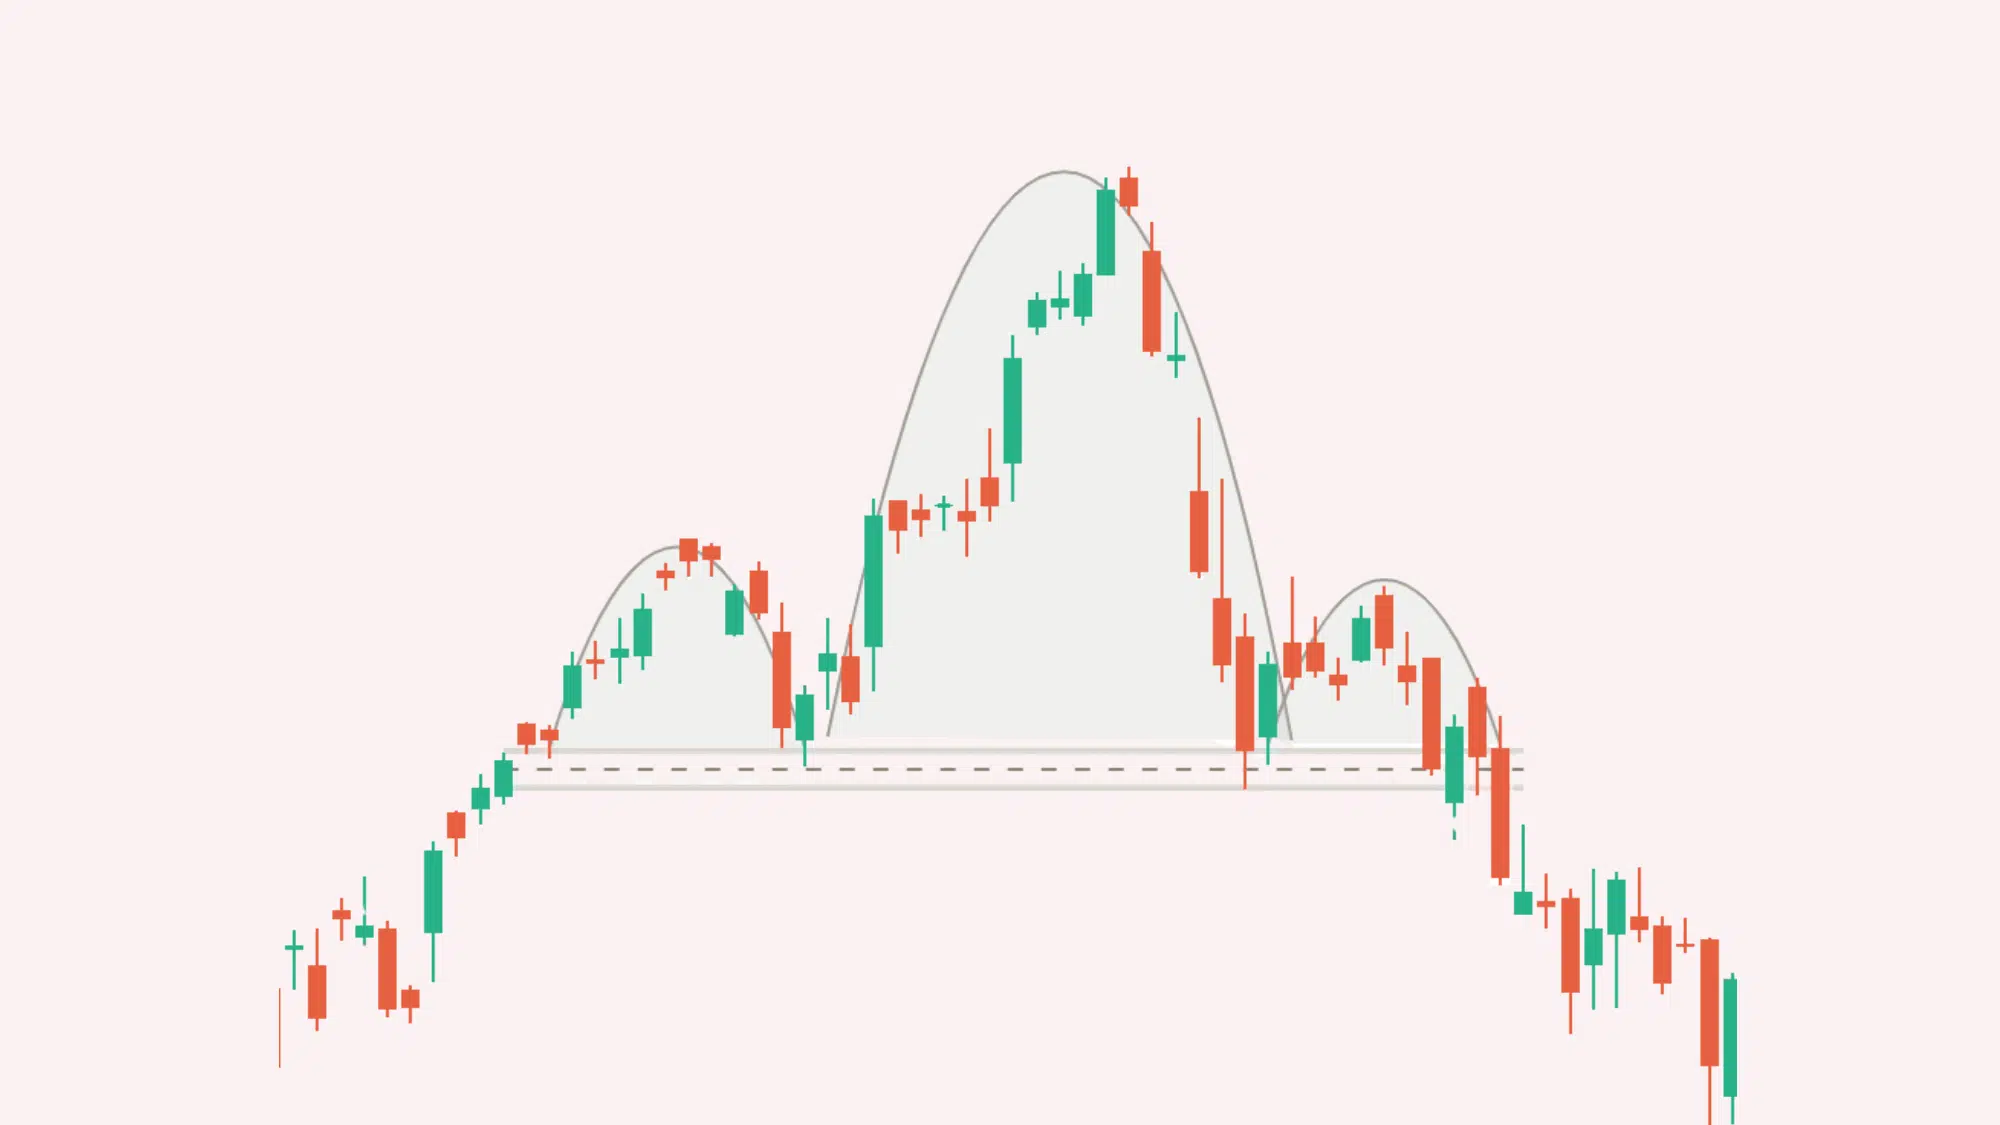
The Head and Shoulders pattern is one of the most reliable bearish reversal signals. It forms three peaks — two smaller “shoulders” on either side of a higher “head.”
As price breaks below the neckline, it indicates that buyers are losing control and a downtrend is likely to begin, often leading to strong selling momentum.
Key Points:
- Indicates weakening bullish pressure.
- Suggests a potential trend reversal to the downside.
How to Identify: Spot three peaks with a flat or slightly rising neckline connecting the two dips between them.
Application: Enter short after a confirmed neckline break on strong volume. Target a move equal to the height of the head, and place a stop-loss just above the right shoulder.
9. Inverse Head and Shoulders
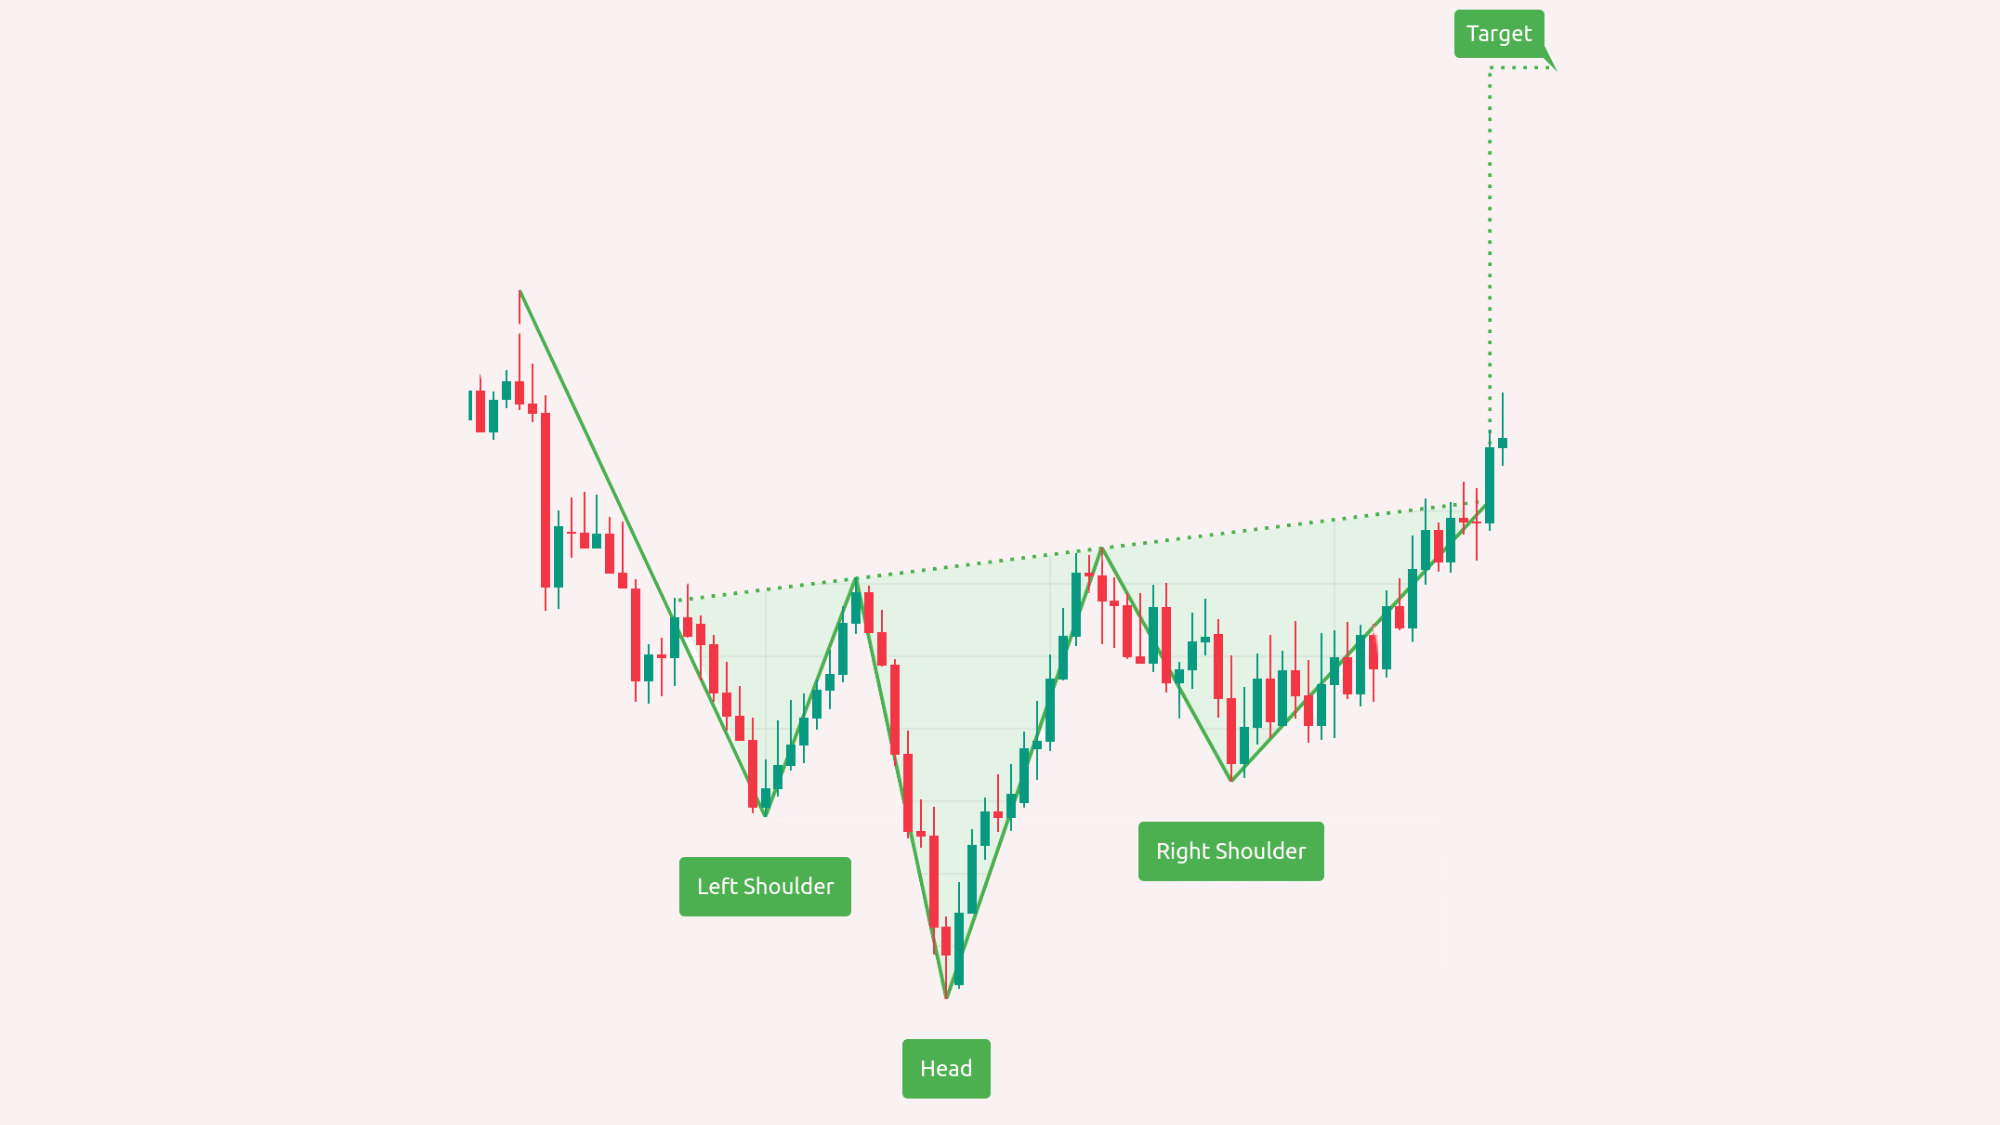
The Inverse Head and Shoulders pattern is the bullish opposite of the regular formation. It appears after a long downtrend, featuring three troughs, the middle one being the deepest.
This shows that sellers are weakening and buyers are stepping in. A breakout above the neckline confirms the reversal and signals a potential new uptrend.
Key Points:
- Shows the shift from bearish to bullish momentum.
- Reliable reversal indicator in downtrends.
How to Identify: Look for three consecutive lows with a neckline drawn through the two highs between them.
Application: Buy when the price closes above the neckline with volume confirmation. Place a stop-loss below the right shoulder and target the height of the head for profit.
10. Double Top
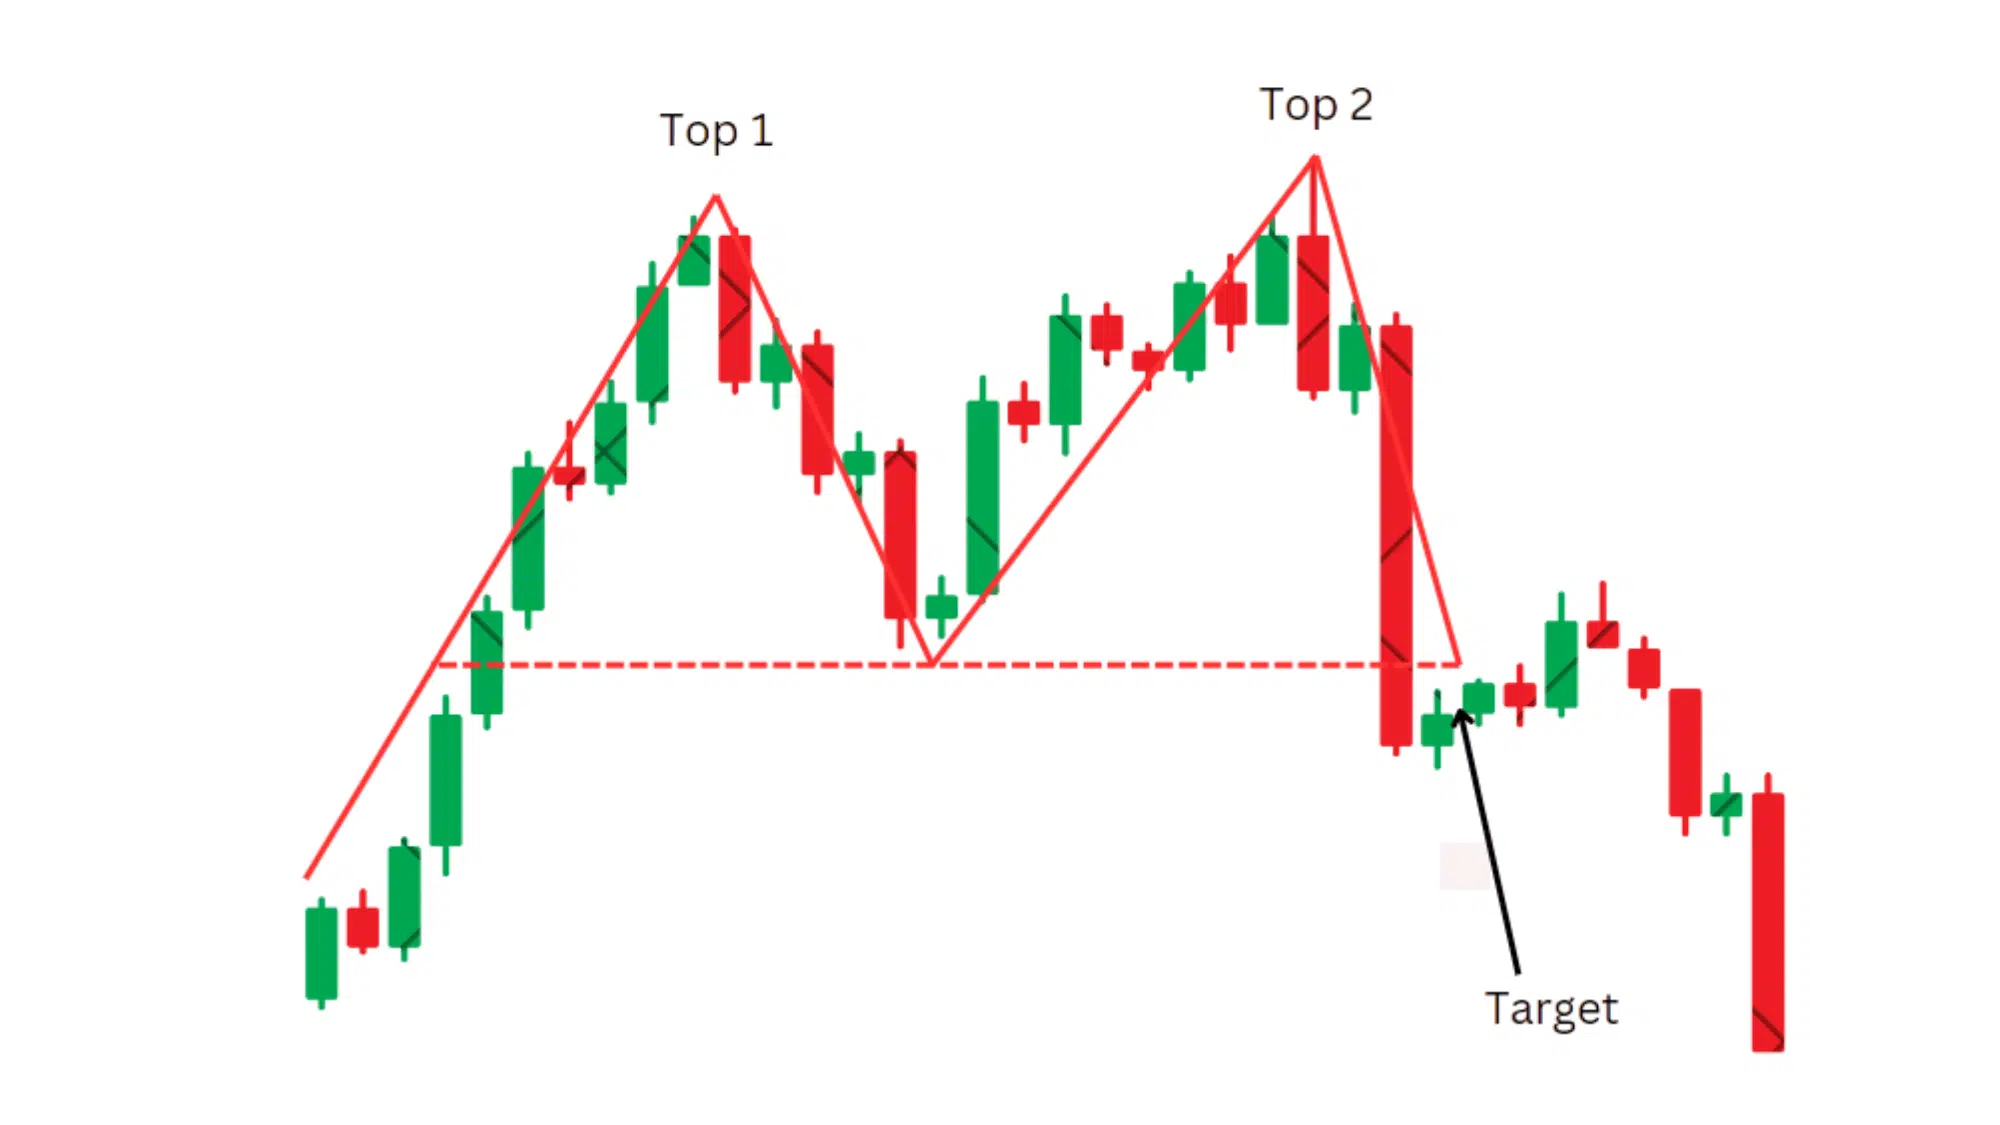
A Double Top signals that a bullish trend is losing steam. The pattern forms when the price hits a resistance level twice but fails to break through.
This suggests buyers are exhausted and sellers are gaining power. Once the price drops below the neckline (the midpoint low), it often leads to a strong downward move.
Key Points:
- Indicates buyer fatigue at resistance.
- Common before significant downtrends.
How to Identify: Spot two similar peaks with a dip (neckline) in between at roughly equal heights.
Application: Enter short when the price breaks below the neckline on high volume. Set a stop-loss above the second peak and target a drop equal to the pattern’s height.
11. Double Bottom
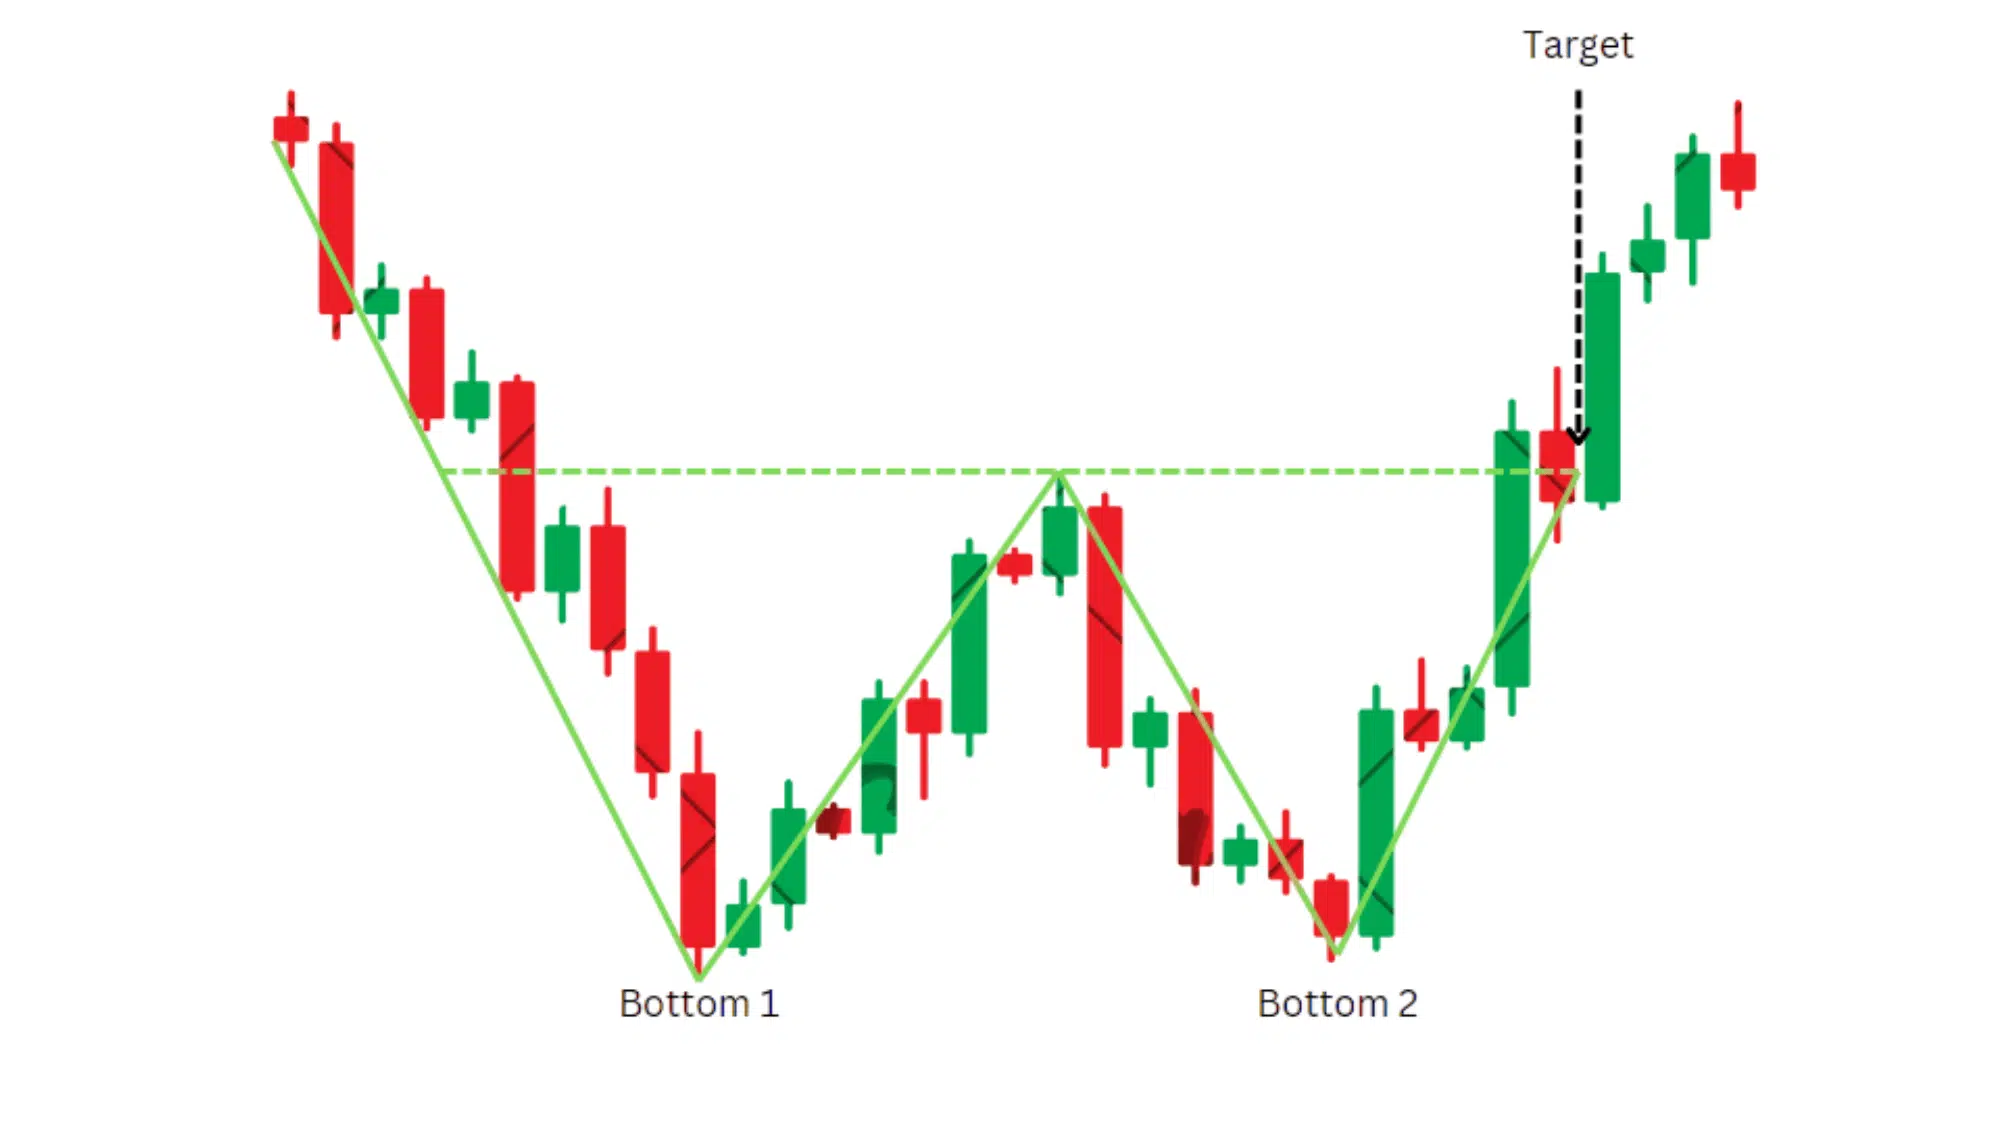
A Double Bottom pattern looks like the letter “W” and forms after a prolonged decline. It signals that sellers have tried and failed twice to push prices lower.
Once the price breaks above the neckline, it often triggers a strong bullish reversal as traders gain confidence and momentum shifts upward.
Key Points:
- Appears after extended downtrends.
- Signals strong buying pressure and reversal potential.
How to Identify: Find two similar lows with a small peak (neckline) between them, forming a “W” shape.
Application: Enter long when the price breaks above the neckline with solid volume. Place a stop-loss below the second low and target the height from the neckline to the bottom.
12. Triple Top
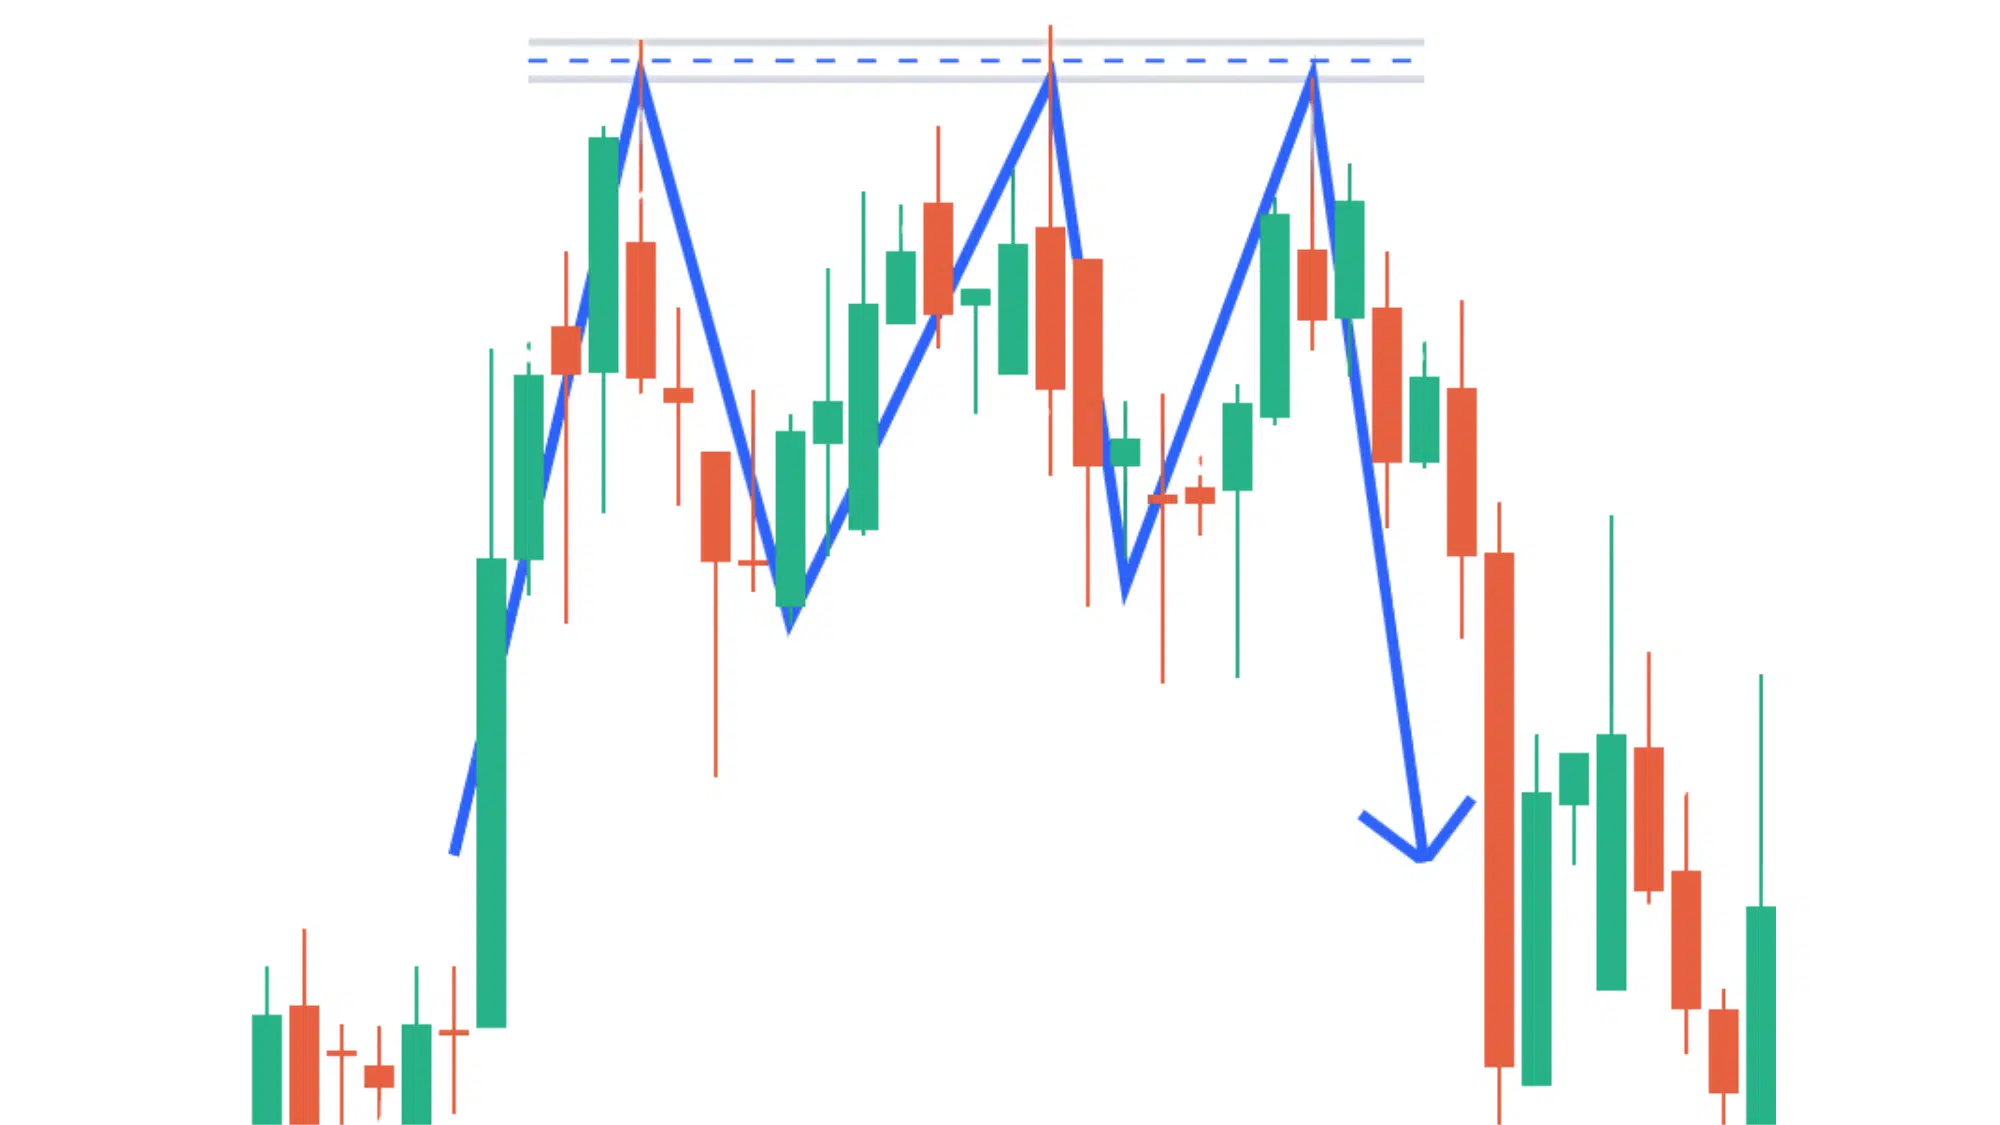
The Triple Top pattern represents a strong resistance zone tested three times without a breakout. Each failed attempt to move higher shows that buyers are losing momentum.
When the neckline breaks, it confirms the reversal and usually results in a deeper correction or a new bearish phase.
Key Points:
- Indicates repeated resistance and fading demand.
- Strong bearish reversal formation.
How to Identify: Spot three similar peaks separated by two small pullbacks and a clear neckline beneath them.
Application: Sell when price closes below the neckline with increased volume. Use the height between neckline and peaks for target projection and set a stop-loss above the last top.
13. Triple Bottom
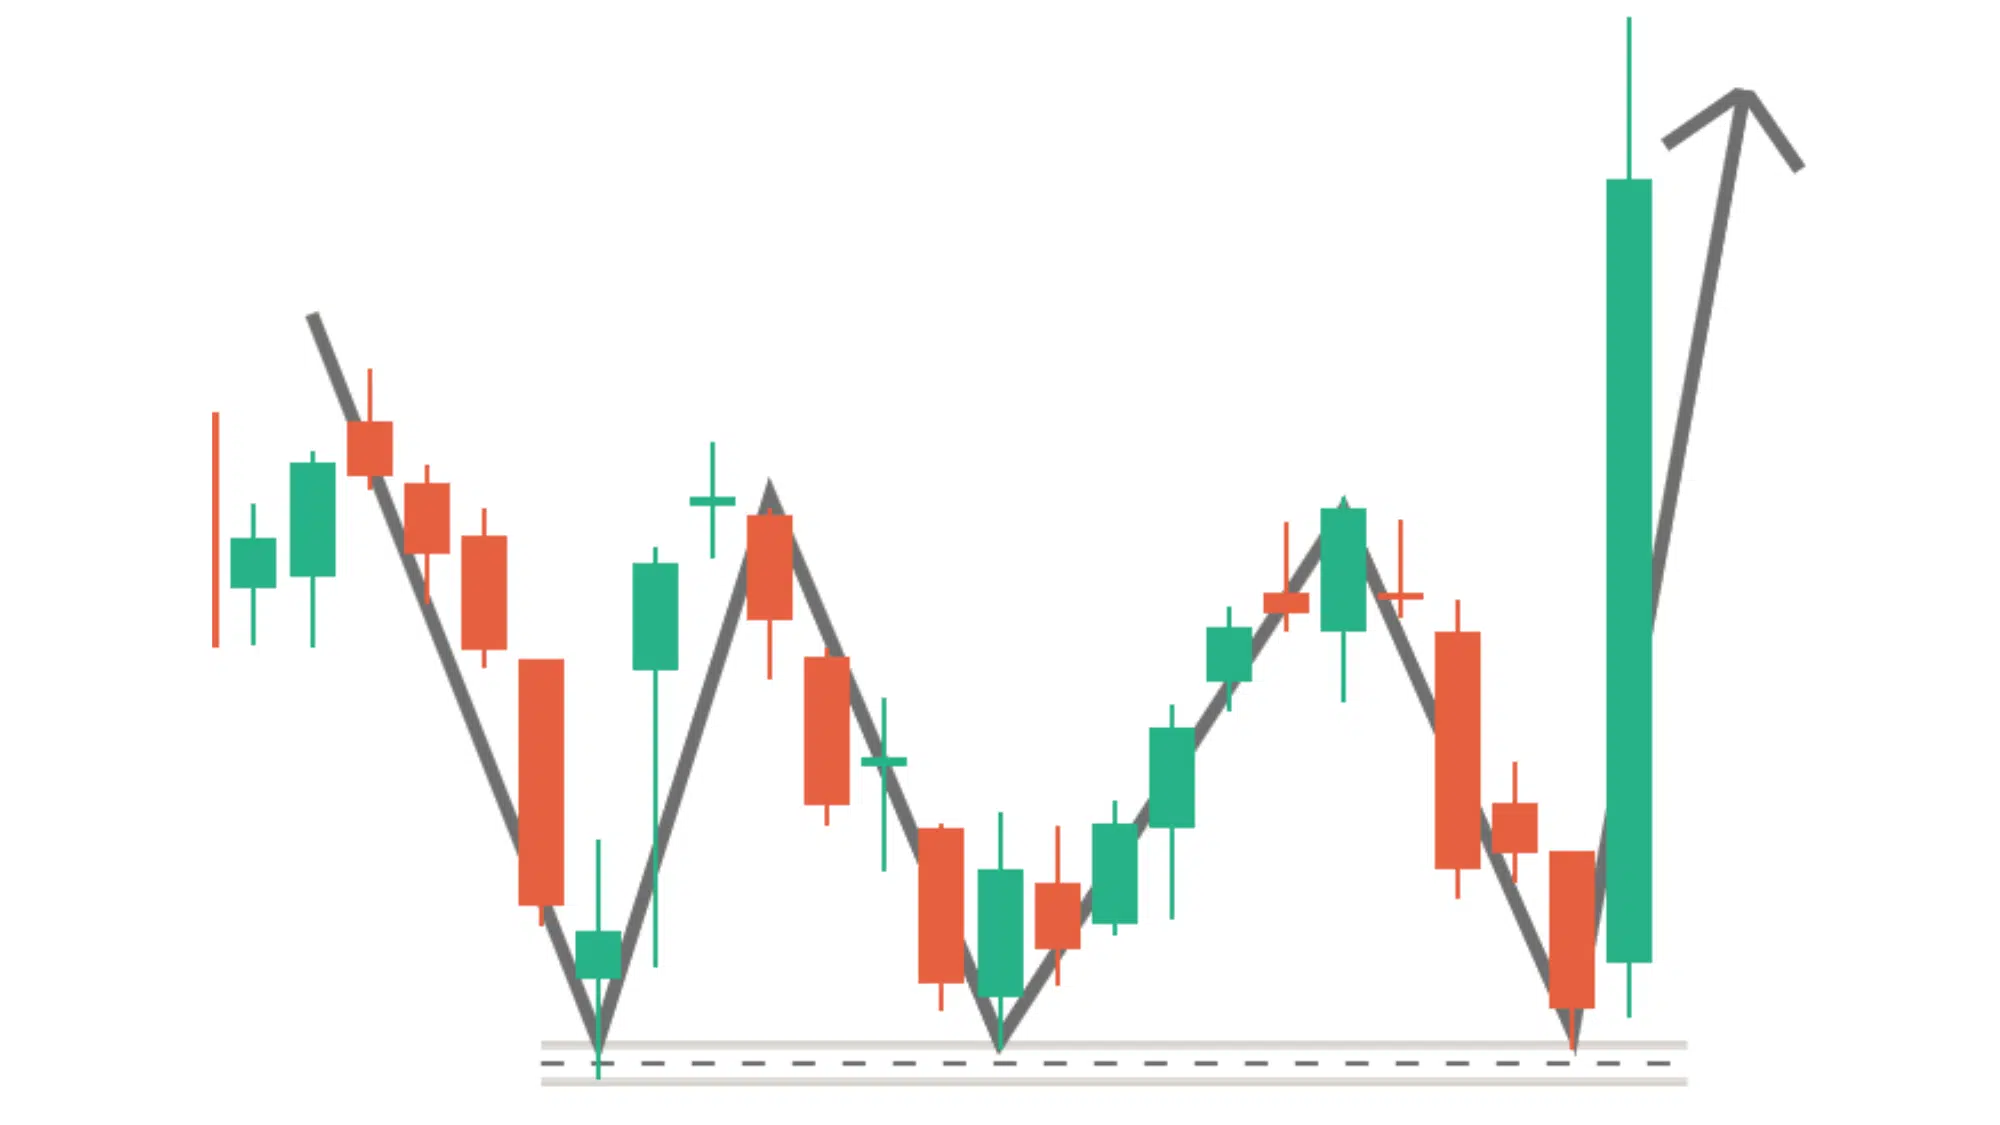
The Triple Bottom forms when a crypto asset tests the same support level three times but fails to go lower. It reflects strong buying pressure and accumulation, signaling that a bullish reversal may be near.
When the price finally breaks above resistance, it often sparks a powerful upward trend.
Key Points:
- Suggests strong support and market recovery.
- Often appears before major bullish moves.
How to Identify: Find three distinct lows of similar depth with a neckline connecting the minor highs between them.
Application: Enter long after a confirmed breakout above the neckline with high volume. Place a stop-loss just below the last bottom and target the height of the pattern.
14. Rising Wedge
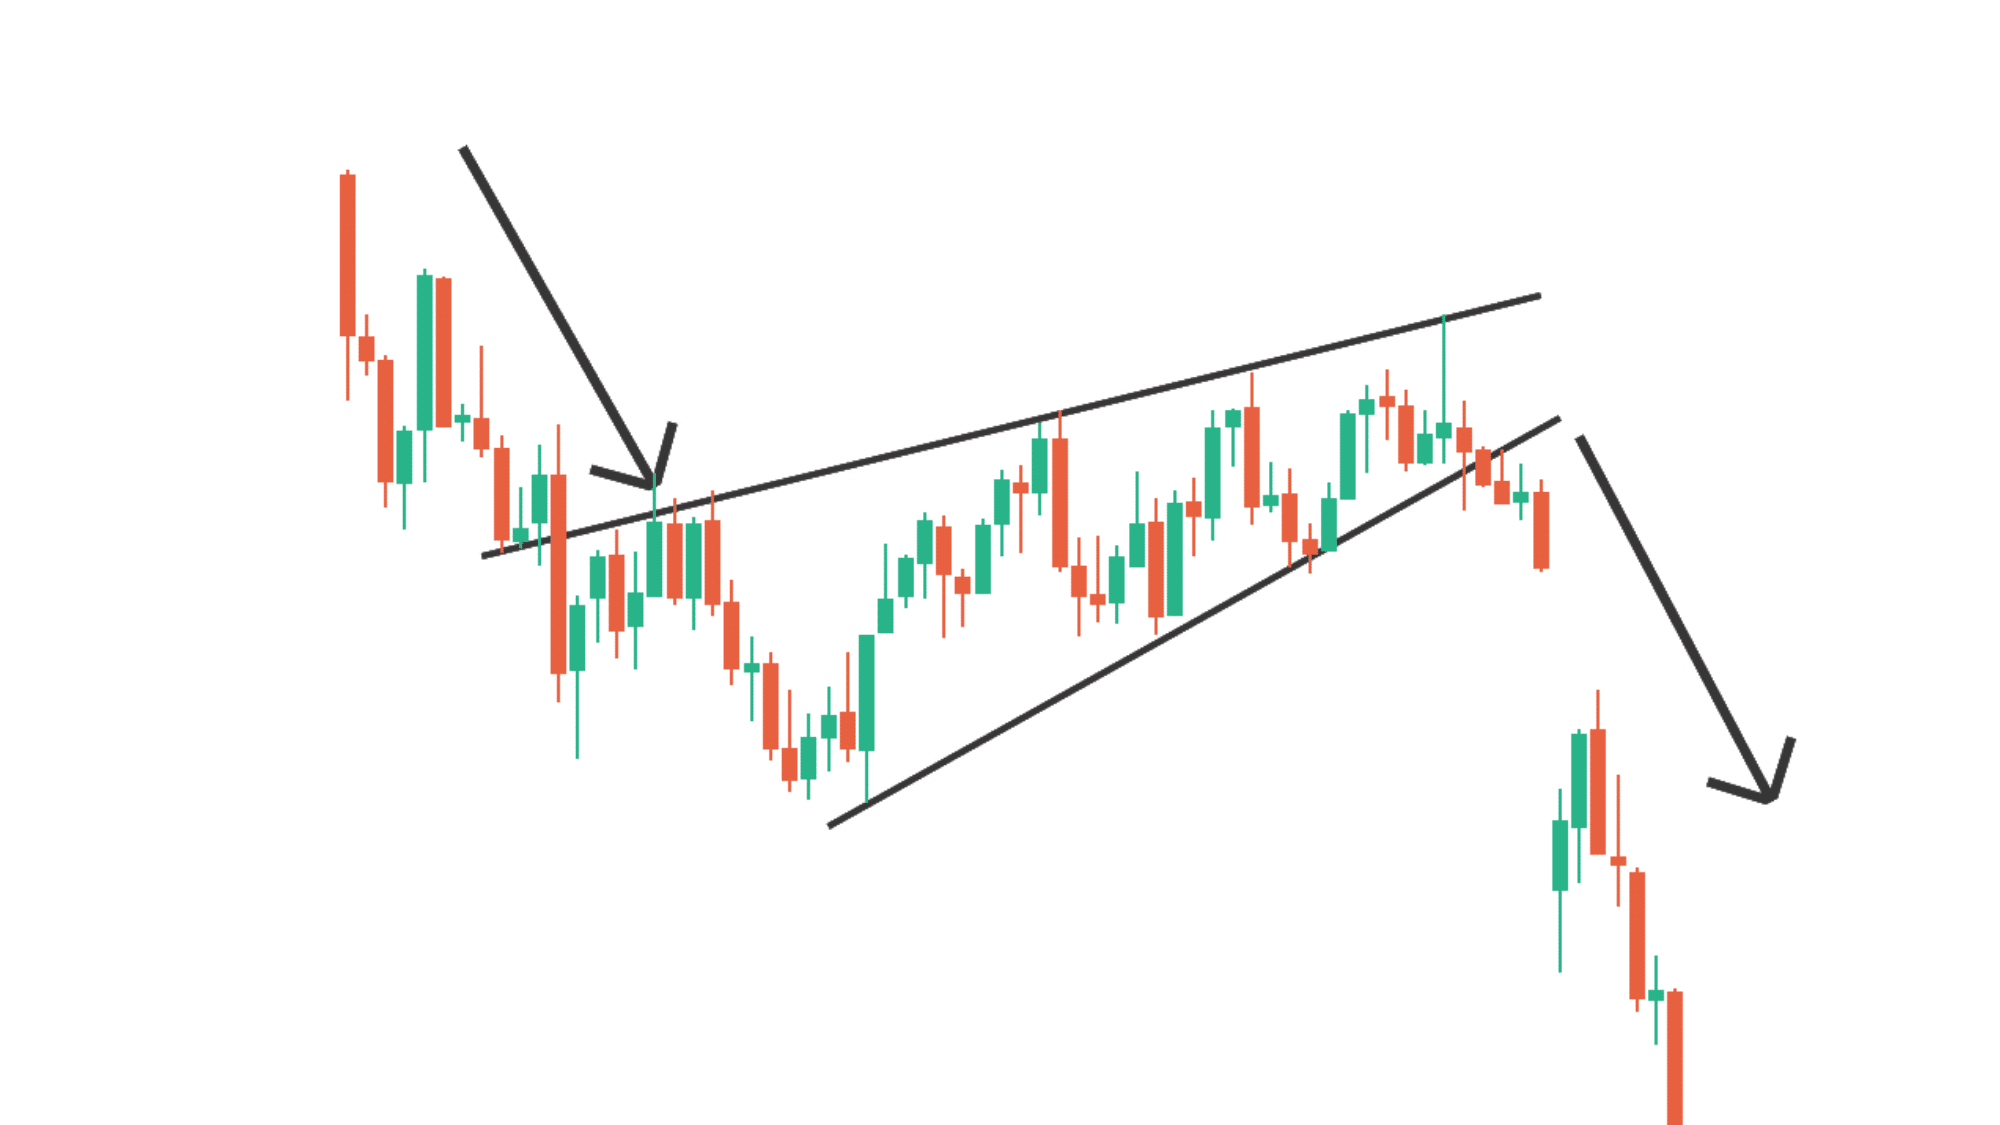
A Rising Wedge develops when prices make higher highs and higher lows but the range narrows. It signals weakening upward momentum, the uptrend is slowing, and sellers may soon take over.
A breakdown below the lower trendline usually confirms a bearish reversal and can lead to a sharp decline.
Key Points:
- Shows slowing bullish strength.
- Common near the end of uptrends.
How to Identify: Connect rising highs and lows with two upward-sloping, converging trendlines.
Application: Enter short when price breaks below the lower support line with volume confirmation. Set a target equal to the wedge’s widest section and use tight stop-losses.
15. Falling Wedge
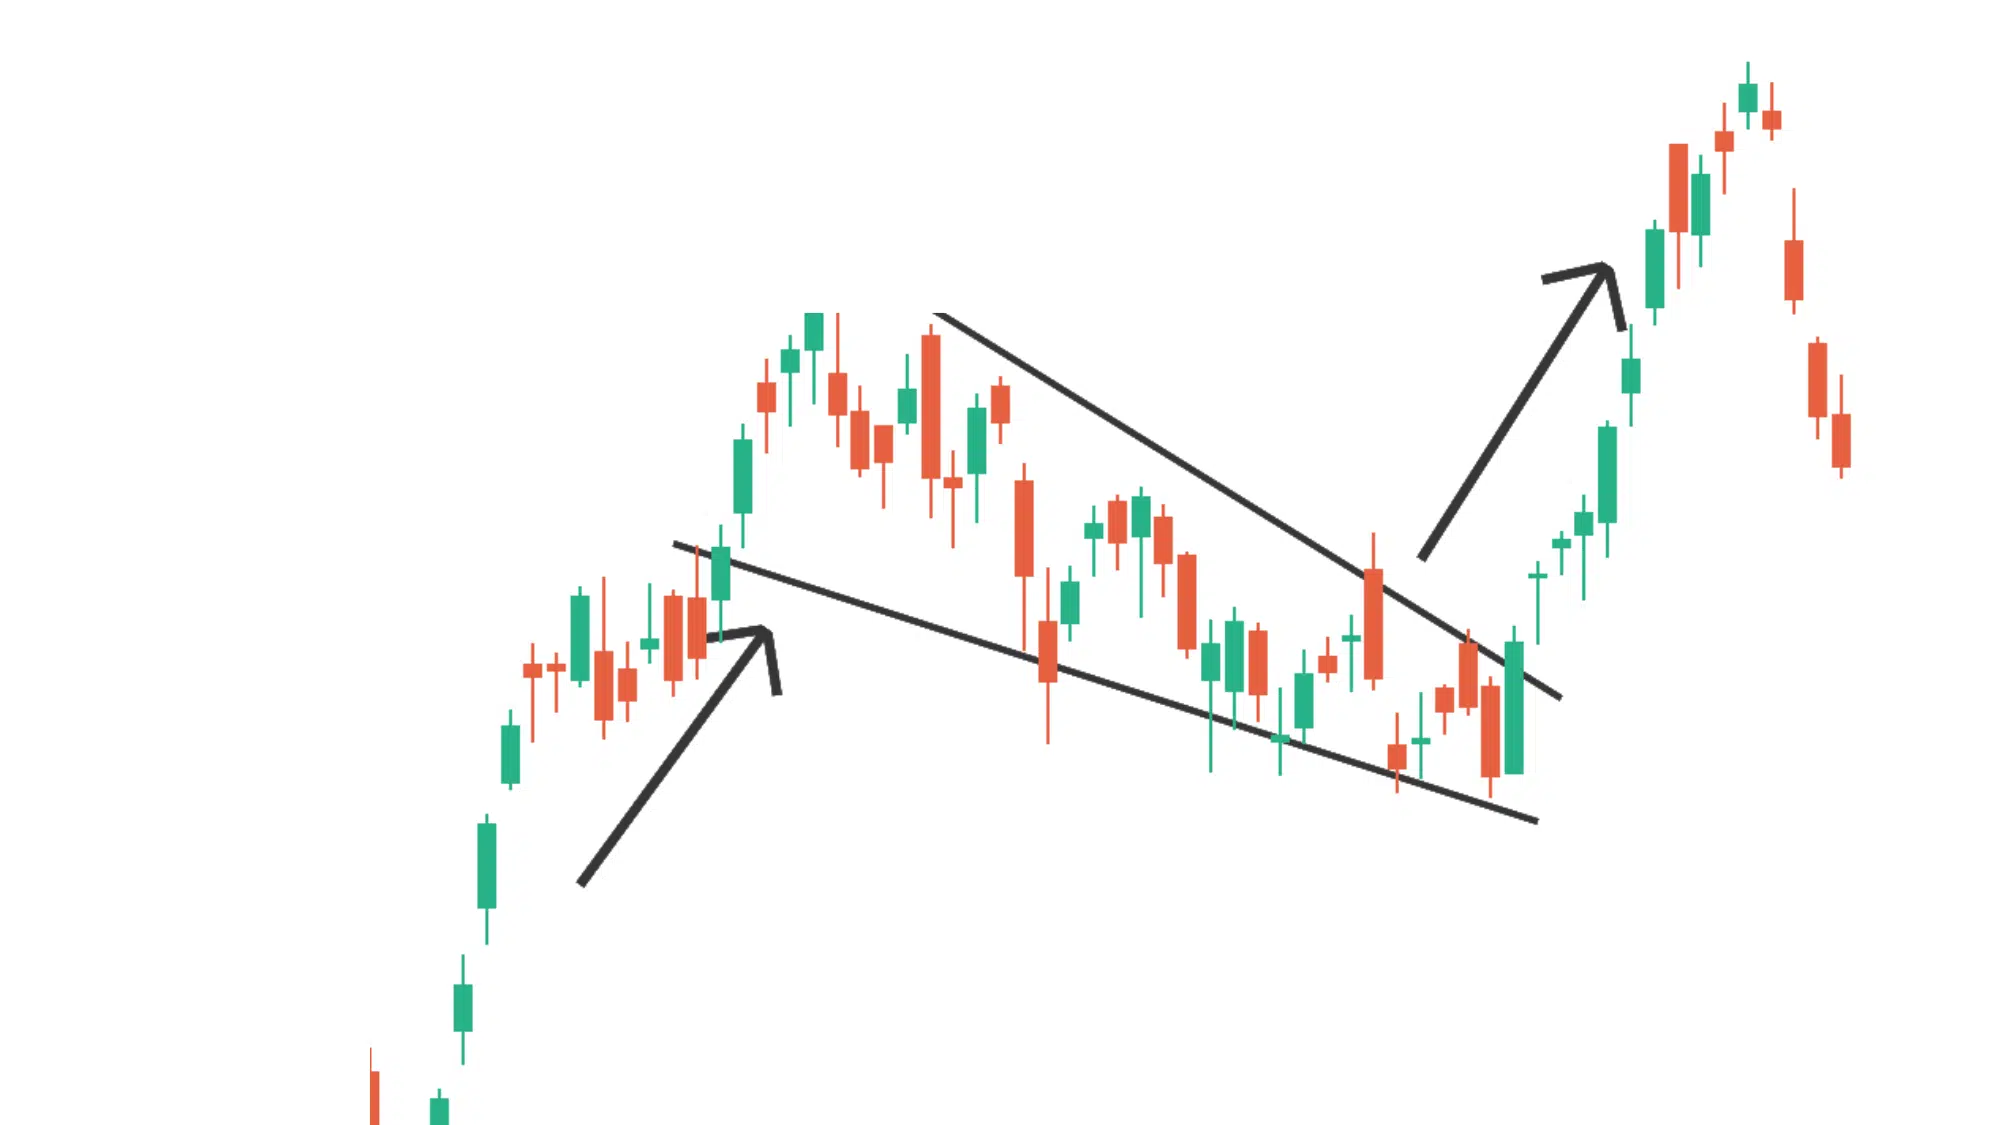
A Falling Wedge is a bullish reversal pattern that appears when prices make lower highs and lower lows within narrowing boundaries.
It shows that selling pressure is fading and a breakout to the upside is likely. Once the upper resistance line breaks, buyers usually take control, starting a new upward trend.
Key Points:
- Suggests declining selling pressure.
- Typically forms at the end of downtrends.
How to Identify: Draw two downward-sloping, converging trendlines connecting lower highs and lows.
Application: Buy after a confirmed breakout above the upper line with strong volume. Set stop-loss below the latest swing low and aim for a target matching the wedge’s height.
Neutral & Less Common Patterns
Neutral and less common chart patterns don’t always point clearly to a bullish or bearish move; instead, they show market indecision or balance between buyers and sellers.
16. Rectangle (Trading Range)
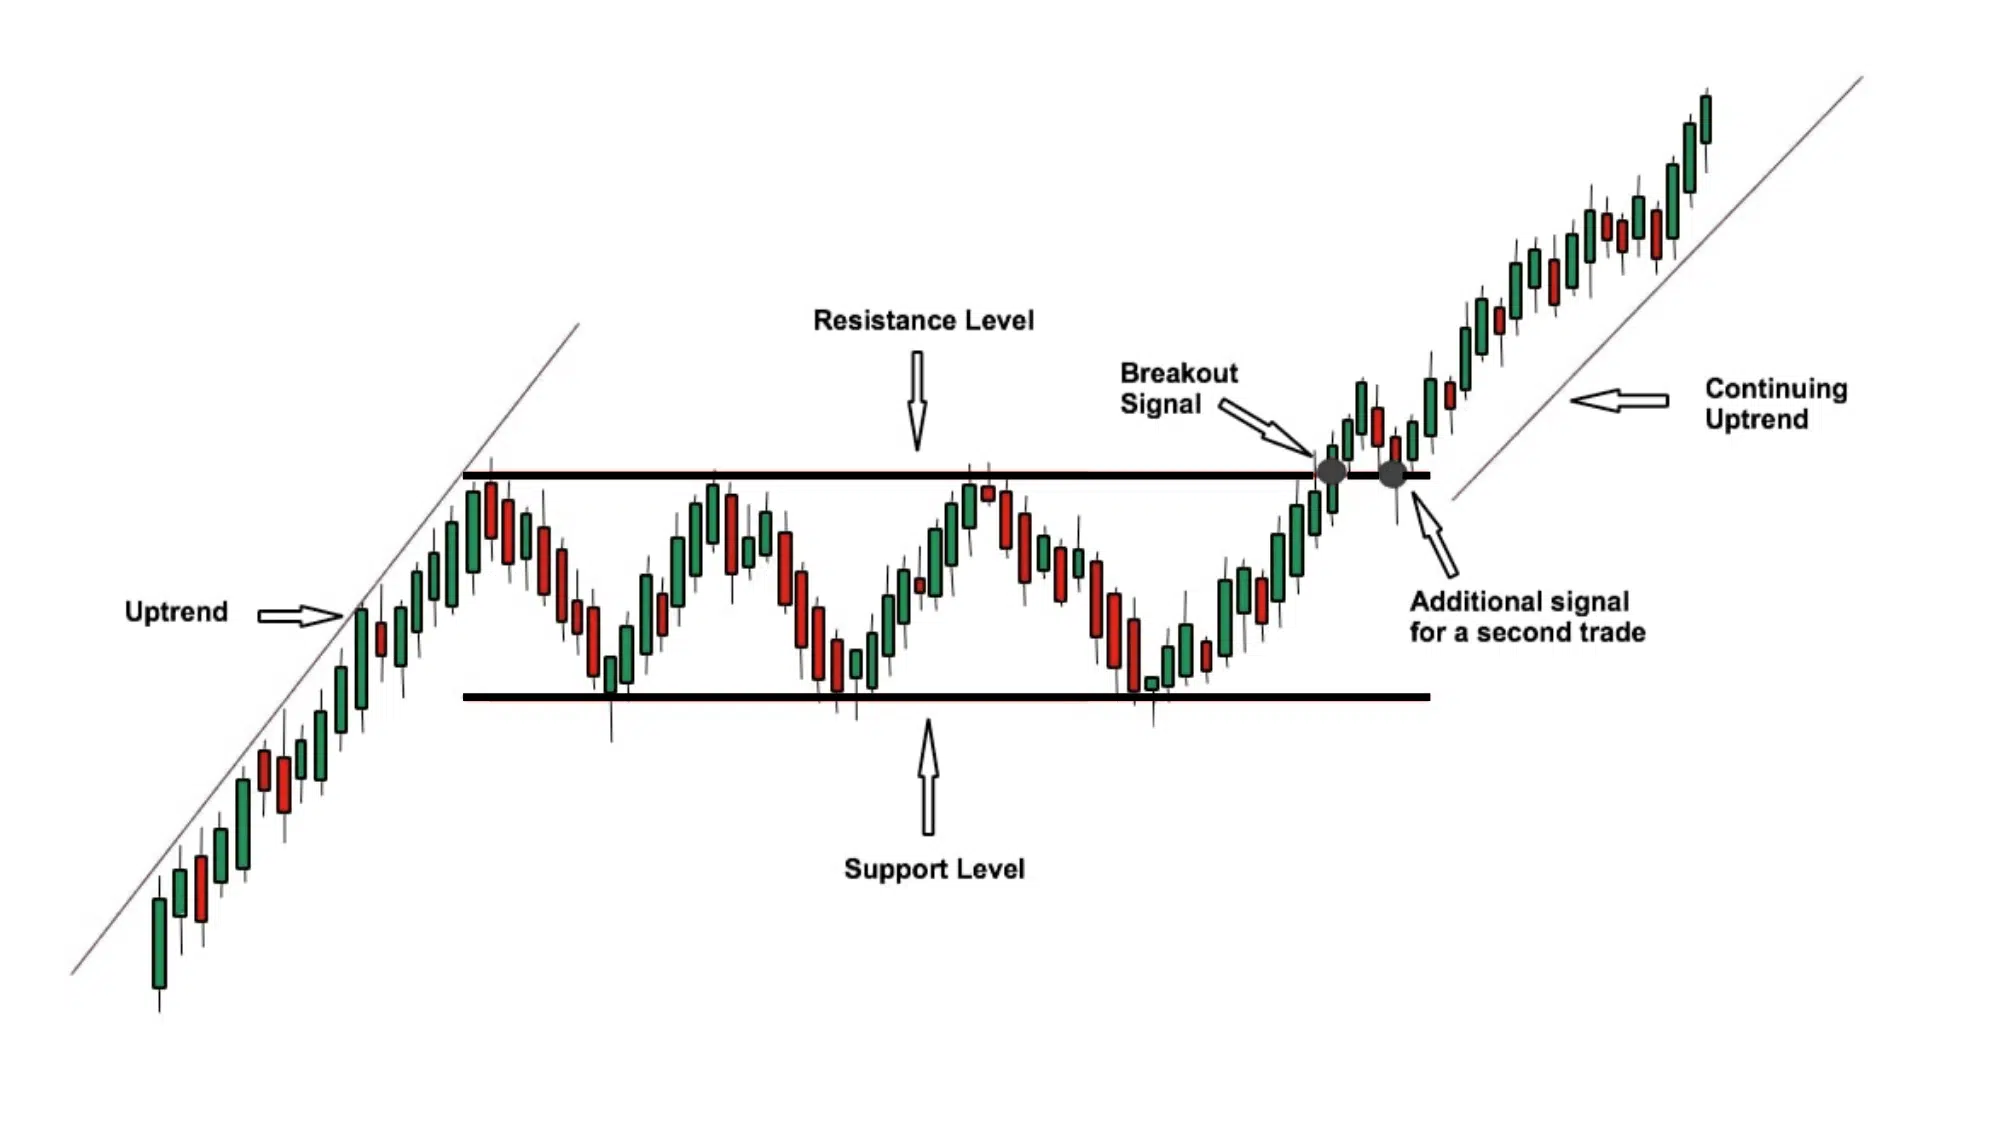
A Rectangle pattern forms when the price moves sideways between a clear support and resistance level. It shows that buyers and sellers are evenly matched for a while.
Once price breaks out of this range, the market usually makes a strong directional move, either upward or downward, depending on which side breaks first.
Key Points:
- Reflects market indecision or consolidation.
- It can lead to breakouts in either direction.
How to Identify: Look for horizontal support and resistance lines containing multiple touches on both sides of the range.
Application: Enter trades only after a confirmed breakout with volume. Go long on upward breaks or short on downward breaks. Use the height of the rectangle to estimate profit targets.
17. Cup and Handle
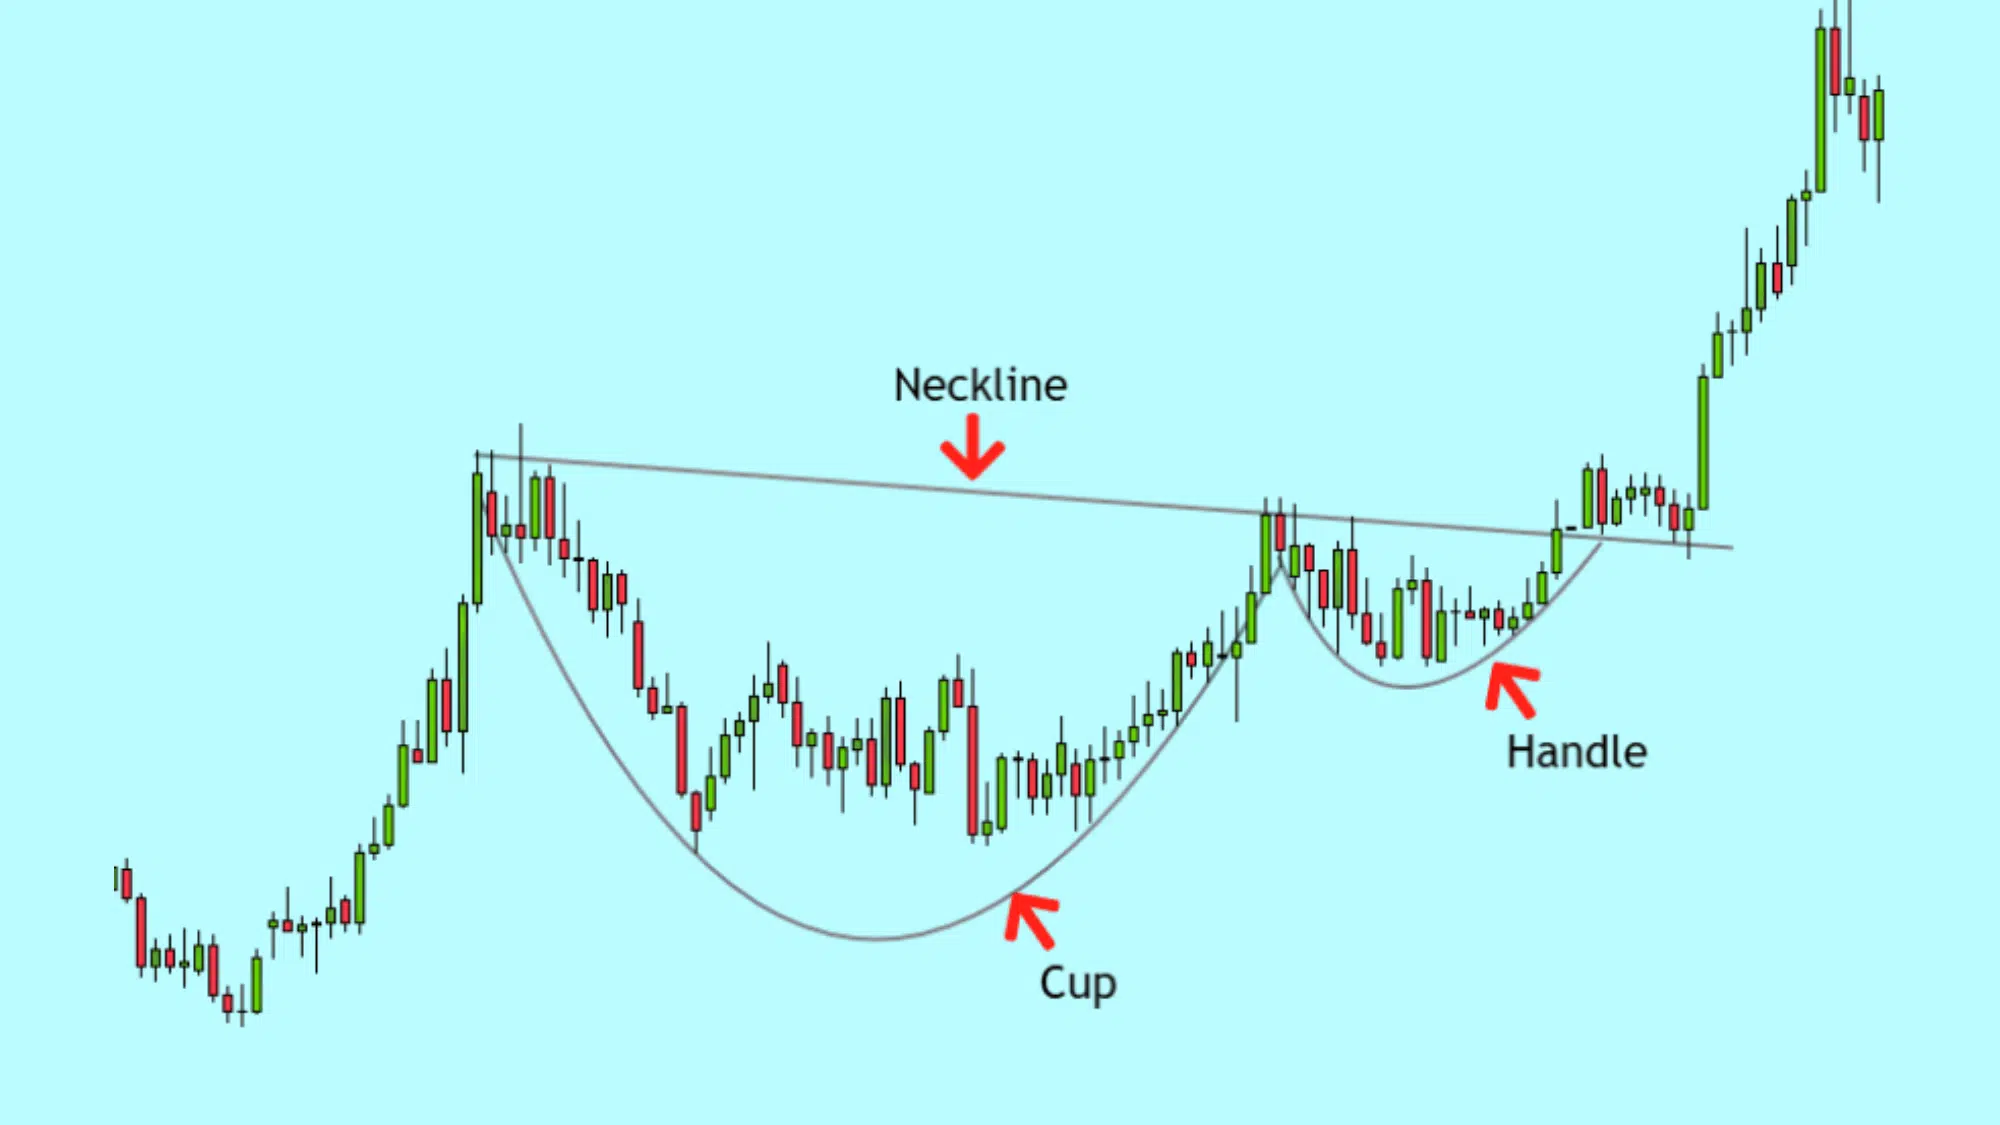
The Cup and Handle is a bullish continuation pattern that looks like a teacup with a small handle.
It forms when price gradually rounds off at the bottom, rises to previous highs, and then consolidates slightly before breaking higher. It’s often seen after strong uptrends and signals renewed bullish momentum.
Key Points:
- Indicates accumulation before breakout.
- Popular in medium- to long-term charts.
How to Identify: Find a rounded “cup” shape followed by a small downward or sideways “handle” before price rises again.
Application: Enter long after price breaks above the handle’s resistance line with volume. Set a stop-loss below the handle and target the height of the cup.
18. Rounding Bottom
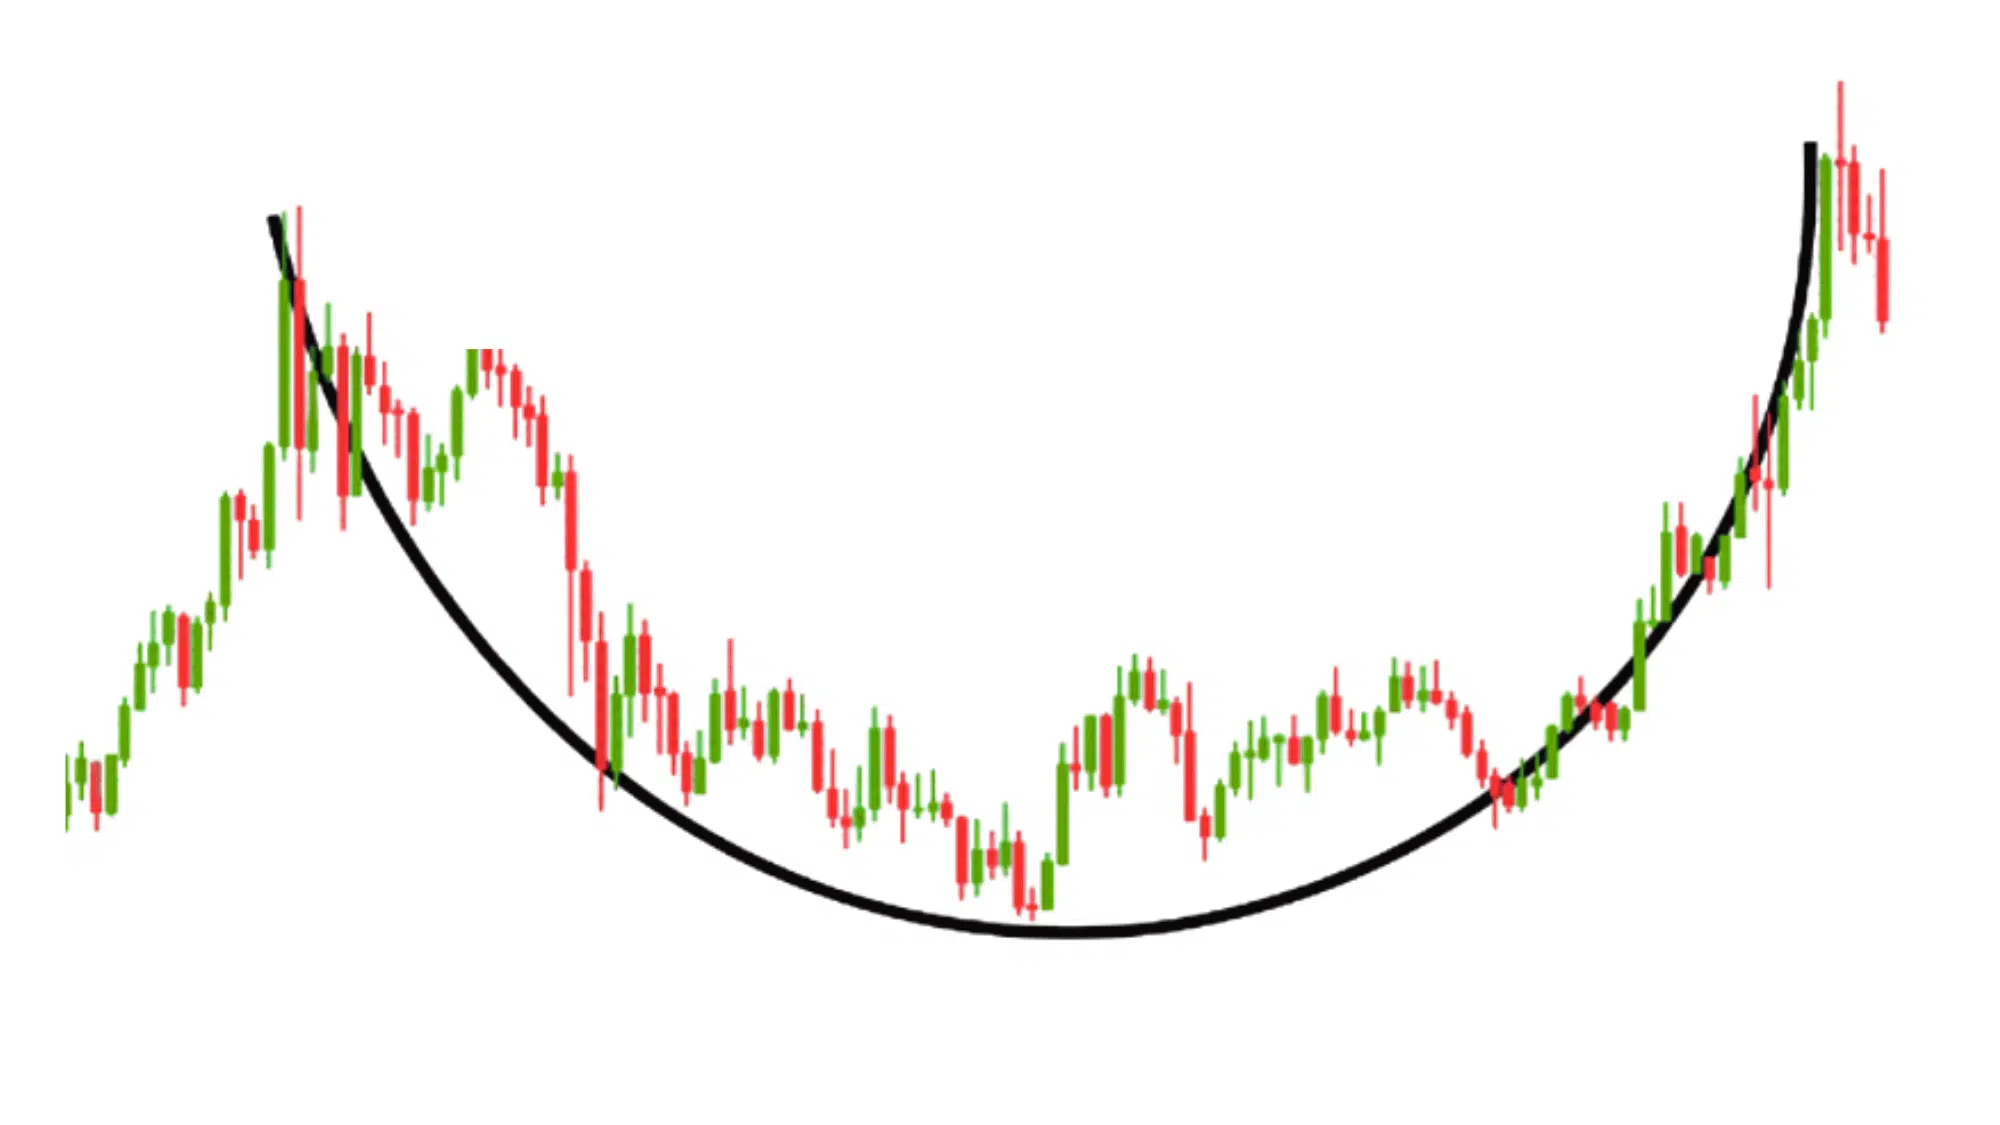
A Rounding Bottom, also known as a saucer bottom, shows a slow and steady shift from selling to buying. It forms a smooth U-shape over time, reflecting gradual recovery and renewed optimism among traders.
It often marks the end of a long downtrend and the start of a sustainable uptrend.
Key Points:
- Represents a gradual sentiment reversal.
- Strong bullish signal after long declines.
How to Identify: Spot a smooth, curved base where price slowly stops falling, flattens, and then starts rising again.
Application: Buy once price breaks above the resistance at the top of the curve. Confirm with volume increase, and place stop-loss near the curve’s midpoint.
19. Diamond Top
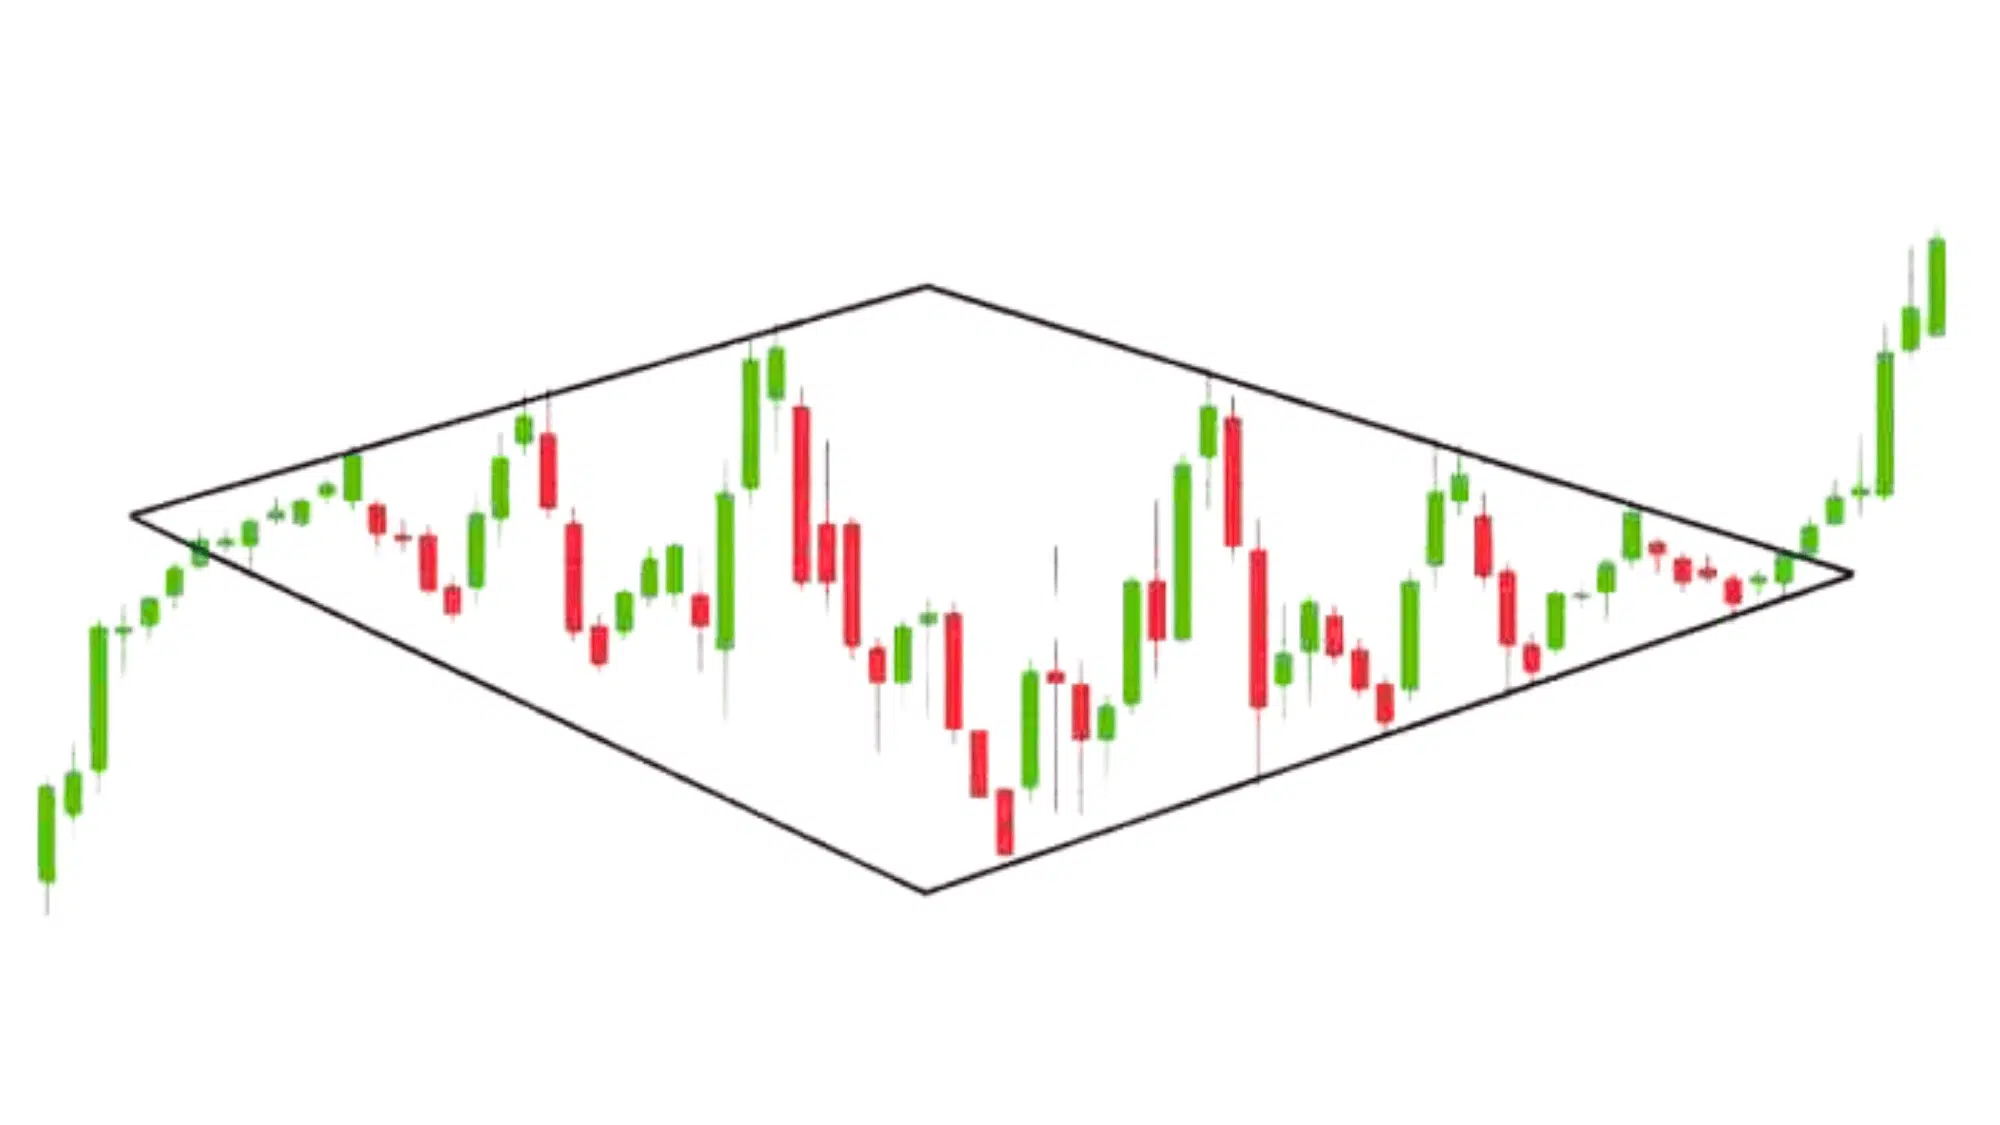
A Diamond Top is a rare bearish reversal pattern shaped like a diamond. It forms when a strong uptrend starts to lose control, volatility initially expands (broadening phase), and then contracts (contracting phase).
When the lower trendline breaks, it signals a shift from bullish to bearish sentiment.
Key Points:
- Rare but highly reliable bearish signal.
- Forms after extended uptrends.
How to Identify: Look for an expanding range followed by a contracting range of highs and lows, forming a diamond-like shape.
Application: Enter short when the price breaks below the lower trendline with strong volume. Set stop-loss above the last swing high and target the diamond’s widest height for profit.
20. Megaphone (Broadening Formation)
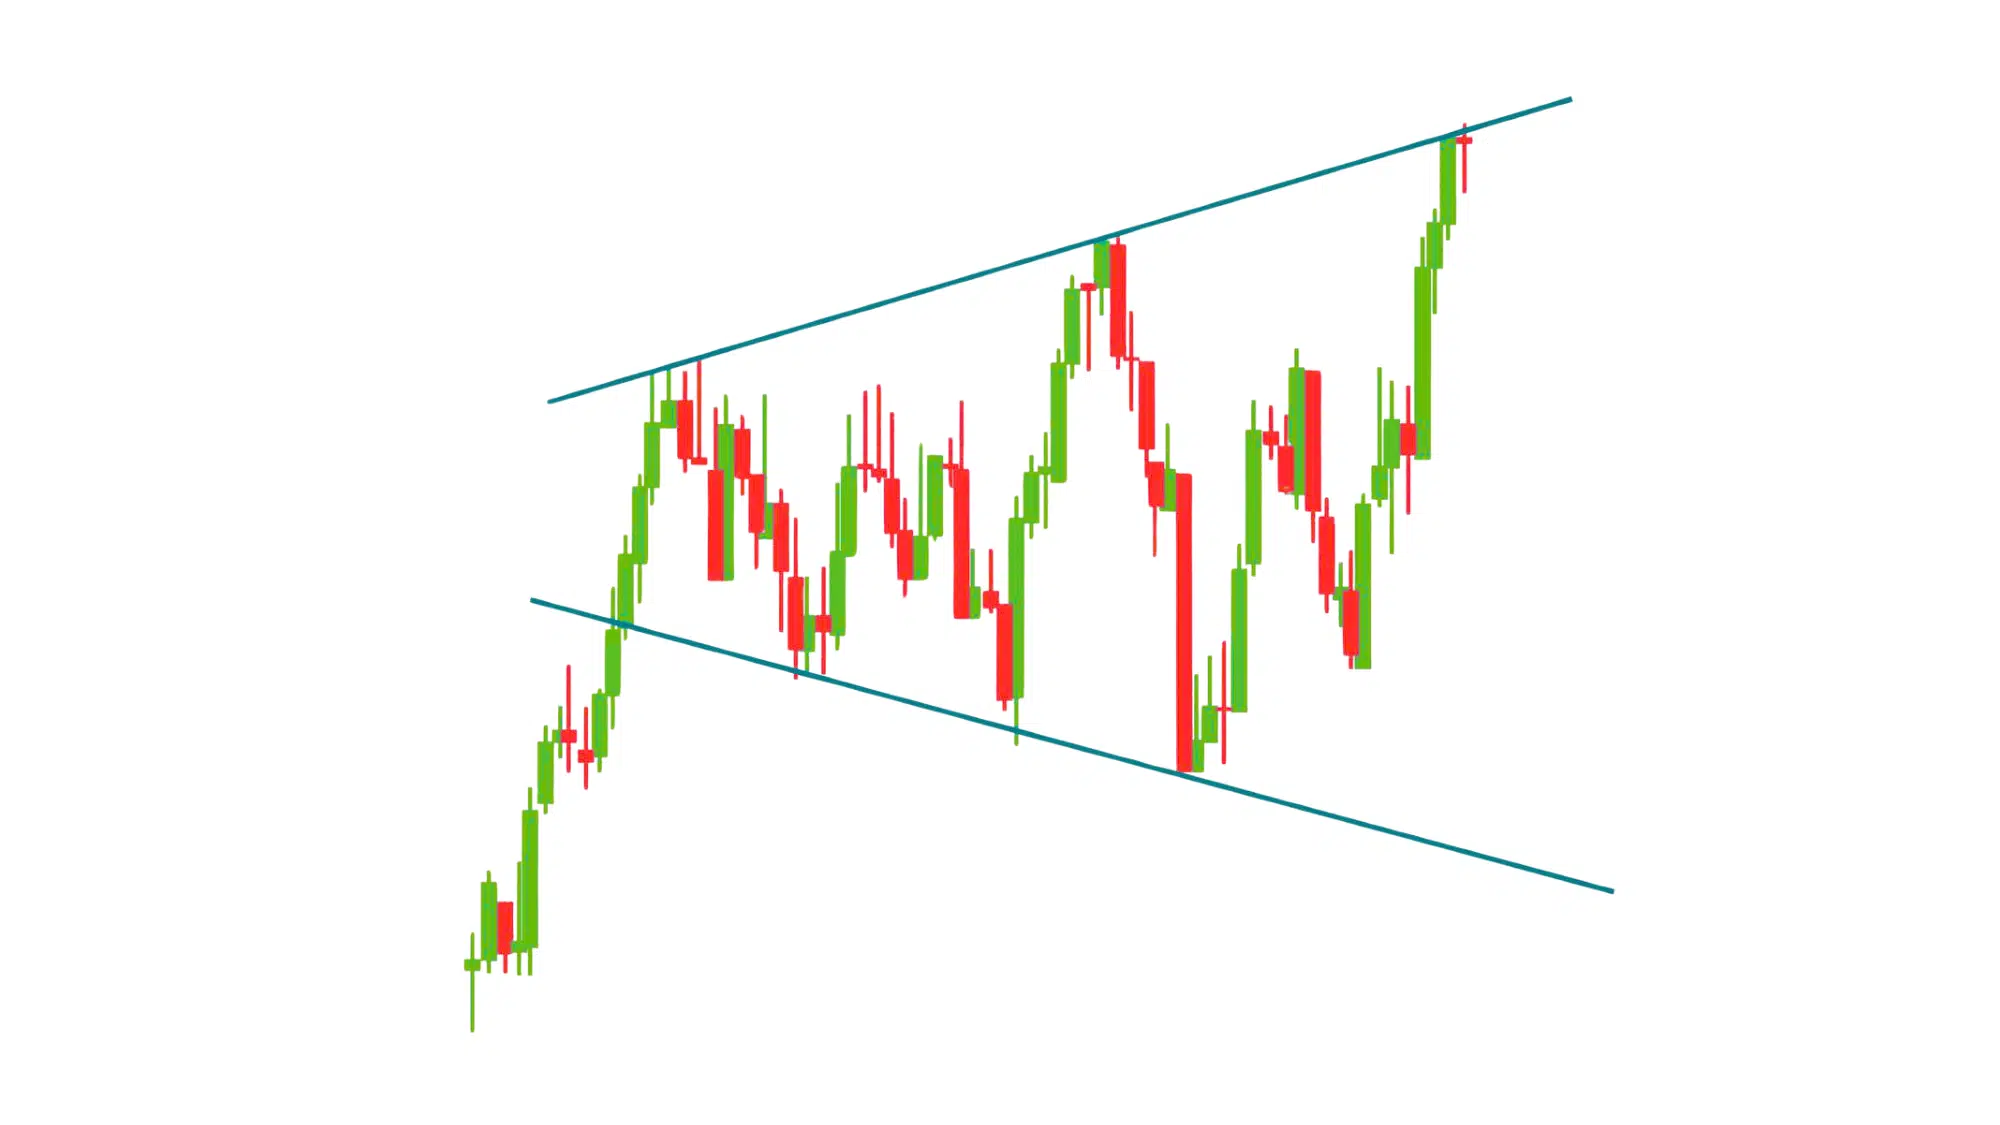
A Megaphone or Broadening Formation pattern resembles a loudspeaker; price swings become wider over time, indicating increasing volatility and uncertainty.
It forms when emotions like fear and greed drive larger price swings in both directions. Eventually, a breakout in one direction ends the chaos, leading to a strong trend move.
Key Points:
- Reflects emotional and unstable markets.
- Signals upcoming volatility and big breakouts.
How to Identify: Draw two diverging trendlines, one rising and one falling, that contain progressively larger price swings.
Application: Avoid trading inside the formation due to volatility. Wait for a confirmed breakout beyond the upper or lower line and trade in the breakout’s direction. Use the formation’s height for profit projection.
21. Descending Channel
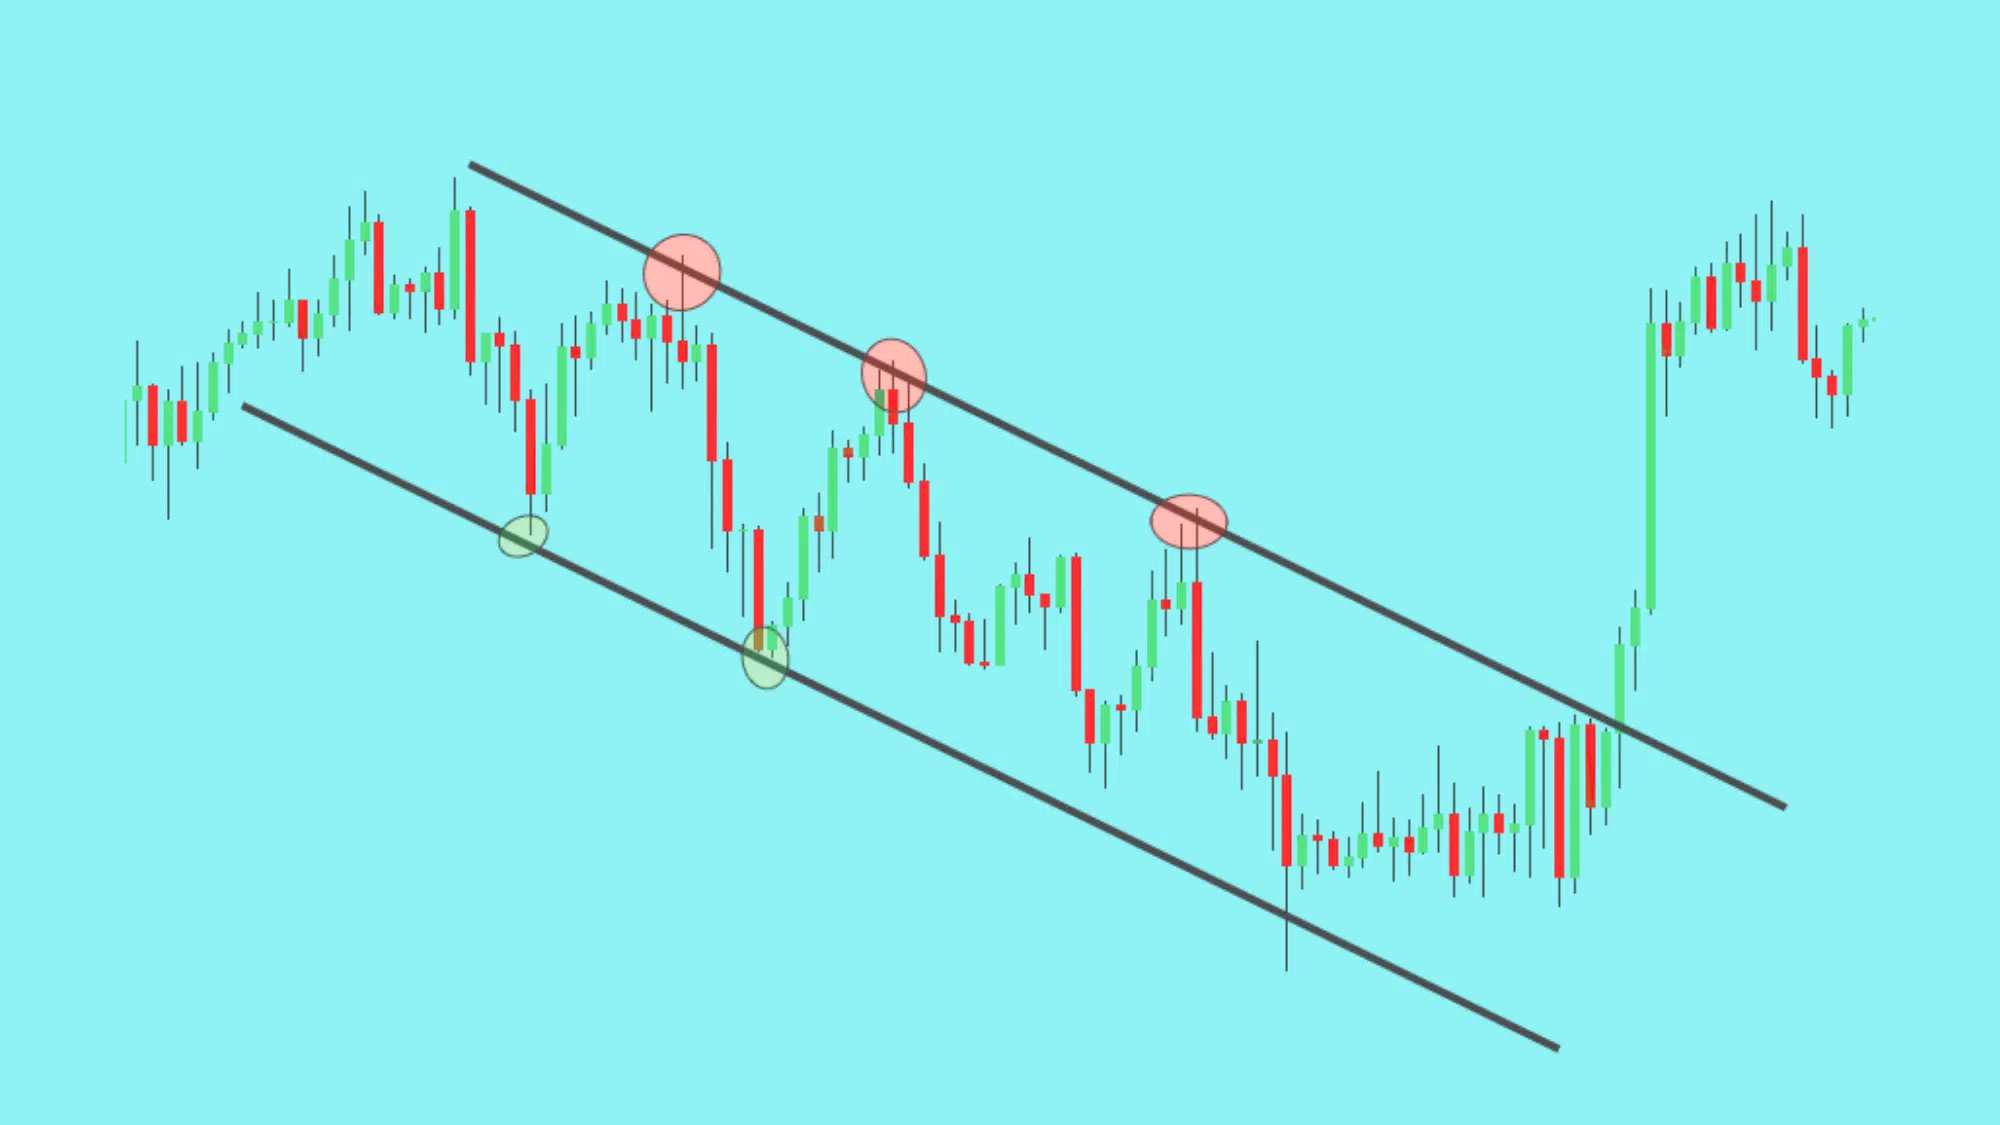
A Descending Channel, also called a Falling Channel, forms when prices move between two downward-sloping parallel lines.
Although it may appear bearish, it often signals a potential bullish reversal once the upper boundary is broken. The pattern shows steady selling pressure that weakens, indicating buyers may soon regain control.
Key Points:
- Shows controlled downtrend with lower highs and lows.
- Often leads to a bullish breakout after consolidation.
How to Identify: Draw two parallel downward-sloping lines connecting swing highs and lows that contain the entire price movement.
Application: Watch for a breakout above the upper trendline with increased volume. Enter long when confirmed, place stop-loss below the last swing low, and target a move equal to the channel’s width.
How to Use These Patterns in Real Trading
Knowing chart patterns is great, but using them correctly in real trades is where the real skill lies. Chart patterns are most effective when combined with other tools and a solid trading discipline.
Think of them as guides, not guarantees. To trade smarter and safer, here’s how to put them into practice:
| Strategy Step | Description |
|---|---|
| Combine with Indicators | Use momentum tools like RSI, MACD, or volume to confirm what the pattern suggests. A bullish breakout with rising volume is stronger than one with weak volume. |
| Wait for Confirmation | Never enter too early. Wait for the breakout candle to close beyond the pattern’s line before placing a trade. |
| Use Stop-Losses | Always set a stop-loss below the pattern for long trades or above it for short trades to avoid false breakouts. |
| Backtest Before Live Trading | Test your pattern setups on historical charts to measure accuracy, build confidence, and refine your timing. |
| Control Emotions | Don’t let fear or greed dictate decisions. Stick to your plan, follow confirmation rules, and stay disciplined under pressure. |
In short, patterns give you a powerful edge, but it’s confirmation, patience, and risk control that turn those patterns into profits.
Common Mistakes Traders When Reading Crypto Chart Patterns
Even skilled traders sometimes misread crypto chart patterns or act too quickly. These mistakes often lead to losses, not because the market was wrong, but because the trader didn’t follow a proper strategy.
Here are some common pitfalls to watch out for and avoid:
- Overtrading every pattern: Not every triangle or flag is worth trading. Jumping into every setup increases emotional stress and risk. Focus only on clear, high-confidence patterns with confirmation.
- Ignoring time frames: A pattern that looks great on a 5-minute chart can be meaningless on a daily one. Always trade patterns on reliable time frames that fit your strategy.
- Skipping confirmation: Entering before a breakout candle closes is a recipe for losses. Wait for the price to break outand close beyond the pattern with strong volume.
- Forgetting the risk/reward ratio: Many traders risk too much for too little return. Stick to a 1:2 risk-to-reward ratio or better to make your trades sustainable over time.
- Misreading consolidation as reversal: Not all sideways movements mean a reversal is coming. Learn to differentiate between healthy consolidation and actual trend changes before reacting.
Pro Tip: The best traders don’t chase every move; they wait for confirmation, respect their stop losses, and treat trading as a game of patience, not prediction.
Best Tools to Track Crypto Chart Patterns
Tracking crypto chart patterns is easier when you use the right tools. Platforms like TradingView, CryptoCompare, and Coinigy let you draw trendlines, spot triangles or flags, and set alerts for breakout signals.
TradingView is especially popular for its interactive charts, built-in indicators, and community-shared trade ideas.
These tools allow you to monitor multiple coins, analyze time frames, and even backtest strategies before risking real money.
You can also set price alerts, for example, when Bitcoin breaks resistance or Ethereum forms a bullish pennant. This saves time and helps you react quickly without needing to constantly watch the screen.
Using reliable platforms ensures you trade based on data, not emotion.
Combine their features with your trading plan and confirmations, and you’ll spot high-quality setups faster and make smarter, more confident trading decisions.
Final Thoughts
Learning crypto chart patterns takes time, but it’s worth it. Once you understand how each pattern works, you’ll start seeing the market more clearly.
I’ve learned that the goal isn’t to predict every move, it’s to recognize opportunities with good risk and solid confirmation.
Start small, practice on demo accounts, and focus on one or two patterns at a time. Over time, your confidence will grow as your accuracy improves.
Keep learning, stay consistent, and trust your process. The more patterns you understand, the better you’ll read the charts, and the smarter your trading decisions will become.
What about you? Which crypto chart pattern do you rely on most? Share your thoughts or experiences in the comments below!