
You see a strong uptrend on your chart. Prices climb higher and higher. Then suddenly, a large red candle swallows the previous green one.
That’s the bearish engulfing pattern telling you something important.
This simple two-candle formation is one of the most trusted reversal signals in trading. When it appears at the right spot with confirmation, it can help you catch major downward moves before most traders notice.
But here’s the problem: many traders jump in too early or misread the signals. They lose money on false patterns.
This guide will show you exactly how the bearish engulfing pattern forms, what it means, and how to trade it properly.
You’ll learn the psychology behind it, the best entry and exit strategies. By the end, you’ll spot valid setups with confidence.
What Is a Bearish Engulfing Candlestick Pattern?
A bearish engulfing pattern happens when a large red candle completely swallows the previous green candle on a price chart.
This pattern shows up after an uptrend and signals that sellers have taken control from buyers. The bigger the red candle, the stronger the reversal signal.
Traders watch for this pattern because it reveals a clear shift in market mood. Buyers who were pushing prices up suddenly lose strength. Sellers step in with force and drive prices down. This creates a powerful warning that the uptrend may be ending soon.
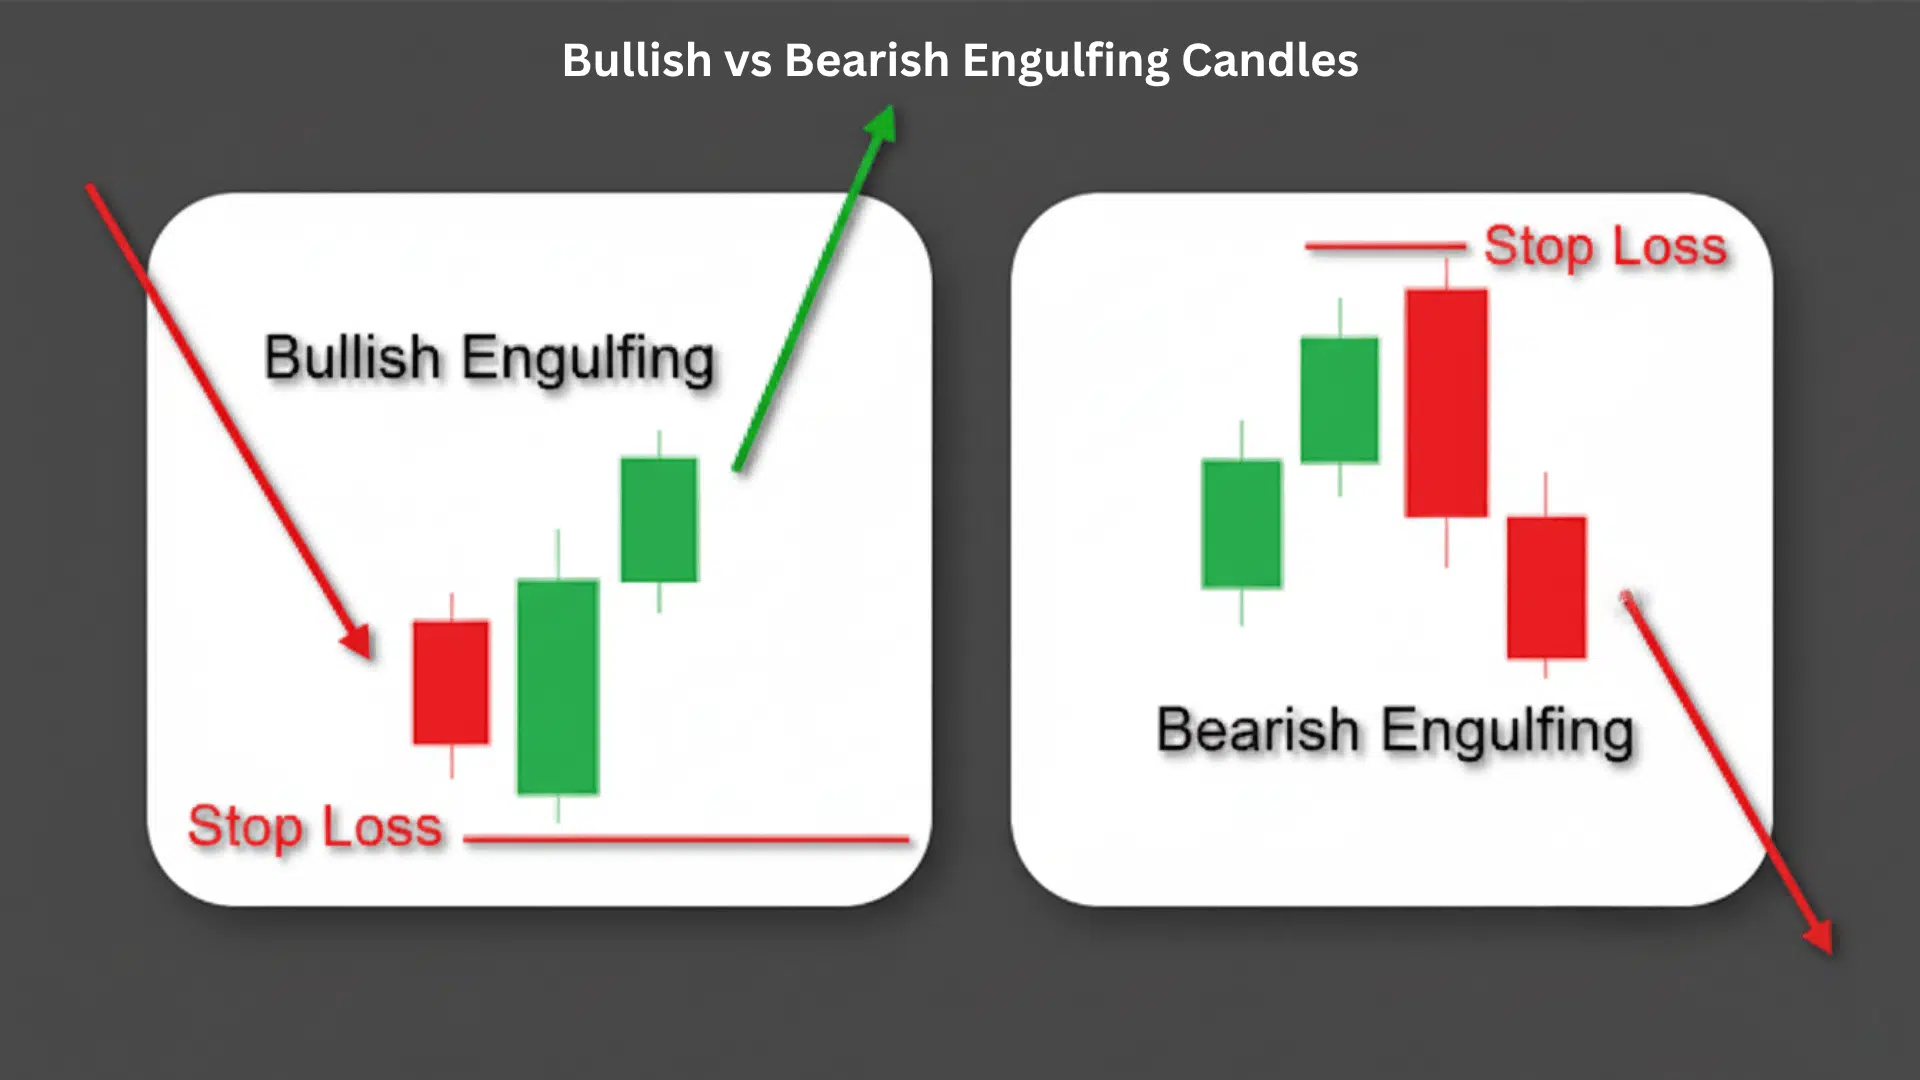
Difference Between Bullish and Bearish Engulfing Candles
| Aspect | Bearish Engulfing | Bullish Engulfing |
|---|---|---|
| Trend Context | Forms after an uptrend | Forms after a downtrend |
| First Candle | Small green (bullish) candle | Small red (bearish) candle |
| Second Candle | Large red (bearish) candle | Large green (bullish) candle |
| Body Relationship | Red candle engulfs green candle | The green candle engulfs the red candle |
| Market Sentiment | Shift from bullish to bearish | Shift from bearish to bullish |
| Signal Type | Reversal to the downside | Reversal to upside |
| Trader Action | Consider selling or shorting | Consider buying or going long |
Key Characteristics of a Bearish Engulfing Pattern
Knowing what makes a valid bearish engulfing pattern helps you avoid false signals. Here are the key features to look for every time.
- Appears at or Near Resistance Levels or Trend Peaks: The pattern carries more weight when it forms at major resistance zones where price has struggled to break through before.
- The Second Candle’s Real Body Completely Covers the First Candle’s Body: The red candle’s body must fully engulf the green candle’s body from open to close, not just the wicks or shadows.
- Often Accompanied by Higher Volume: A surge in trading volume during the bearish candle confirms that strong selling pressure is driving the reversal.
- Indicates Exhaustion of Buyers and Strength of Sellers: The pattern shows buyers have run out of energy while sellers are entering the market with force and conviction.
How Does the Bearish Engulfing Candlestick Pattern Form?
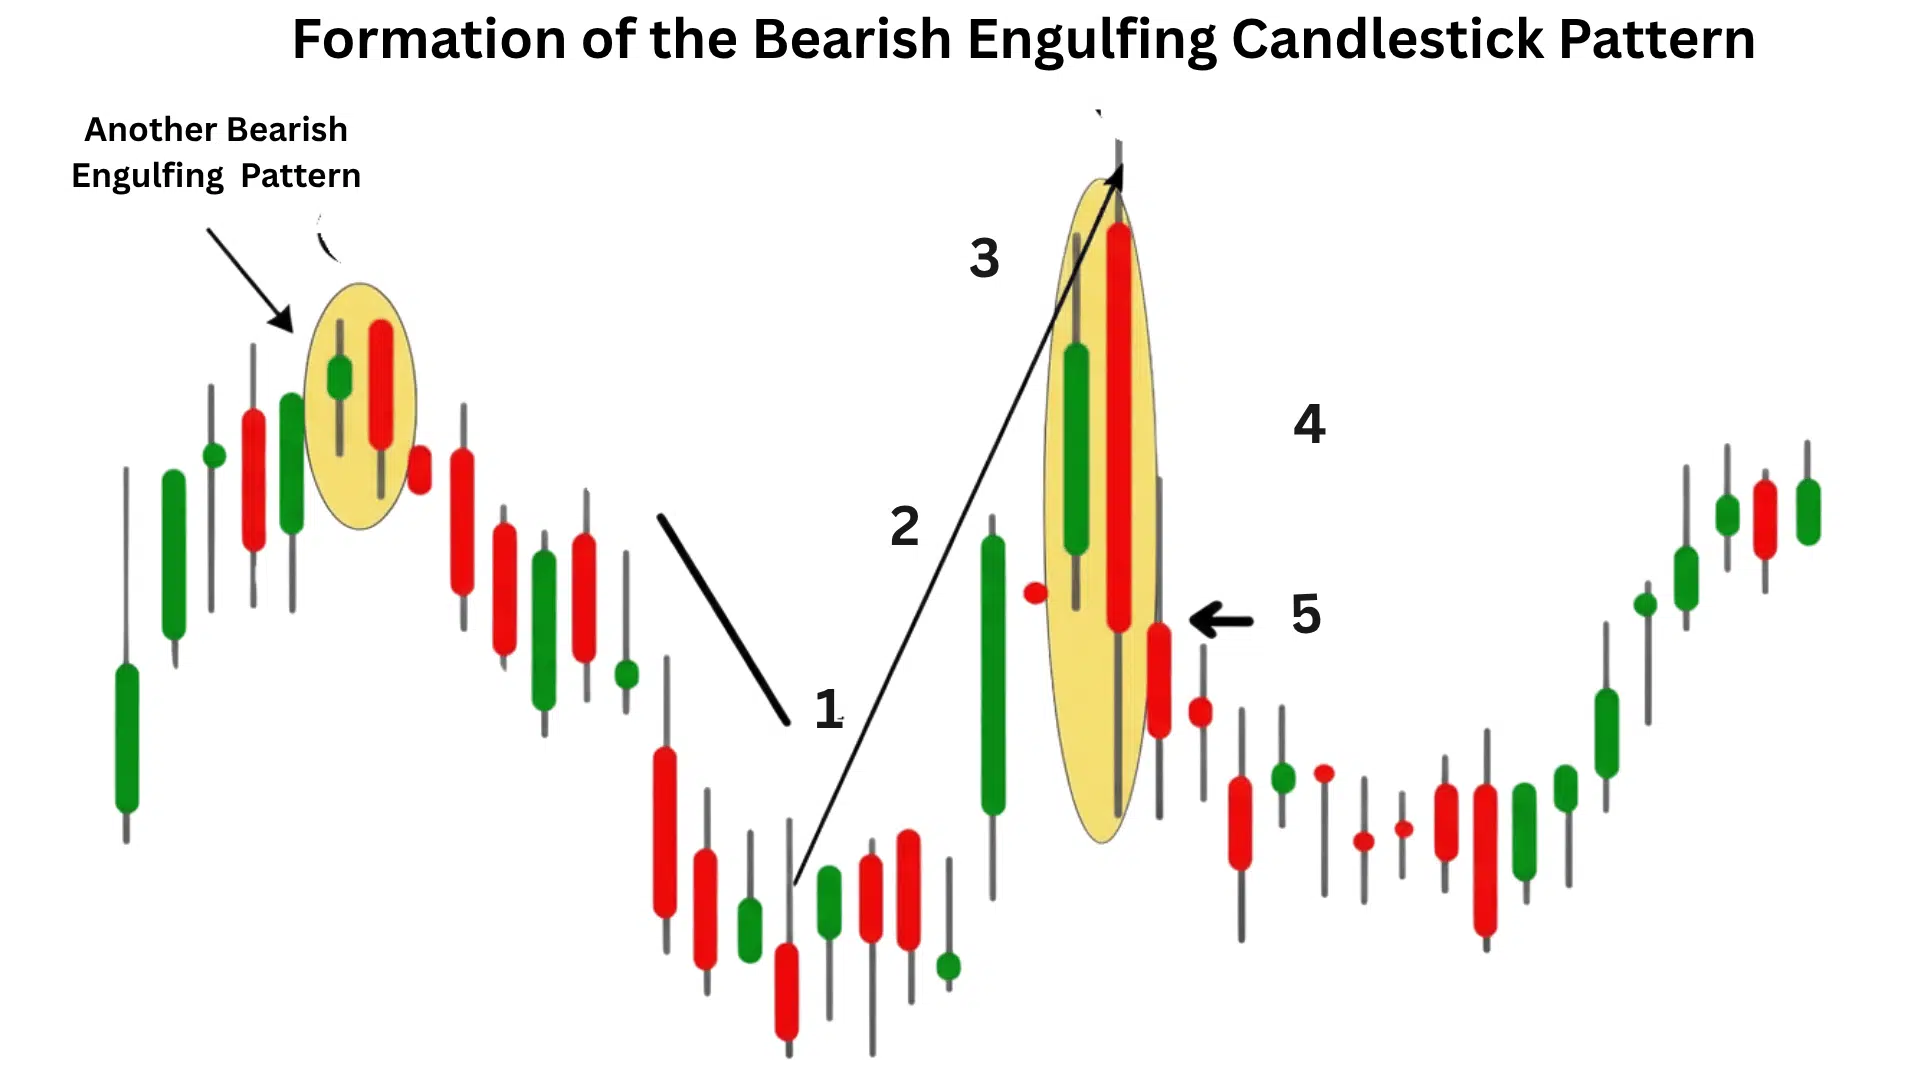
Understanding how this pattern forms helps you spot it quickly on any chart. Here’s the step-by-step process that creates a bearish engulfing signal.
Step 1: Occurs After a Uptrend or Bullish Rally
The pattern only works when prices have been climbing for some time. You need an existing uptrend for the reversal signal to be valid.
Step 2: First Candle Has a Small Bullish Body
A small green candle appears, showing buyers are still in control. This candle typically has a modest body with normal trading activity.
Step 3: Second Candle Shows a Large Bearish Body Engulfing the Previous One
The next candle opens at or above the first candle’s close but then drops sharply. This large red candle’s body must completely cover the entire body of the previous green candle.
Step 4: Closing Below the First Candle’s Opening Confirms Bearish Pressure
The red candle closes below where the green candle opened, not just below its close. This confirms that sellers have completely overpowered the previous bullish momentum.
Volume Confirmation and Trader Behavior
Higher volume on the red engulfing candle shows strong seller conviction. When volume spikes during the bearish candle, it tells you that many traders are exiting their long positions or entering short positions at the same time.
How to Identify a Valid Bearish Engulfing Pattern
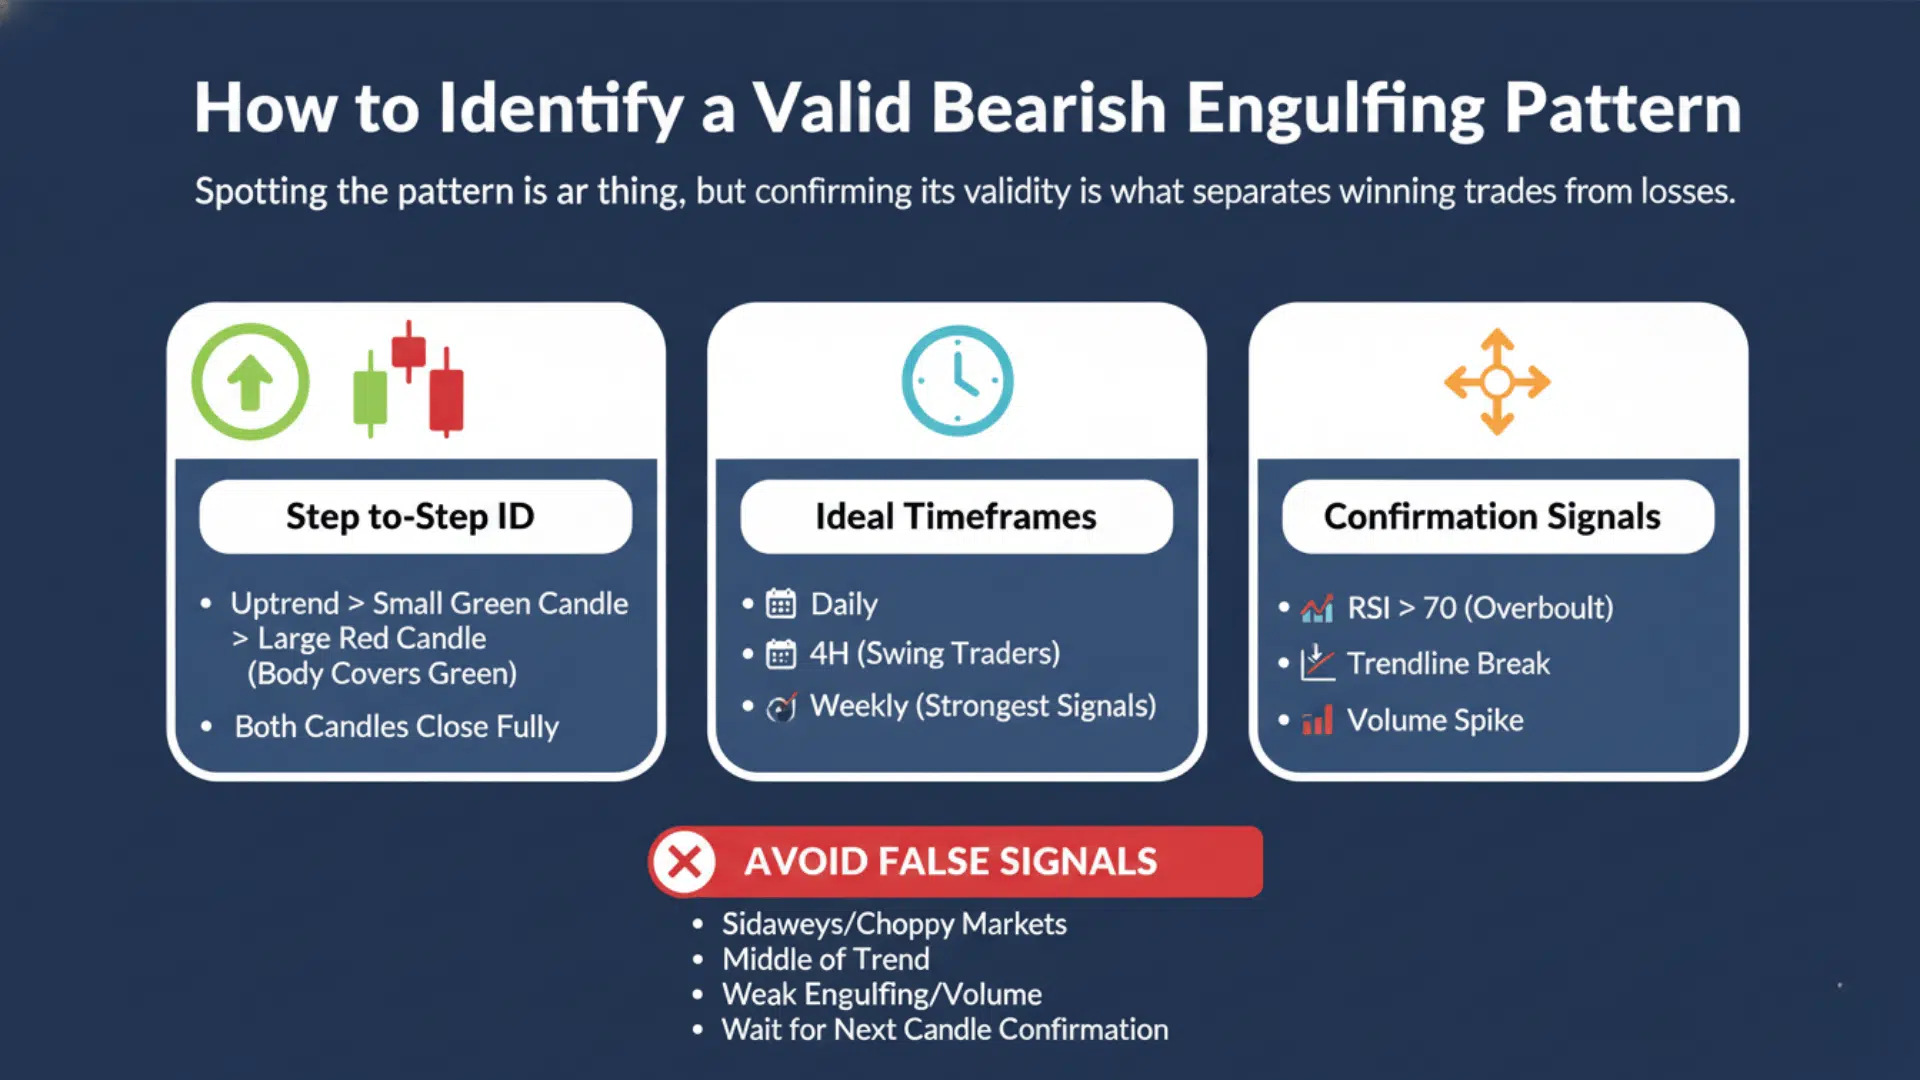
Spotting the pattern is one thing, but confirming its validity is what separates winning trades from losses. Follow these steps to identify high probability setups.
1. Step-by-Step Identification on a Price Chart
First, confirm that the price has been in an uptrend with higher highs and higher lows. Look for a small green candle followed immediately by a large red candle.
Check that the red candle’s body completely covers the green candle’s body from open to close. Make sure both candles close fully, not just partially formed.
2. Ideal Timeframes: Daily, 4H, Weekly
The pattern works best on daily charts where each candle represents a full trading day. Four-hour charts provide good signals for swing traders who hold positions for several days.
Weekly charts show the strongest and most reliable reversal signals, but they require more patience for confirmation.
3. Use of Confirmation Signals: RSI Overbought, Trendline Break, or Volume Spike
Check if RSI is above 70, showing the market is overbought and due for a pullback. Watch for the bearish candle to break below a rising trendline that supported the uptrend.
Look for volume to spike on the red engulfing candle, confirming strong selling interest. The more confirmation signals you see together, the higher your chances of success.
4. Avoiding False Signals and Low Probability Setups
Don’t trade the pattern in sideways or choppy markets where the price has no clear direction. Avoid patterns that form in the middle of a trend rather than at peaks or resistance.
Skip setups where the engulfing candle barely covers the previous candle or shows weak volume. Wait for the next candle after the pattern to confirm the downward move before entering a trade.
Pros and Cons of the Bearish Engulfing Pattern
Every trading pattern has strengths and weaknesses. Understanding both sides helps you use this pattern more effectively.
Pros
- Strong Reversal Indicator When Confirmed with Volume: When the bearish candle forms with high volume, it provides one of the most reliable signals that a trend is about to reverse.
- Easy to Identify Visually: The pattern stands out clearly on any chart, making it simple for both new and experienced traders to spot quickly.
- Works Across Multiple Markets: Stocks, Forex, Crypto: You can apply this pattern to any market that uses candlestick charts, from traditional stocks to cryptocurrencies and currency pairs.
- Useful for Short-Term and Swing Traders: The pattern works well for traders who hold positions from a few days to several weeks, providing clear entry and exit points.
Cons
- Can Generate False Signals in Ranging Markets: When the price moves sideways without a clear trend, the pattern loses its reliability and can lead to losing trades.
- Requires Confirmation for Reliability: You cannot trade the pattern blindly; you need additional signals, such as volume, RSI, or support levels, to confirm the reversal.
- Not Effective in Highly Volatile or News-Driven Conditions: During major news events or extreme volatility, the pattern can form and then immediately reverse, trapping traders on the wrong side.
- Limited Predictive Power Without Supporting Analysis: The pattern alone does not tell you how far the price will fall or how long the downtrend will last without other technical tools.
How to Trade the Bearish Engulfing Pattern
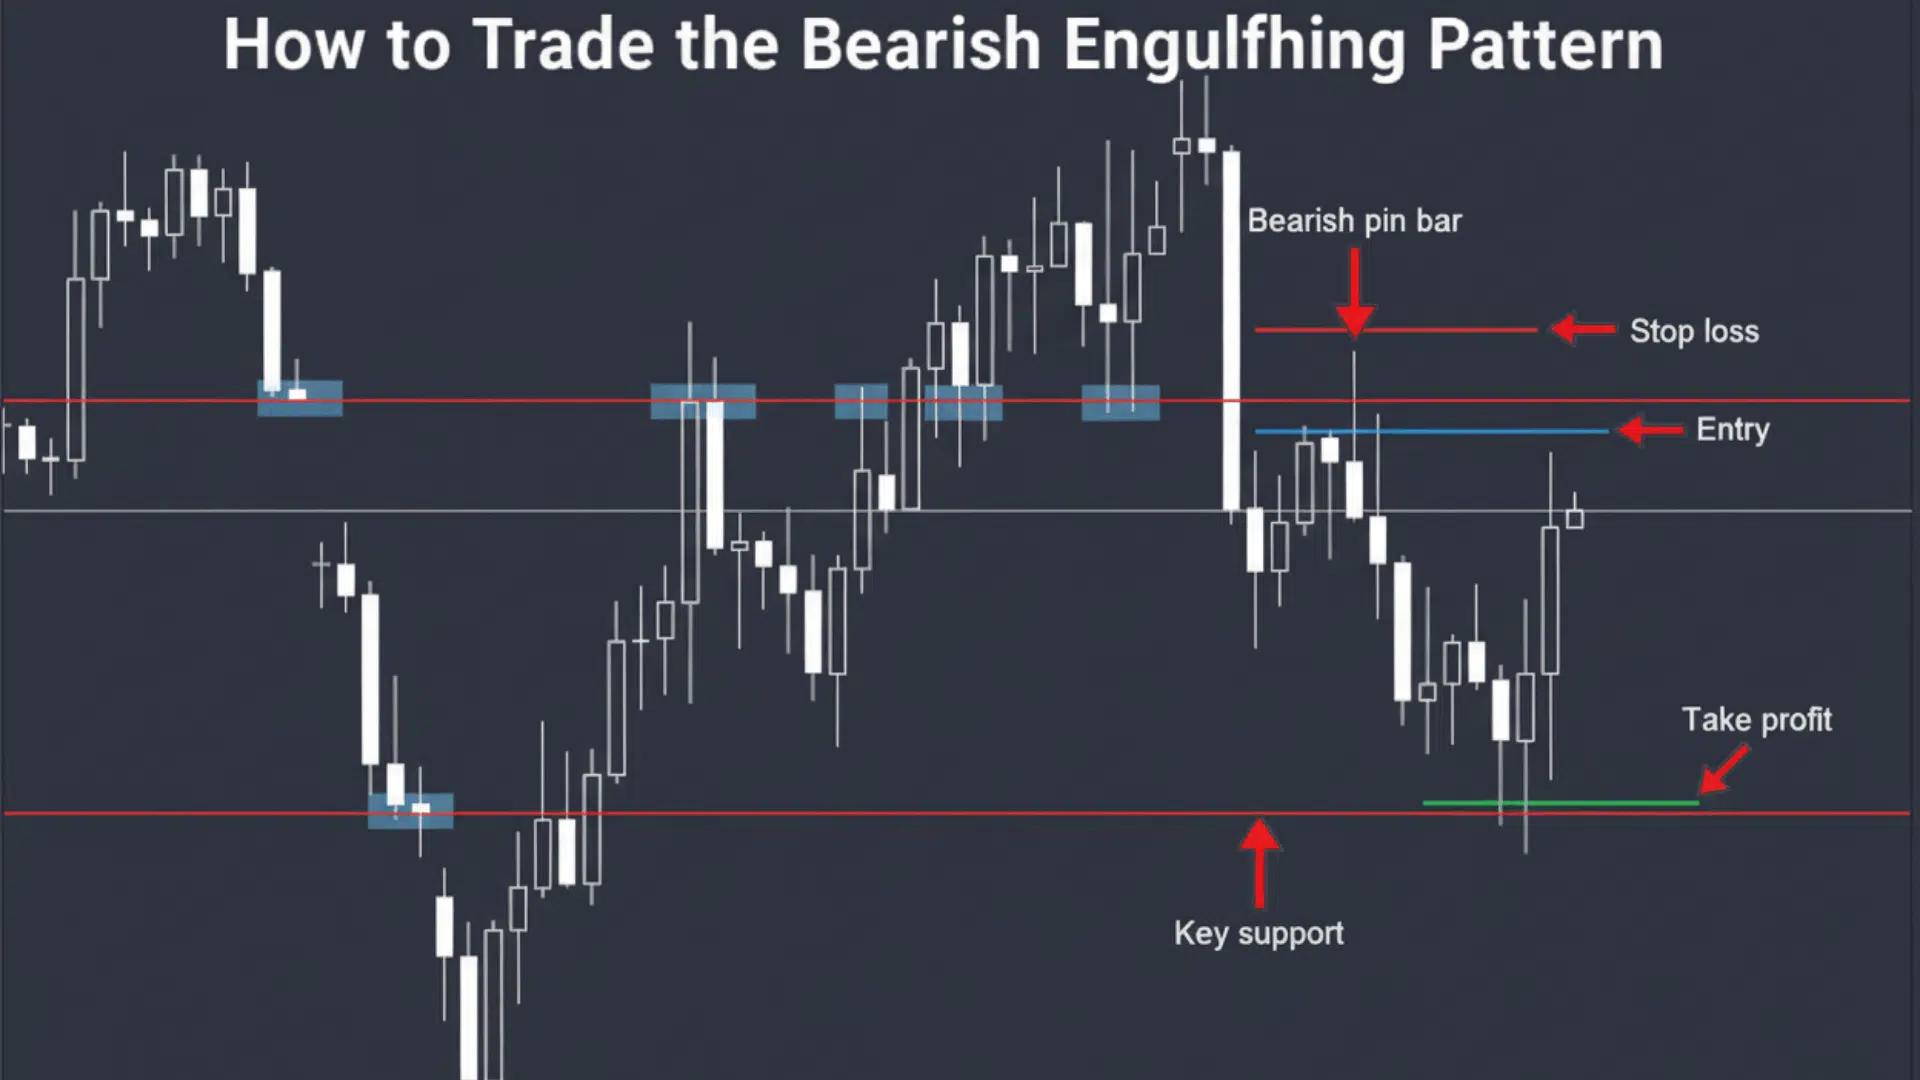
Knowing how to trade this pattern properly can make the difference between profits and losses. Here’s a complete strategy from entry to exit.
1. Entry Point: After the Pattern Closes or Upon Next Candle Confirmation
Wait for the bearish engulfing candle to close completely before making any decisions. For safer entry, watch the next candle and enter when it moves lower, confirming the downward momentum.
2. Stop Loss Placement: Above the Engulfing Candle’s High
Place your stop loss just above the highest point of the red engulfing candle. This protects you if the pattern fails and the price moves back up instead of down.
3. Profit Target: Next Support or Fibonacci Level
Set your first target at the nearest support level where buyers might step back in. Use Fibonacci retracement levels like 38.2% or 61.8% to identify logical exit points for partial profits.
4. Combine with Moving Averages or RSI for Confluence
Check if the price is trading above the 50-day or 200-day moving average when the pattern forms. Look for RSI readings above 70 to confirm overbought conditions that support the reversal signal.
5. Risk Reward Ratio and Backtesting Advice
Aim for at least a 1:2 risk-to-reward ratio, where your potential profit is twice your stop loss distance. Before trading with real money, backtest the pattern on historical charts to see how often it works in your chosen market and timeframe.
Mistakes Traders Make with the Bearish Engulfing Pattern
Even experienced traders make errors with this pattern. Here are the most common mistakes and how to fix them.
| Mistake | Why It Fails | How to Fix It |
|---|---|---|
| Entering Before Confirmation | The candle may reverse before closing | Wait for the red candle to close fully |
| Ignoring the Broader Trend | Pattern works only after uptrends | Check for an uptrend and resistance first |
| Misreading Partial Engulfing | Weak signals that often fail | Confirm that the red body covers the green body completely |
| Overtrading Without Risk Control | Multiple losses drain your account fast | Use stop losses and risk only 1 to 2% per trade |
Advanced Tips for Higher Accuracy
Take your trading to the next level with these professional techniques. These tips help filter out weak signals and boost your win rate.
- Combine with Key Resistance Zones or Supply Demand Levels: Look for bearish engulfing patterns that form right at major resistance levels where price has reversed multiple times before.
- Confirm with Momentum Oscillators: MACD, RSI: Use RSI above 70 or bearish MACD crossovers along with the pattern to confirm that momentum is shifting downward.
- Analyze with Multiple Timeframes for Stronger Signals: Check if the pattern appears on both daily and weekly charts at the same time for a much stronger reversal signal.
- Use Trailing Stops to Lock in Profits: Move your stop loss down as the price falls to protect your gains while letting winning trades run further.
Real Market Examples of Bearish Engulfing
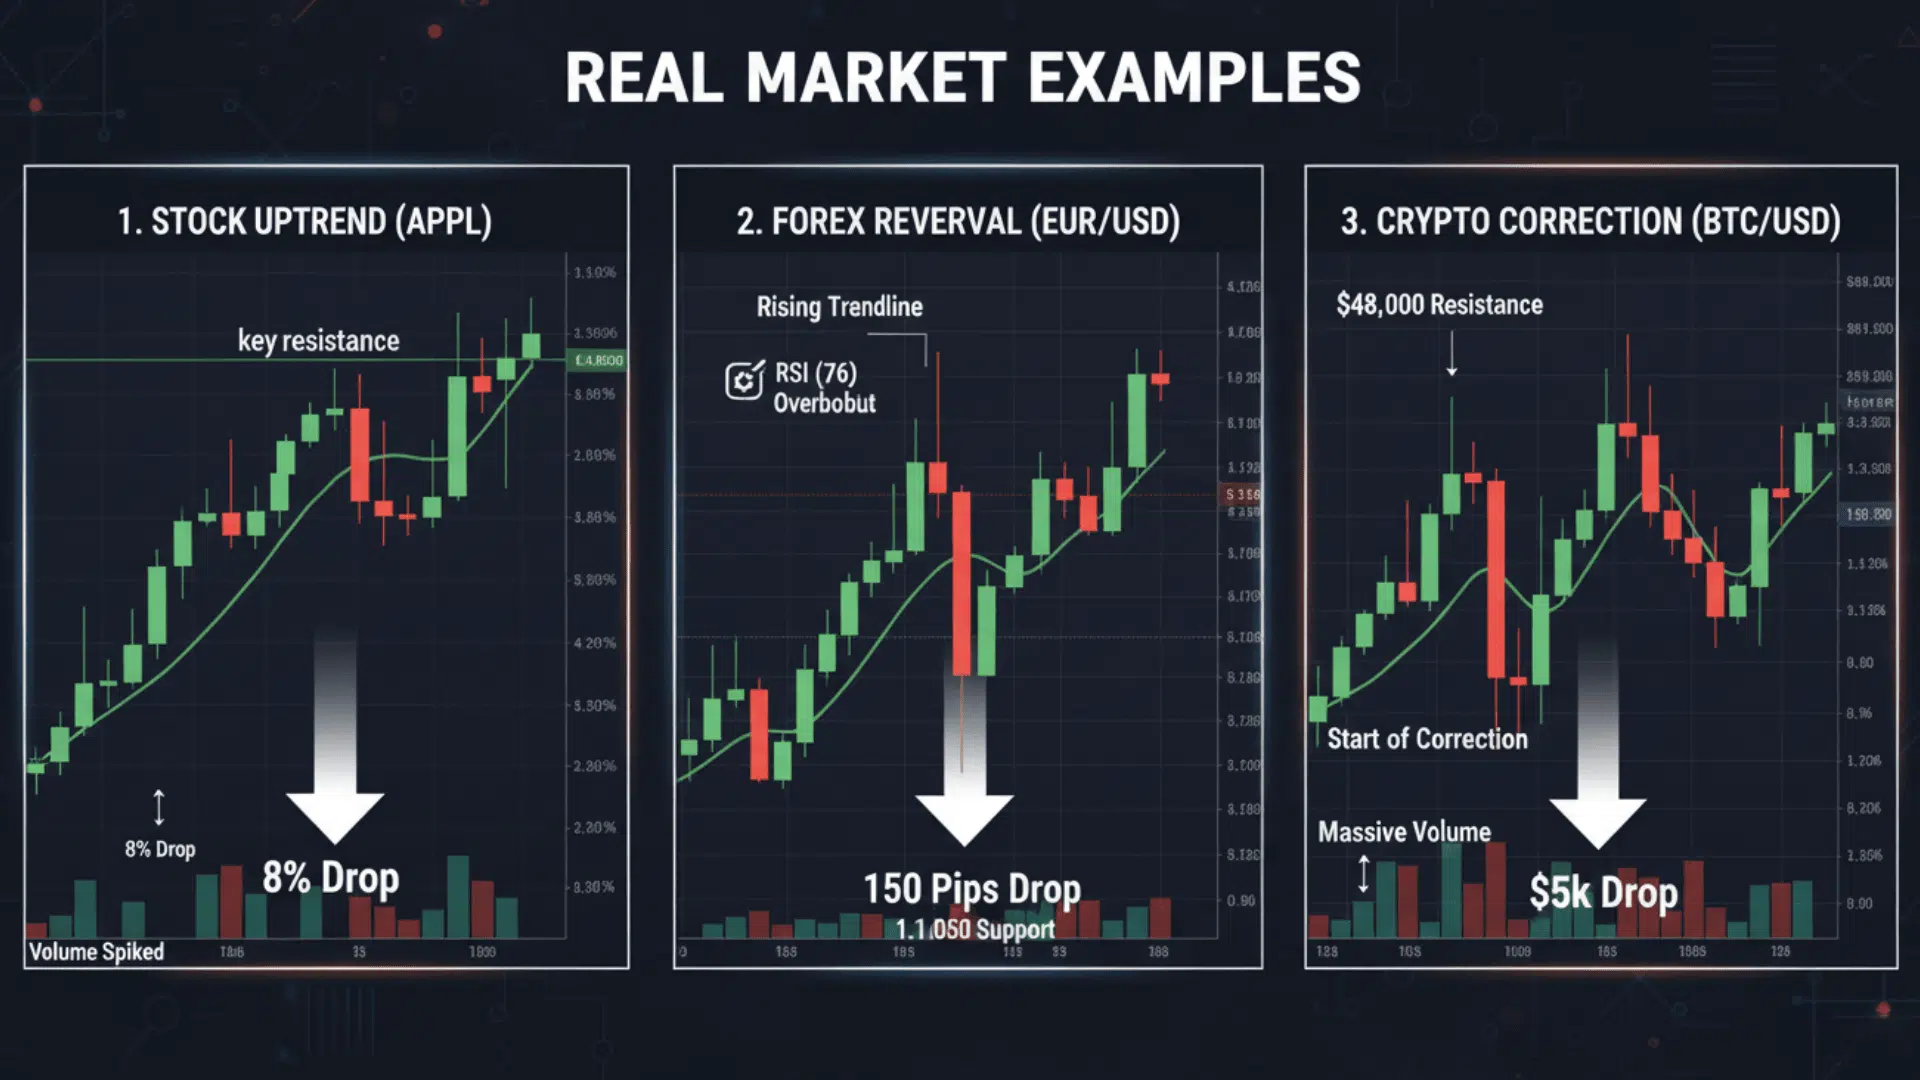
Seeing the pattern in action helps you recognize it faster in live markets. Here are three real-world scenarios across different asset classes.
Example 1: Bearish Engulfing in a Stock Uptrend
Apple stock climbed steadily for three weeks, reaching a key resistance level near its all-time high. A small green candle formed showing continued buyer interest.
The next day, a large red candle opened higher but closed well below the previous candle’s open, completely engulfing it. Volume spiked to twice the average, confirming strong selling pressure.
Over the next two weeks, the stock dropped 8% before finding support.
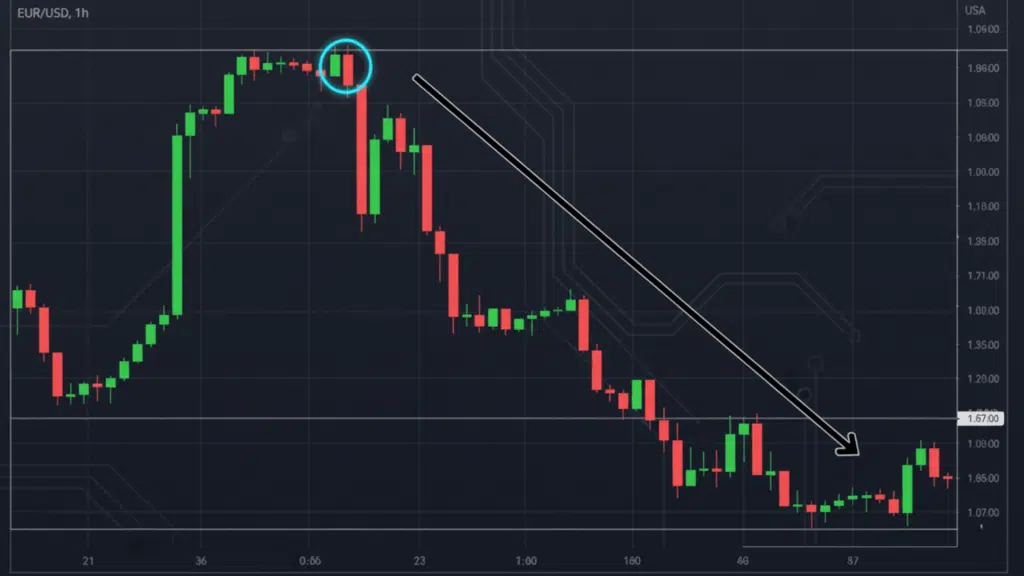
Example 2: Forex Market Scenario Showing Trend Reversal
The EUR/USD pair rallied for five days straight, gaining over 200 pips. At a major resistance zone of 1.1200, a bearish engulfing pattern appeared on the 4-hour chart.
The red candle formed with strong volume and broke below the rising trendline. RSI showed overbought at 76, adding confirmation to the analysis.
Traders who entered short made 150 pips as the pair reversed down to 1.1050 support.
Example 3: Crypto Market Pattern During Correction Phase
Bitcoin surged from $40,000 to $48,000 in just ten days during a bull run. Near the psychological resistance of $48,000, a bearish engulfing pattern formed on the daily chart.
The red candle engulfed not just one but two previous green candles with massive volume. Within 48 hours, Bitcoin dropped to $43,000 as traders took profits. This pattern marked the start of a two-week correction phase.
The Bottom Line
The bearish engulfing pattern is a powerful tool when used correctly. You now know how it forms, what drives the psychology behind it, and how to trade it with proper risk management.
Remember these key points: wait for confirmation, check the trend context, use volume to validate signals, and always place your stop loss above the engulfing candle’s high.
Don’t rush into every pattern you see. The best setups appear at resistance levels, where multiple confirmation signals work together.
Start practicing on demo charts before risking real money. Mark past examples on your favorite stocks, forex pairs, or crypto charts. Study what worked and what didn’t.
The more you practice, the sharper your eye becomes.
What’s your experience with bearish engulfing patterns? Share your wins or losses in the comments below.