If you spend time studying charts, you’ve probably noticed a candle with a tiny body and a long lower wick. That’s called a hammer, and it often shows up when a market is trying to bounce back after a drop.
But sometimes, that hammer is red instead of green, and that small detail can make a big difference in how you read the setup.
In this post, I’ll walk you through what a red hammer candlestick really means, how it forms, and how you can trade it wisely. By the end, you’ll know when it signals a real shift and when it’s better to wait for proof.
What Is a Hammer Candlestick?
A hammer forms when the price drops sharply but then rebounds before the candle closes.
It has:
- A small real body near the top
- A long lower shadow (at least twice the size of the body)
- Little or no upper shadow
This shape tells you that sellers pushed prices down, but buyers stepped in and forced them back up. It often hints that selling pressure is slowing.
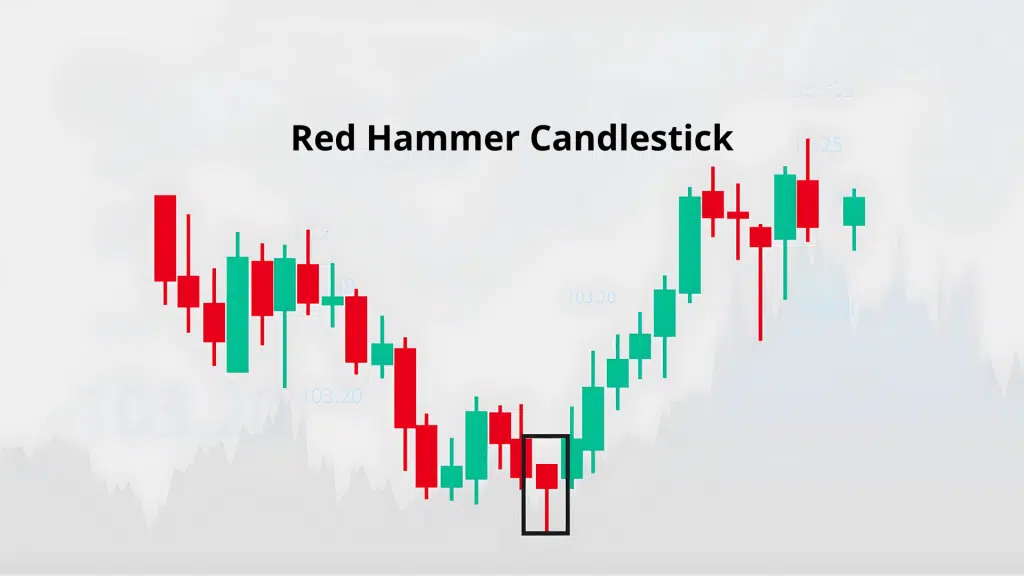
What Is a Red Hammer Candlestick?
A red hammer has the same shape as a regular hammer but closes slightly below its open. That’s why the body is red. Even though it looks bearish, the structure itself can still suggest a shift in control from sellers to buyers.
The key point is the location; a red hammer is meaningful only after a clear downtrend. It shows buyers are starting to fight back, even if they didn’t win that session.
How the Red Hammer Forms
Here’s what usually happens:
- Sellers push the price down during the session.
- Buyers enter at lower levels, driving the price back up.
- The candle closes below the open but well above the low.
This tug-of-war leaves behind a long lower wick, showing that buyers absorbed the selling pressure.
How to Identify a Valid Red Hammer
Here’s a simple way to recognize one:
- Look for a candle with a small red body near the top of the range.
- The lower shadow should be at least twice the body’s length.
- The upper shadow should be short or missing.
- The close should be near the high, even if it’s below the open.
- The candle should appear after a clear downtrend, not in sideways movement.
- It’s more dependable if it forms near support or a demand zone.
- Watch for a follow-up candle that closes above the hammer’s high to confirm the signal.
Quick checklist:
- Trend: Downtrend before the hammer
- Body: Small and red
- Lower shadow: Long (at least 2× the body)
- Upper shadow: None or very short
- Location: Near support or demand area
- Confirmation: Next candle closes above the hammer’s high
Red Hammer vs. Similar Patterns
Candlestick patterns can look alike, but their meaning depends on where they appear and what the price is doing before them. Here’s how to tell a red hammer apart from other similar candles.
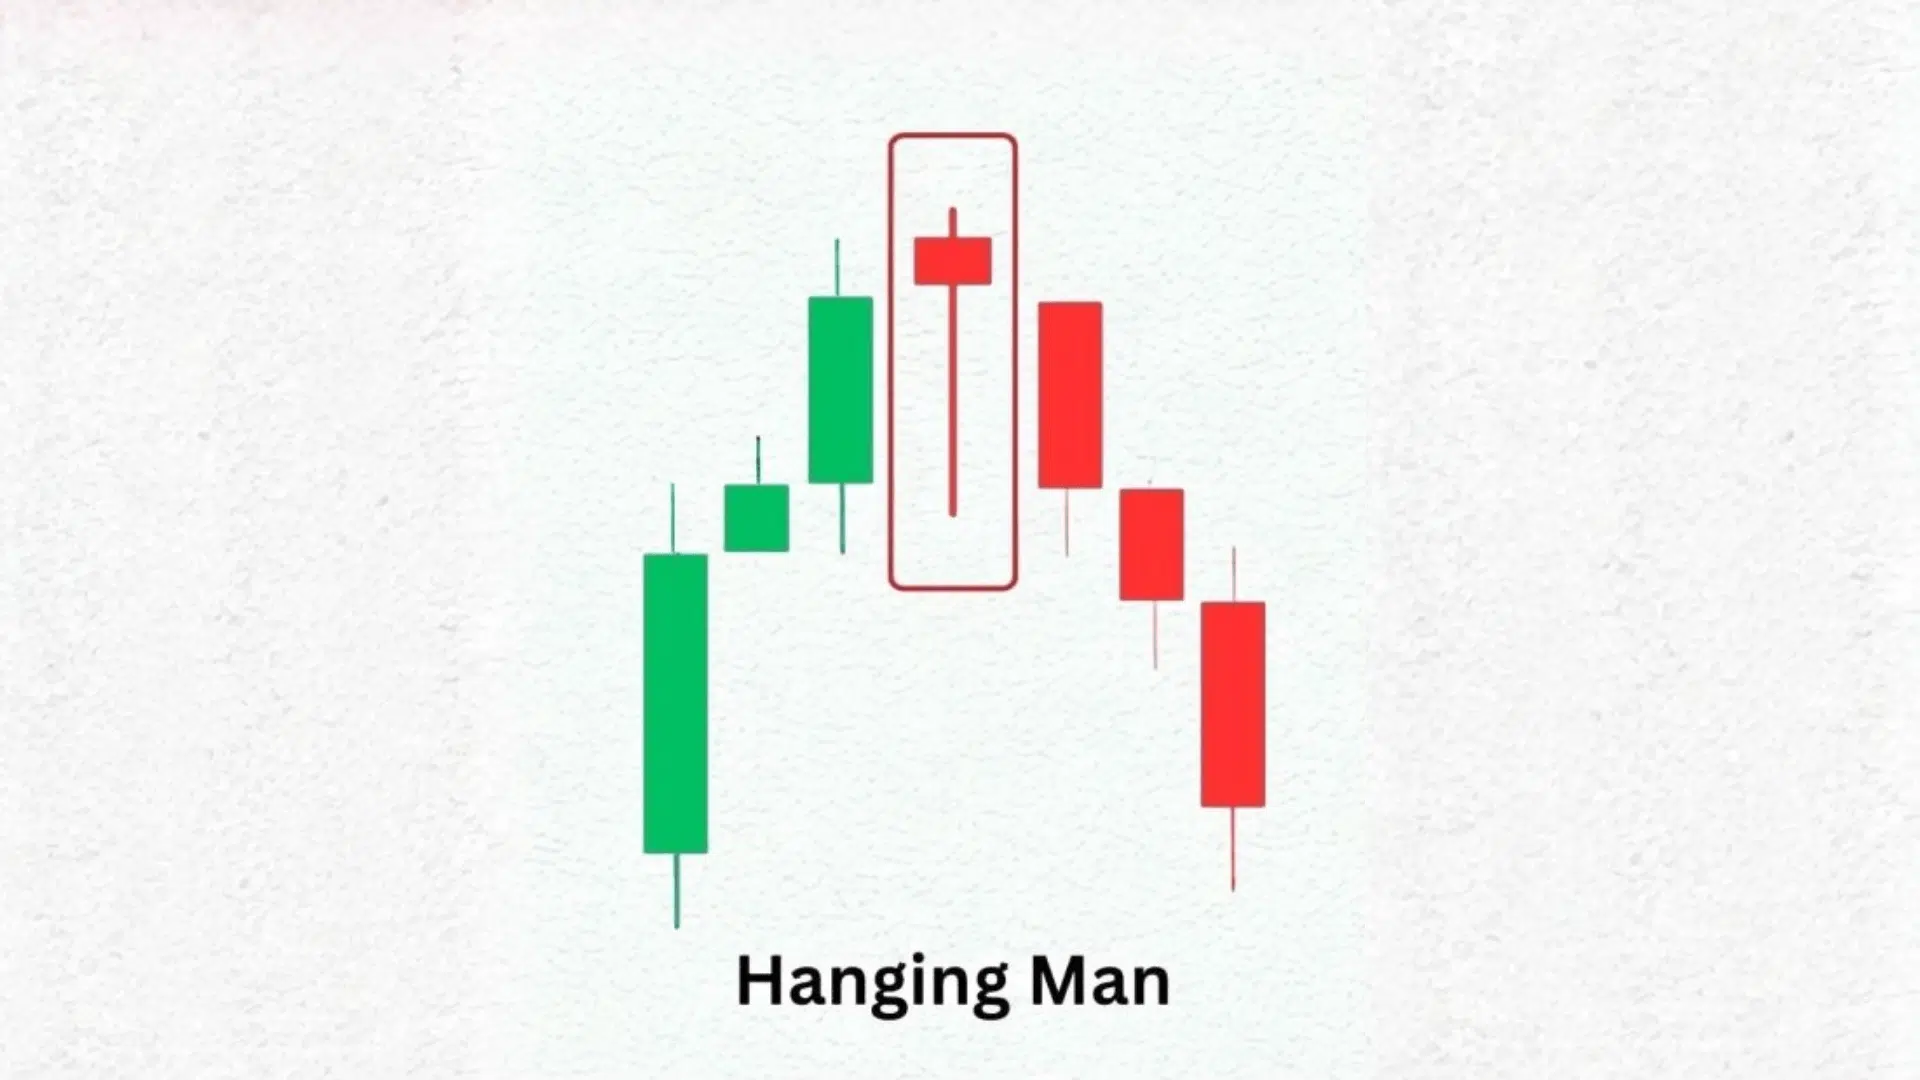
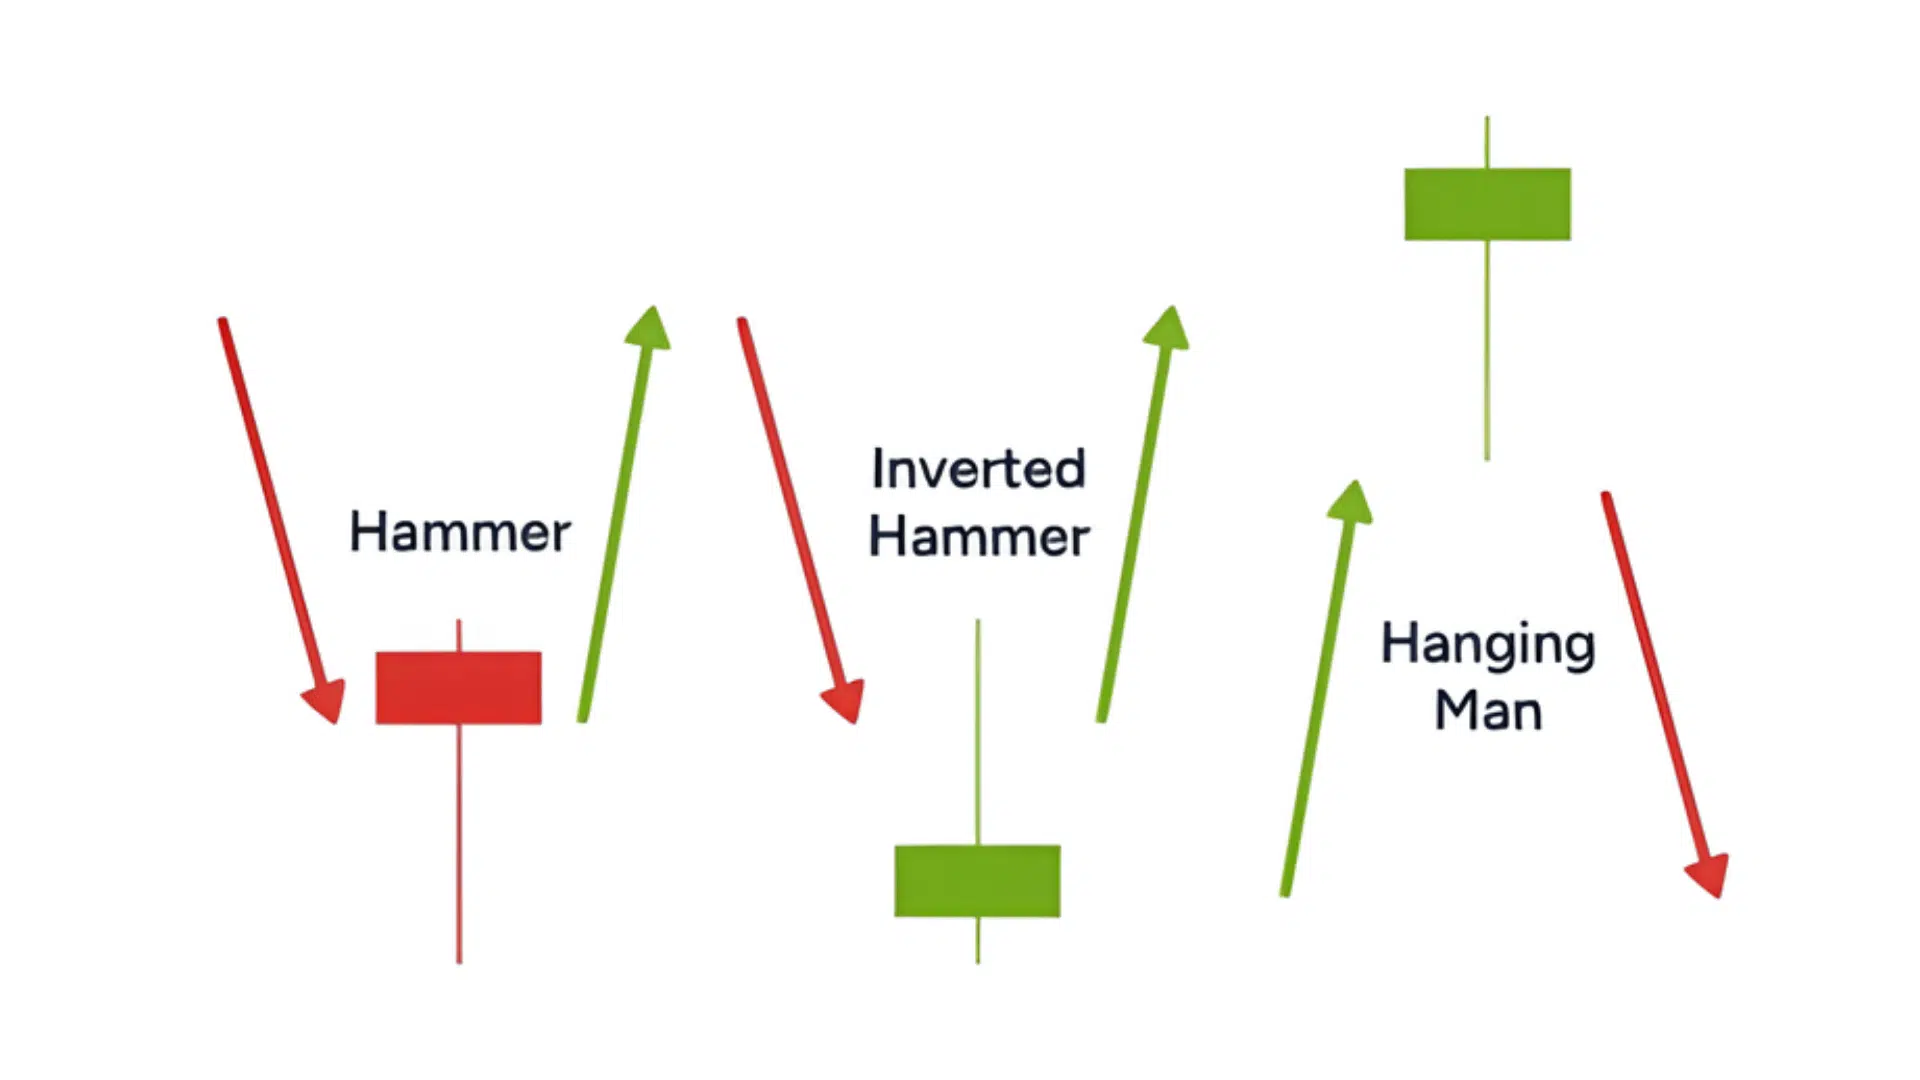
1. Red Hammer vs. Hanging Man
Both the red hammer and hanging man have long lower shadows and small bodies, but the trend direction makes the difference.
- A red hammer appears after a downtrend. It signals that sellers are losing strength and buyers are stepping in.
- A hanging man appears after an uptrend. It warns that the uptrend may be slowing down as sellers start to take profit.
If the same candle forms near a market bottom, it’s called a hammer. If it forms at the top, it’s a hanging man. Always check the trend before deciding which one you’re seeing.
2. Red Hammer vs. Inverted Hammer
An inverted hammer has the opposite shape. It shows a long upper shadow and a small body near the bottom of the range.
- An inverted hammer forms after a downtrend and can also hint at a possible reversal.
- It tells you buyers tried to push prices up but couldn’t hold them. If the next candle closes higher, it confirms their strength.
The red hammer, on the other hand, shows that buyers pushed prices up from much lower levels during the same session. It’s a sign of buying from the lows rather than rejection from the highs.
3. Red Hammer vs. Green Hammer
Both hammers show the same market idea, that buyers are fighting back after a decline, but color adds a small difference.
- A green hammer closes above its open, showing buyers ended the session in control.
- A red hammer closes below its open, showing buyers made progress but didn’t completely turn the session around.
Because of that, the green hammer is seen as a stronger sign of immediate buying pressure. The red hammer still matters, but it usually needs extra confirmation from the next candle or a rise in volume.
How to Trade a Red Hammer Candlestick
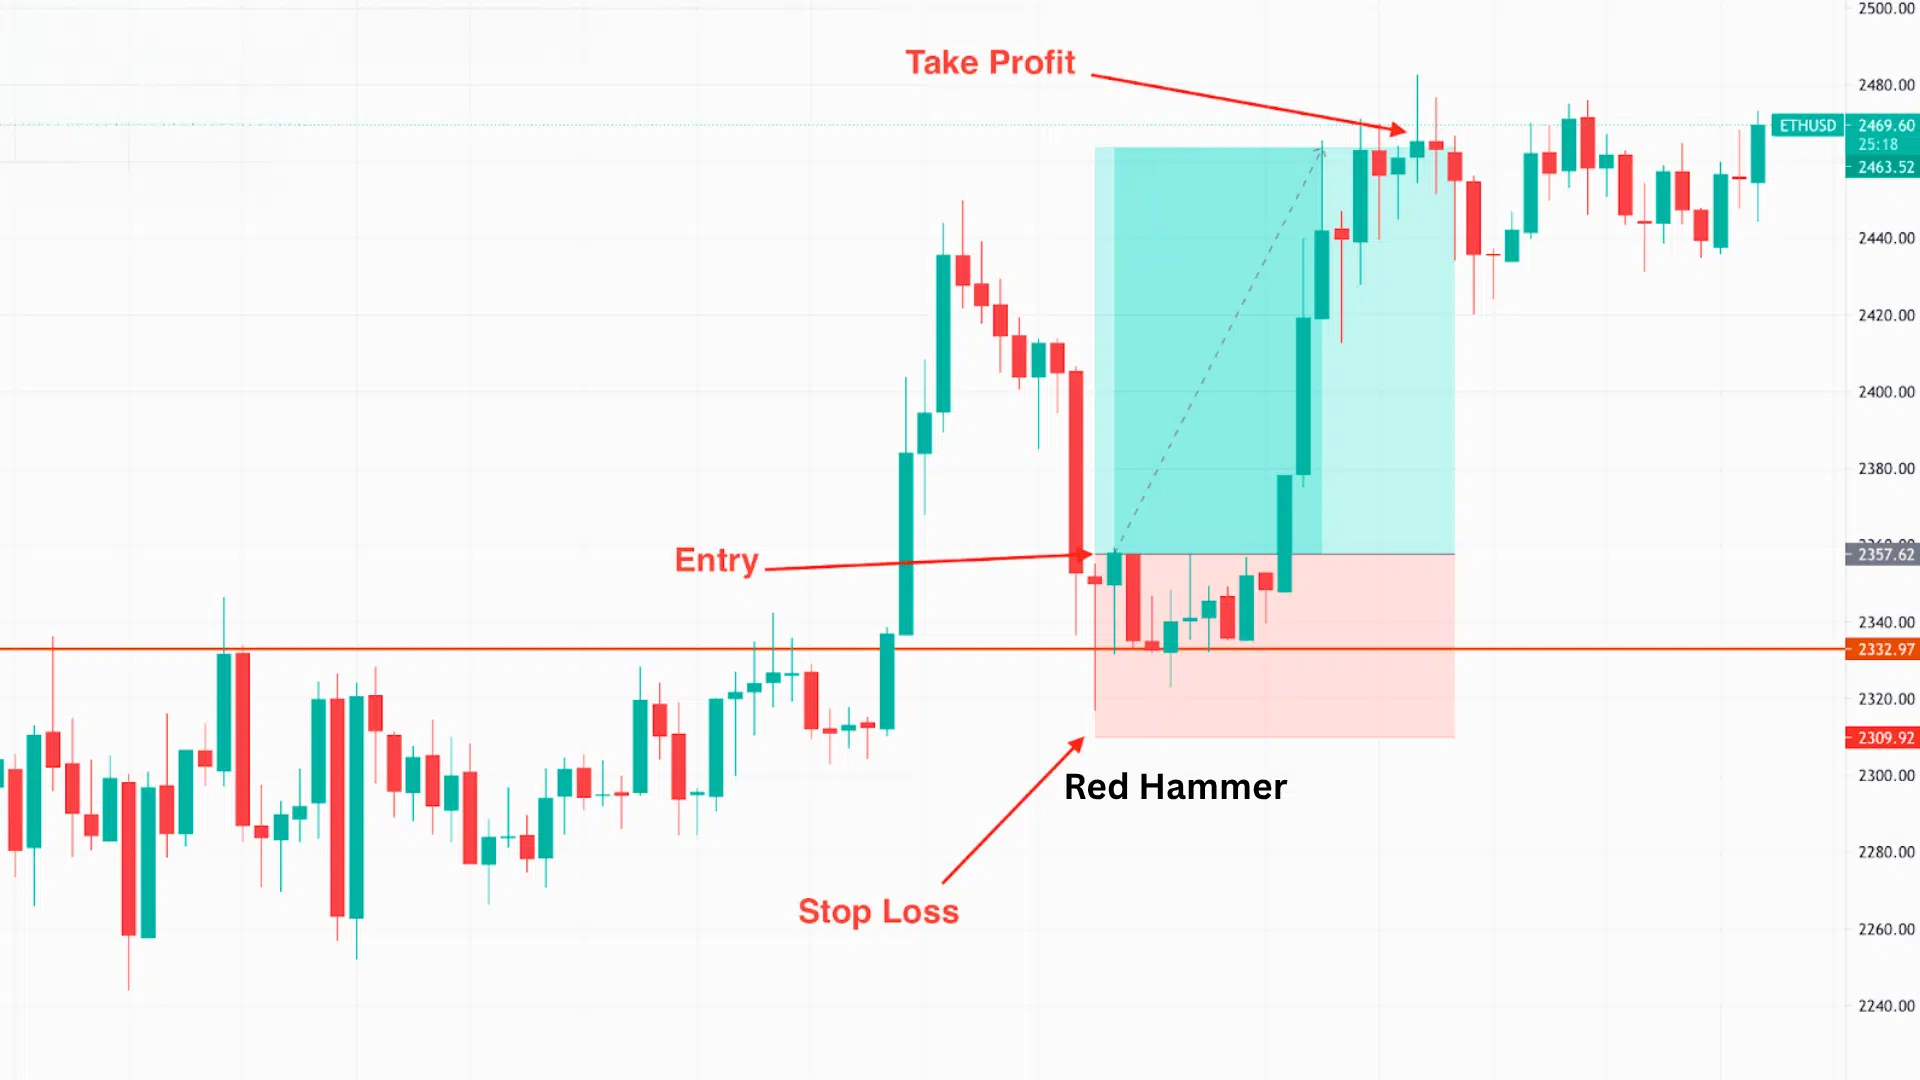
Once you spot a red hammer, you still need to confirm it and plan your trade carefully. Here’s how to do it step by step.
Step 1: Wait for Confirmation. Don’t jump in as soon as the hammer appears. Wait for the next candle to close above the hammer’s high.
That move confirms that buyers are stepping in, and the trend may be shifting. Entering too early can lead to false signals, so let the market prove the setup first.
Step 2: Plan Entry and Stop. Once confirmation appears, set your entry slightly above the hammer’s high.
Place your stop-loss just below the hammer’s low to protect your position if the price turns down again. This keeps your risk small and gives the trade a clear invalidation point.
Step 3: Set a Target. Aim for a logical price zone, such as a prior resistance level or the last swing high.
You can also use a simple risk–reward ratio like 1:2 or 1:3. If momentum stays strong, you can trail your stop to lock in profits while giving the trade room to grow.
When the Red Hammer Fails
No pattern works every time. The red hammer can fail when:
- It appears within a sideways market (no trend).
- It forms below resistance instead of support.
- There’s no confirmation the next day.
If the next candle closes below the hammer’s low, the signal is invalid. Always stick to your stop-loss.
Where It Works Best
The red hammer shows up in all markets, stocks, forex, crypto, and commodities. It’s most reliable on higher timeframes like daily or 4-hour charts.
Intraday traders can use it too, but should match it with volume and trend context.
Red Hammer Candle Trading Examples
Seeing real setups helps you understand how the red hammer works in live markets. Here are a few examples that show how to spot, confirm, and manage the trade.
Example 1: Stock Reversal at Support
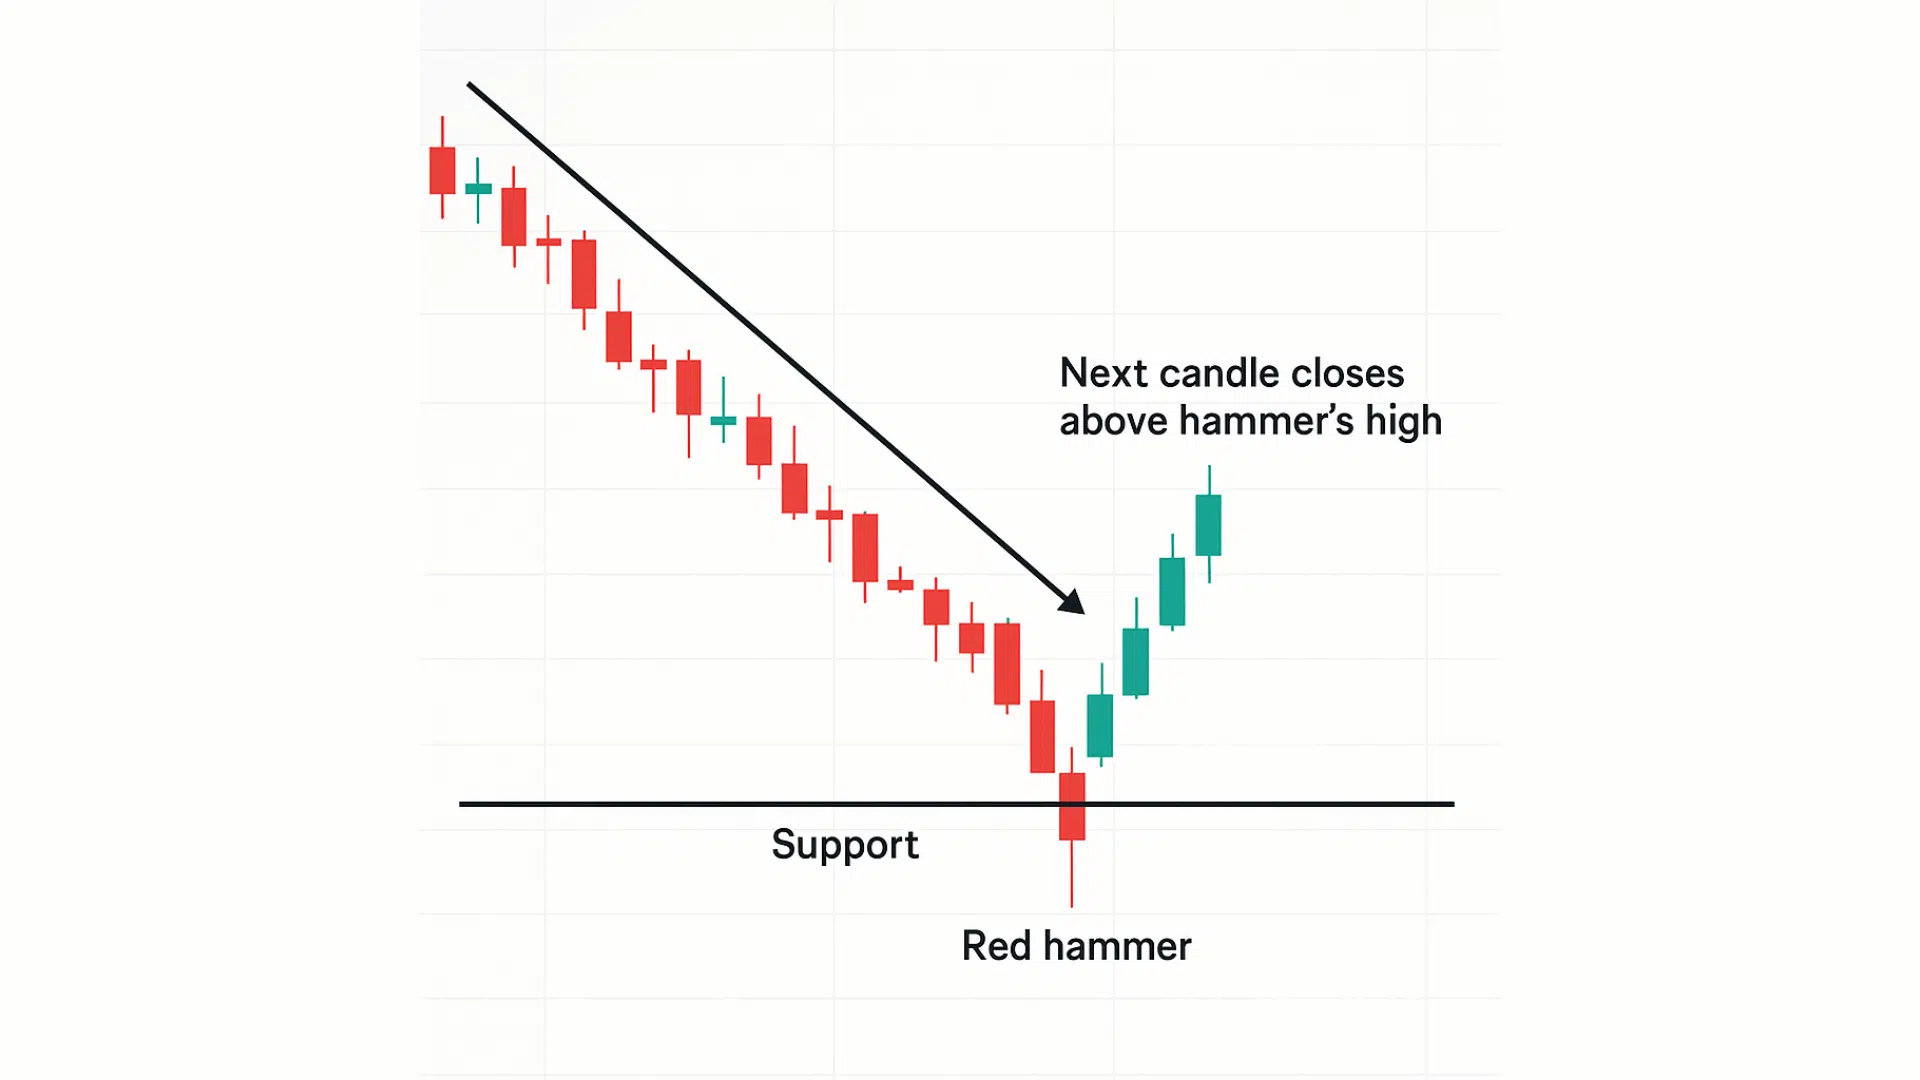
Imagine a stock that’s been falling for a week, losing ground every day. On the fifth day, it dips again but forms a red hammer right above a strong support zone from a previous low.
The next day opens higher and closes above the hammer’s high. That move confirms that buyers stepped in, turning the pattern into a valid reversal signal.
You could enter just above the hammer’s high, place a stop below the low, and target the next resistance level.
Example 2: Failed Setup in a Flat Market
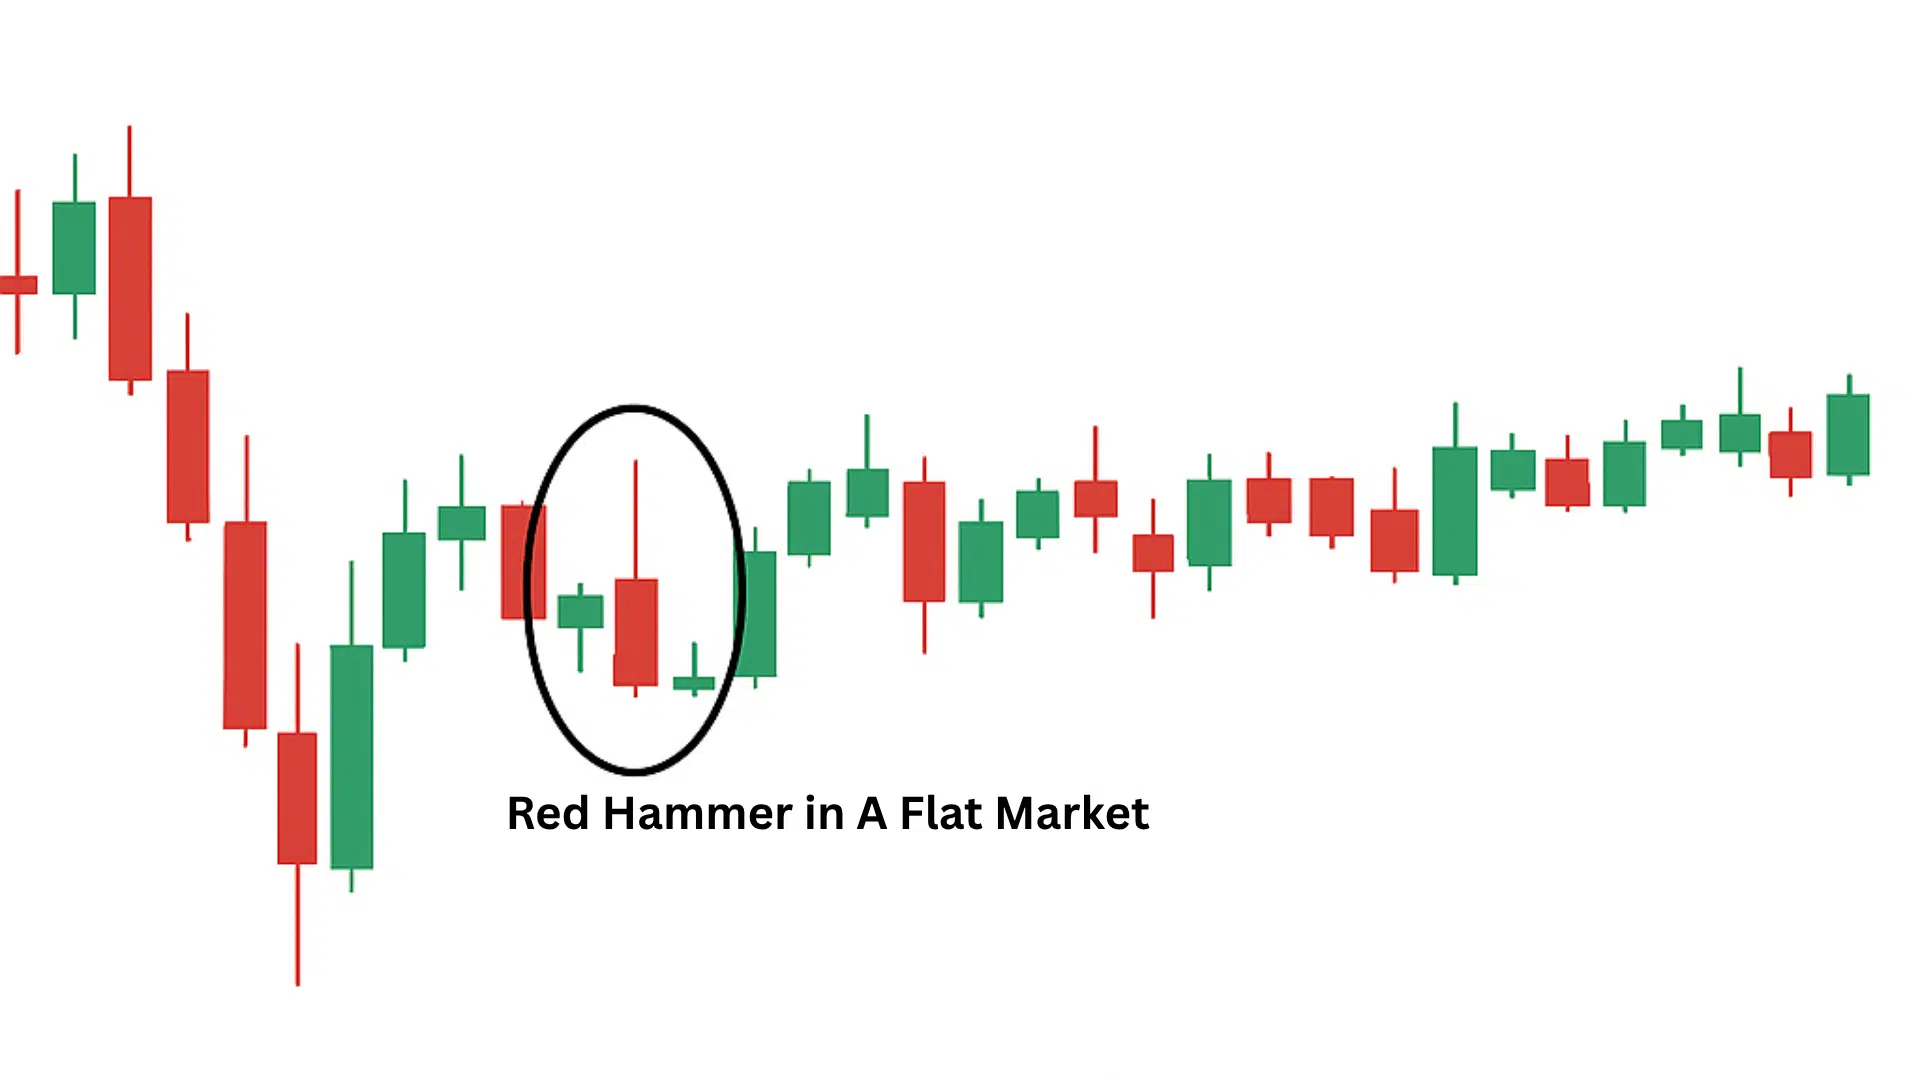
Not every red hammer leads to a bounce. Suppose a stock trades sideways for several sessions and then prints a red hammer in the middle of the range.
The next candle fails to close above the hammer’s high, and price drifts lower again. This shows that without a clear downtrend or confirmation, even a perfect-looking hammer can fail. Context always matters more than shape.
These examples highlight why confirmation and market background are critical. The red hammer can be a strong clue, but it’s only reliable when it forms after a decline and aligns with a clear support level.
Tips and Key Takeaways for Using Red Hammers
The red hammer can be a useful signal when you read it in the right context. Here are some key points to keep in mind while trading it.
- Combine the pattern with volume spikes or momentum indicators like RSI or MACD for stronger confirmation.
- Look for red hammers near major support levels or demand zones to improve accuracy.
- Always have a trading plan; set your entry, stop, and target before you take the trade.
- Avoid guessing or acting too early. Wait for a confirmation candle that closes above the hammer’s high.
- The long lower wick is a sign of buyer strength after a decline, showing where sellers lost control.
- Use a stop-loss below the hammer’s low to manage risk and protect your position.
When you follow these rules, the red hammer becomes a reliable clue in your trading strategy rather than just a random shape on the chart.
Wrap Up
Trading gets easier when you understand what each signal is trying to tell you. The red hammer candlestick is one of those patterns that can help you spot a possible shift before most traders see it. You’ve learned how it forms, what makes it valid, and how to trade it with confirmation instead of guessing.
If you take the time to practice reading it in different markets, you’ll start to see how useful it can be. Keep your stops tight, wait for proof, and trust your plan.
I hope this guide helped clear things up. Check out my other posts for more simple tips that make chart reading less stressful.