Ever stare at a chart and see a candle that looks like an upside-down “T”? That shape is called a gravestone doji, and it often hints that buyers are running out of steam.
It’s one of those patterns that can quietly warn you that a price shift might be coming.
In this post, I’ll walk you through what a gravestone doji means, how it forms, and why it matters for traders.
You’ll see how to spot it on your charts, what it reveals about market psychology, and simple ways to use it in your own trading plan.
What Is a Gravestone Doji?
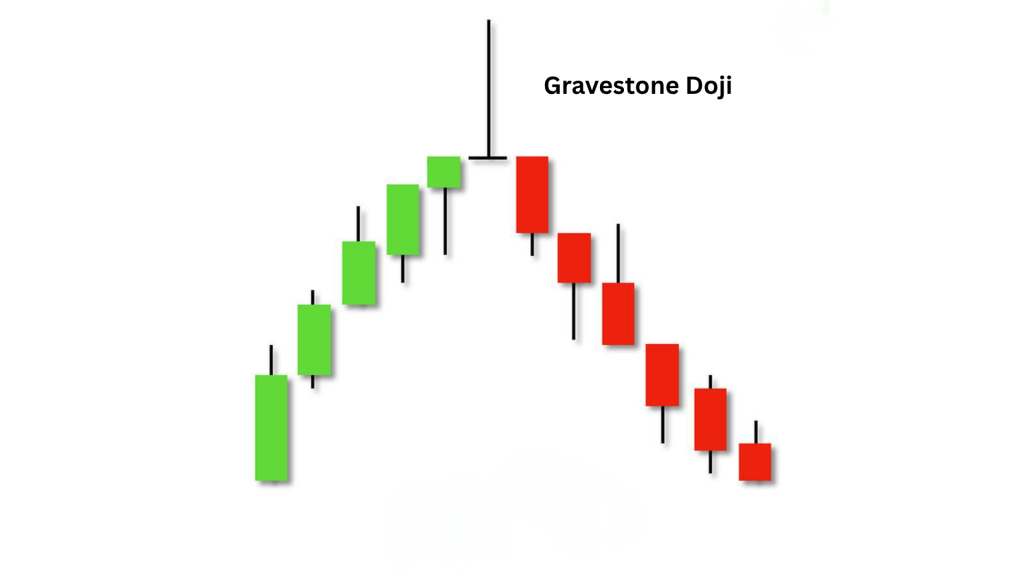
A gravestone doji forms when the open, close, and low prices are nearly the same, while the high price stretches far above them. This creates a candle with a long upper shadow and a tiny or flat body.
It gets its name because the shape looks like a gravestone; tall at the top with a flat base. That visual image represents how buying power fades and selling pressure takes over by the end of the session.
The gravestone doji is part of the doji family, which includes several candles that show indecision. But among them, this one leans bearish, especially when seen after a strong uptrend.
The gravestone doji tells a story of rejection. During the session, buyers push the price higher, but sellers fight back and push it down to where it began.
This action shows buying weakness and a rise in selling interest. It often signals a shift in sentiment; traders who were optimistic may start to take profits or even open short positions.
That’s why it’s viewed as a bearish reversal signal, though it always needs confirmation from the next candle.
Key Characteristics of Gravestone Doji
The gravestone doji has a few features that make it easy to spot:
- A long upper wick, showing buyers pushed prices up before sellers stepped in.
- A tiny or no body, meaning the open and closed are nearly equal.
- Little to no lower wick, as prices close near the session’s low.
It’s most powerful when it appears after a clear uptrend, signaling that momentum may be shifting. You’ll see it more often on daily or weekly charts, where data is more stable and less noisy than on shorter timeframes.
How to Identify a Gravestone Doji Candle on a Chart
Here’s a simple way to spot one:
- Look for a candle that has a long upper shadow and almost no body.
- The open, close, and low prices should be very close together.
- Check that the candle appears after a steady rise in price.
- The next candle should move lower to confirm the reversal.
Quick checklist:
- Trend: Upward before the doji
- Wick: Long upper shadow
- Body: Flat or tiny
- Lower shadow: None or very short
- Confirmation: Next candle closes below the doji’s low
How to Trade the Gravestone Doji
Trading this pattern works best with patience and confirmation. Here’s how you can use it step by step:
Step 1: Wait for confirmation. Don’t enter right after you see the candle. Wait for the next candle to close lower to confirm the bearish move.
Step 2: Plan your entry. Once confirmed, traders often enter short positions or close existing long trades.
Step 3: Set your stop-loss. Place it slightly above the high of the gravestone doji to protect against false signals.
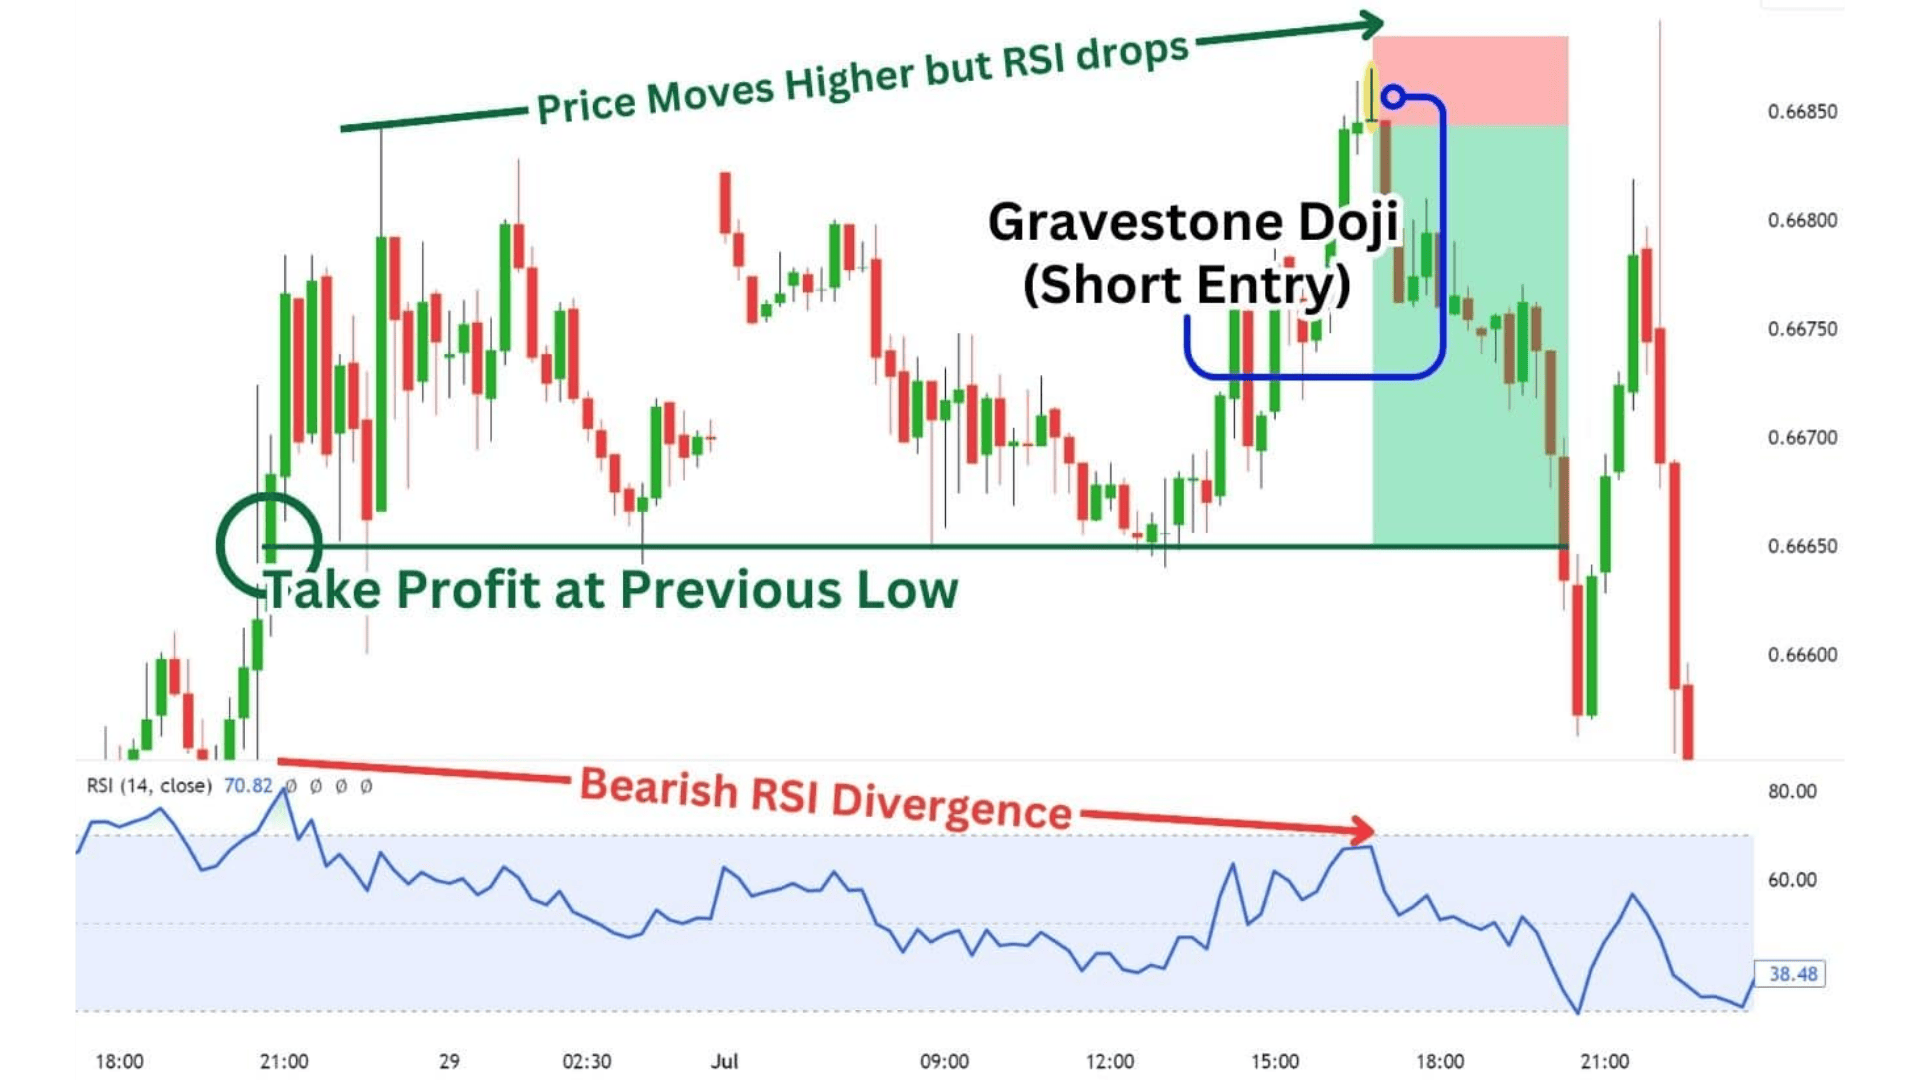
Step 4: Define profit targets. Aim for the next support zone or previous swing low. Some traders also use a risk/reward ratio such as 1.5:1 or 2:1.
Step 5: Use indicators for support. Tools like RSI, MACD, or volume can strengthen the setup. A drop in RSI or a spike in selling volume adds more confidence to the signal.
Reliability and Limitations
The gravestone doji is a warning, not a promise. It signals that the uptrend might be over, but not that a downtrend will surely begin.
To improve reliability:
- Look for it near resistance zones or past swing highs.
- Check volume spikes for stronger conviction.
- Combine it with other signals like trend lines or moving averages.
Avoid relying on the pattern alone, especially in choppy or sideways markets where price noise can create false setups.
Tips for Beginners
If you’re new to reading candlestick patterns, keep these points in mind before trading the gravestone doji.
- Wait for confirmation: Don’t act on the candle alone. Always wait for the next one to confirm direction.
- Combine with other tools: Use trend lines, moving averages, or volume to strengthen the signal.
- Backtest your strategy: Check past charts to see how often this pattern worked before using it live.
- Consider the context: Where the candle forms, at the top, bottom, or in a range, matters more than its shape.
These habits help you trade more confidently and avoid reacting too quickly to a single candlestick signal.
Gravestone Doji vs Other Candlestick Patterns
While several candlestick patterns may look alike, their meanings and signals can differ. The table below highlights how the Gravestone Doji compares to similar formations.
| Pattern | Appearance | Market Message | Typical Signal |
|---|---|---|---|
| Gravestone Doji | Long upper shadow, flat or tiny body, little to no lower wick | Buyers lose control, sellers take over | Bearish reversal |
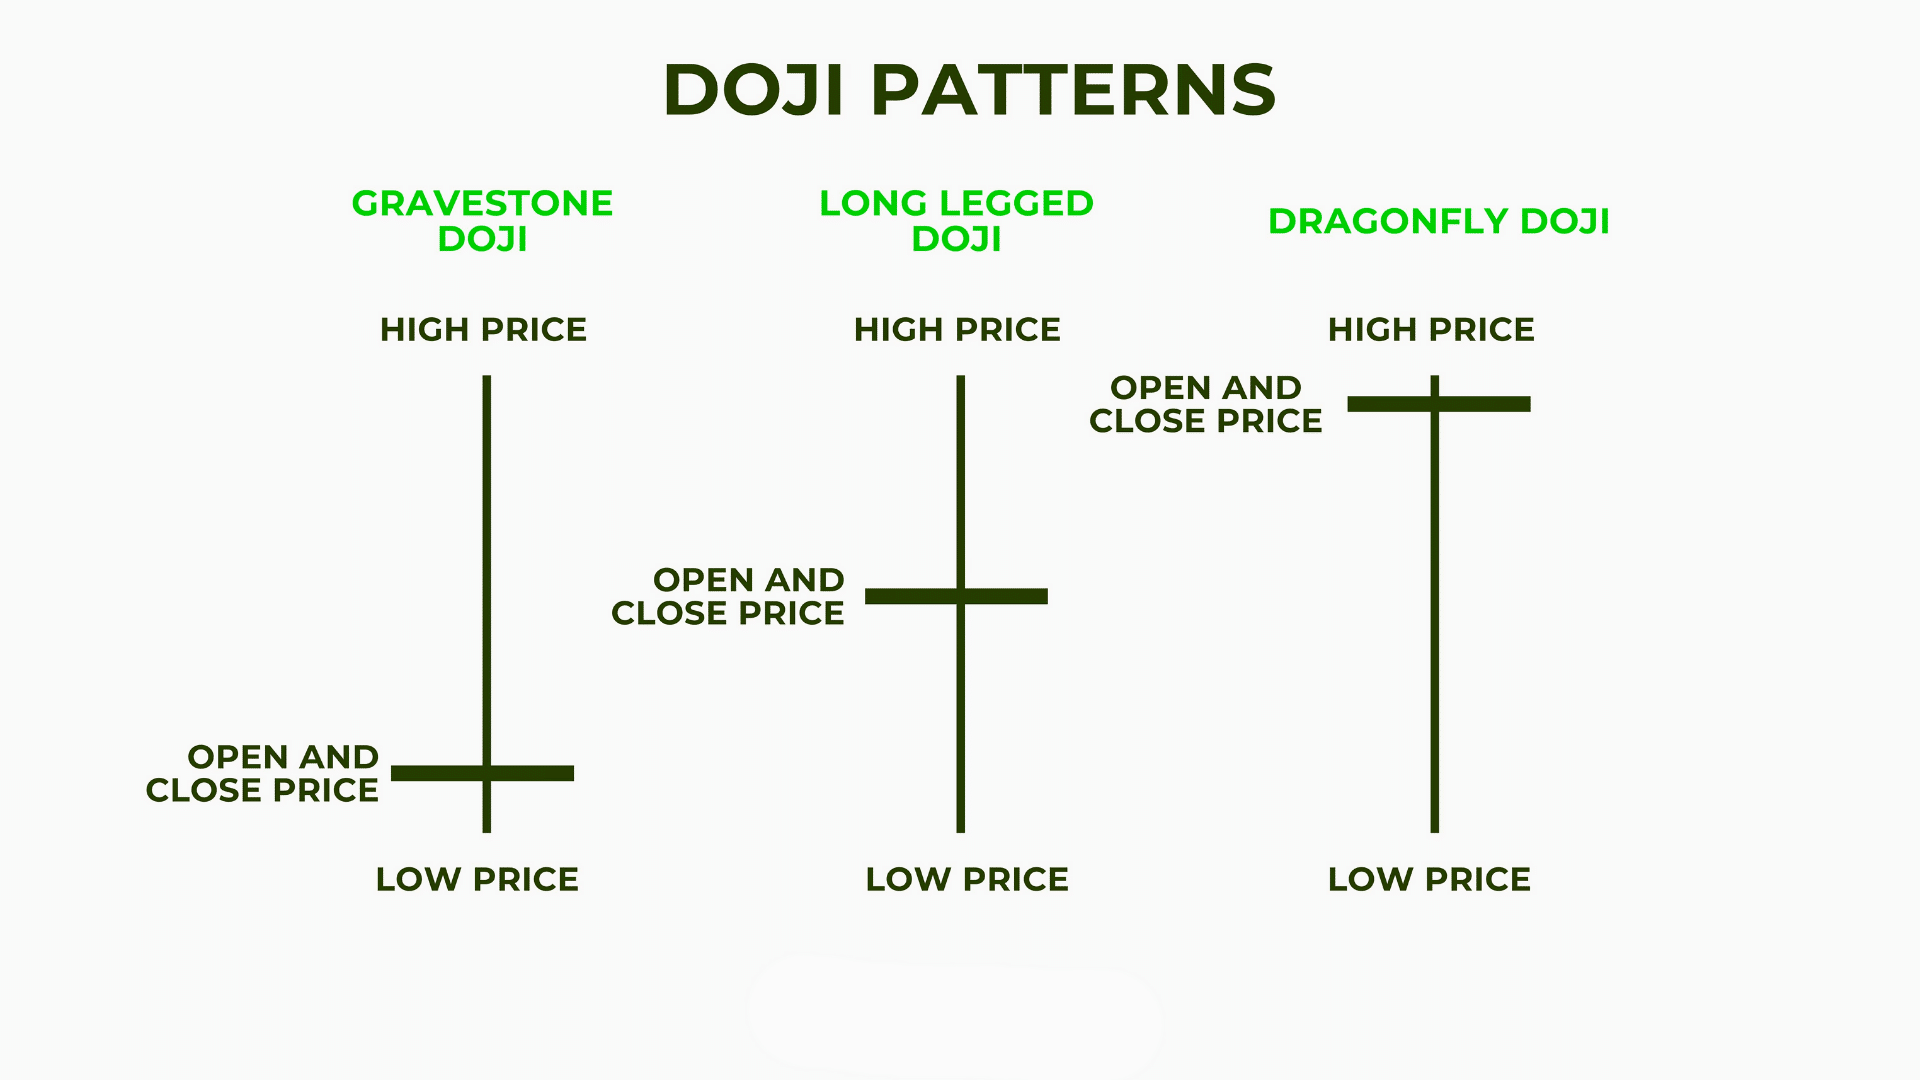
| Dragonfly Doji | Long lower shadow, open and close near the top | Sellers lose control, buyers recover | Bullish reversal |
| Standard / Long-Legged Doji | Shadows on both ends, body near the center | Market indecision between buyers and sellers | Neutral/possible reversal if confirmed |
Each pattern offers clues about market sentiment. The gravestone doji, in particular, stands out for its strong rejection of higher prices and its clear bearish tone when confirmed by the next candle.
Examples of Gravestone Doji Candle
Learning through scenarios helps you understand how the gravestone doji behaves in different conditions. Here are two common examples that show both its strengths and limits:
Example 1: Gravestone Doji at the Top of a Rally
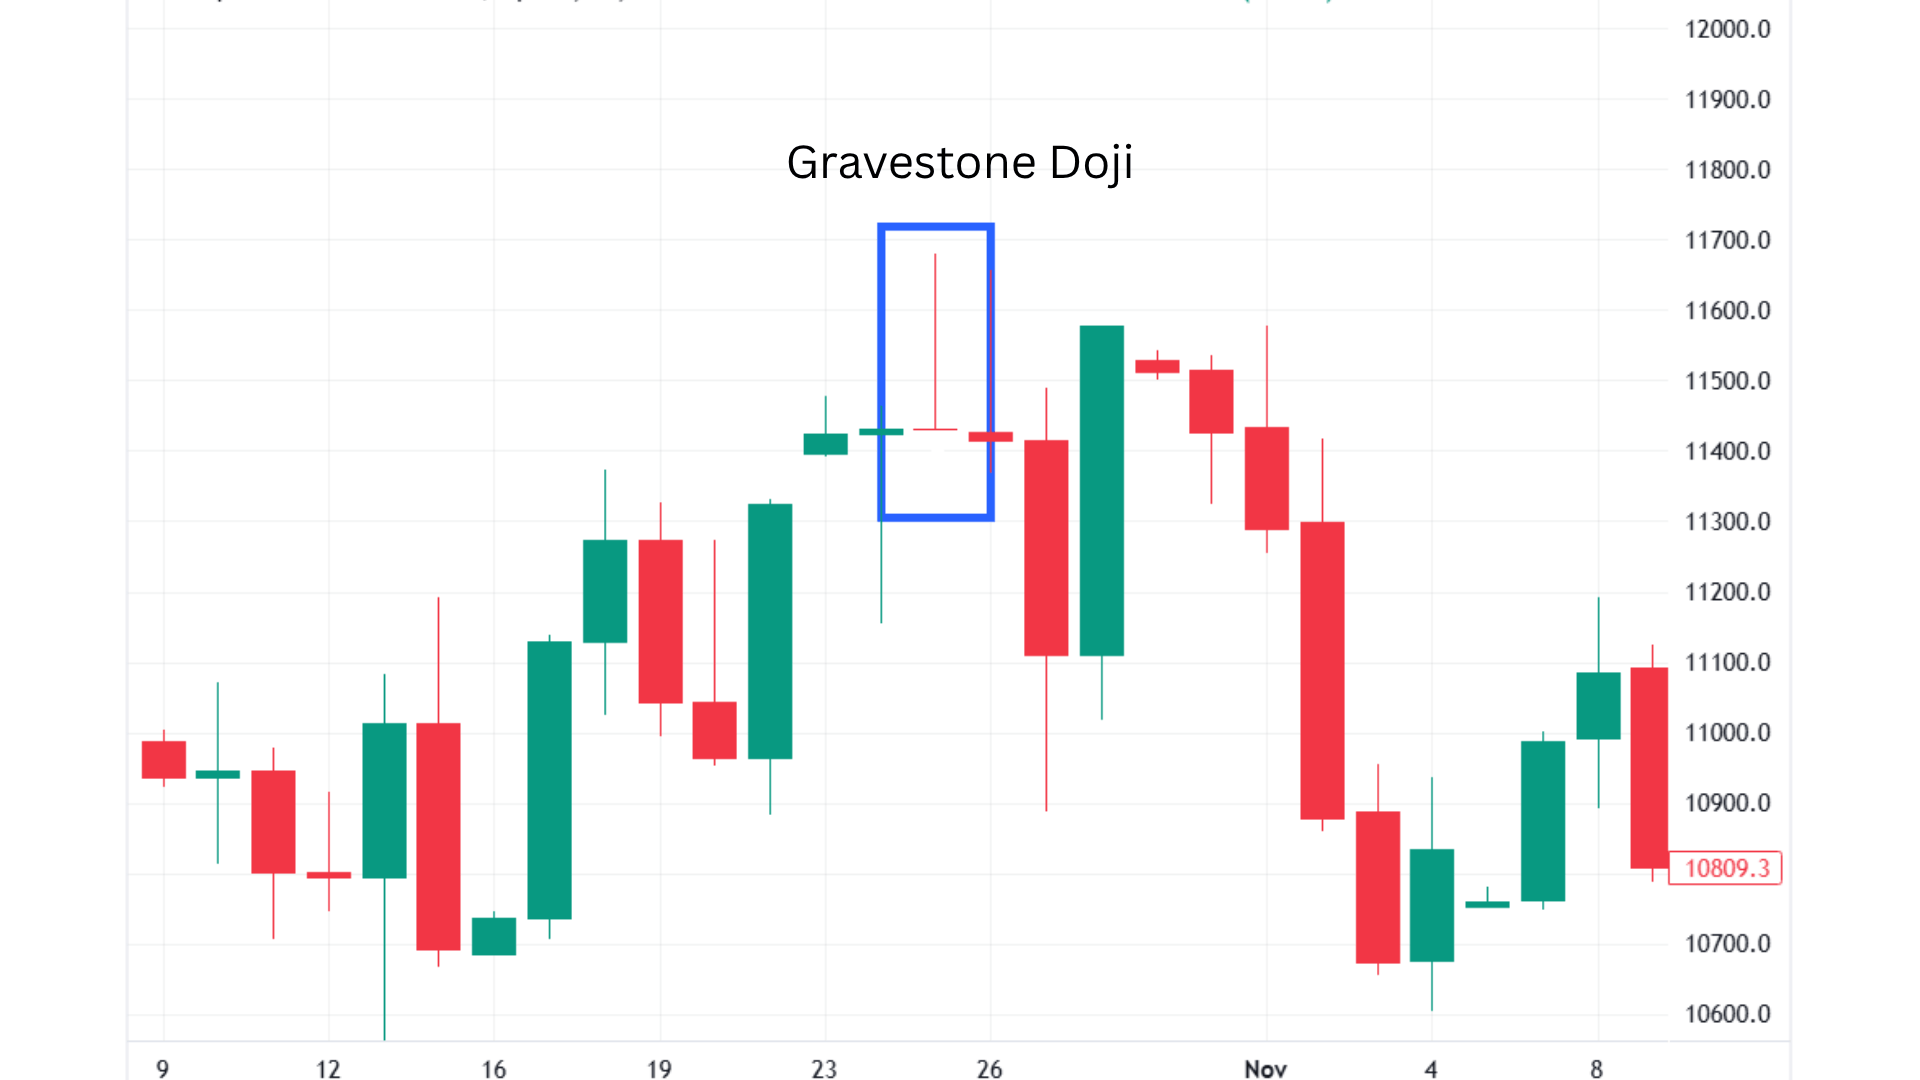
A gravestone doji forms after a steady uptrend. The price opens, climbs sharply, but then sellers step in and push it back to the opening level.
The next candle closes lower, confirming the bearish reversal. This follow-through move often leads to a clear drop in price, showing how powerful the pattern can be when it appears at a market top.
Example 2: Gravestone Doji in a Sideways Market
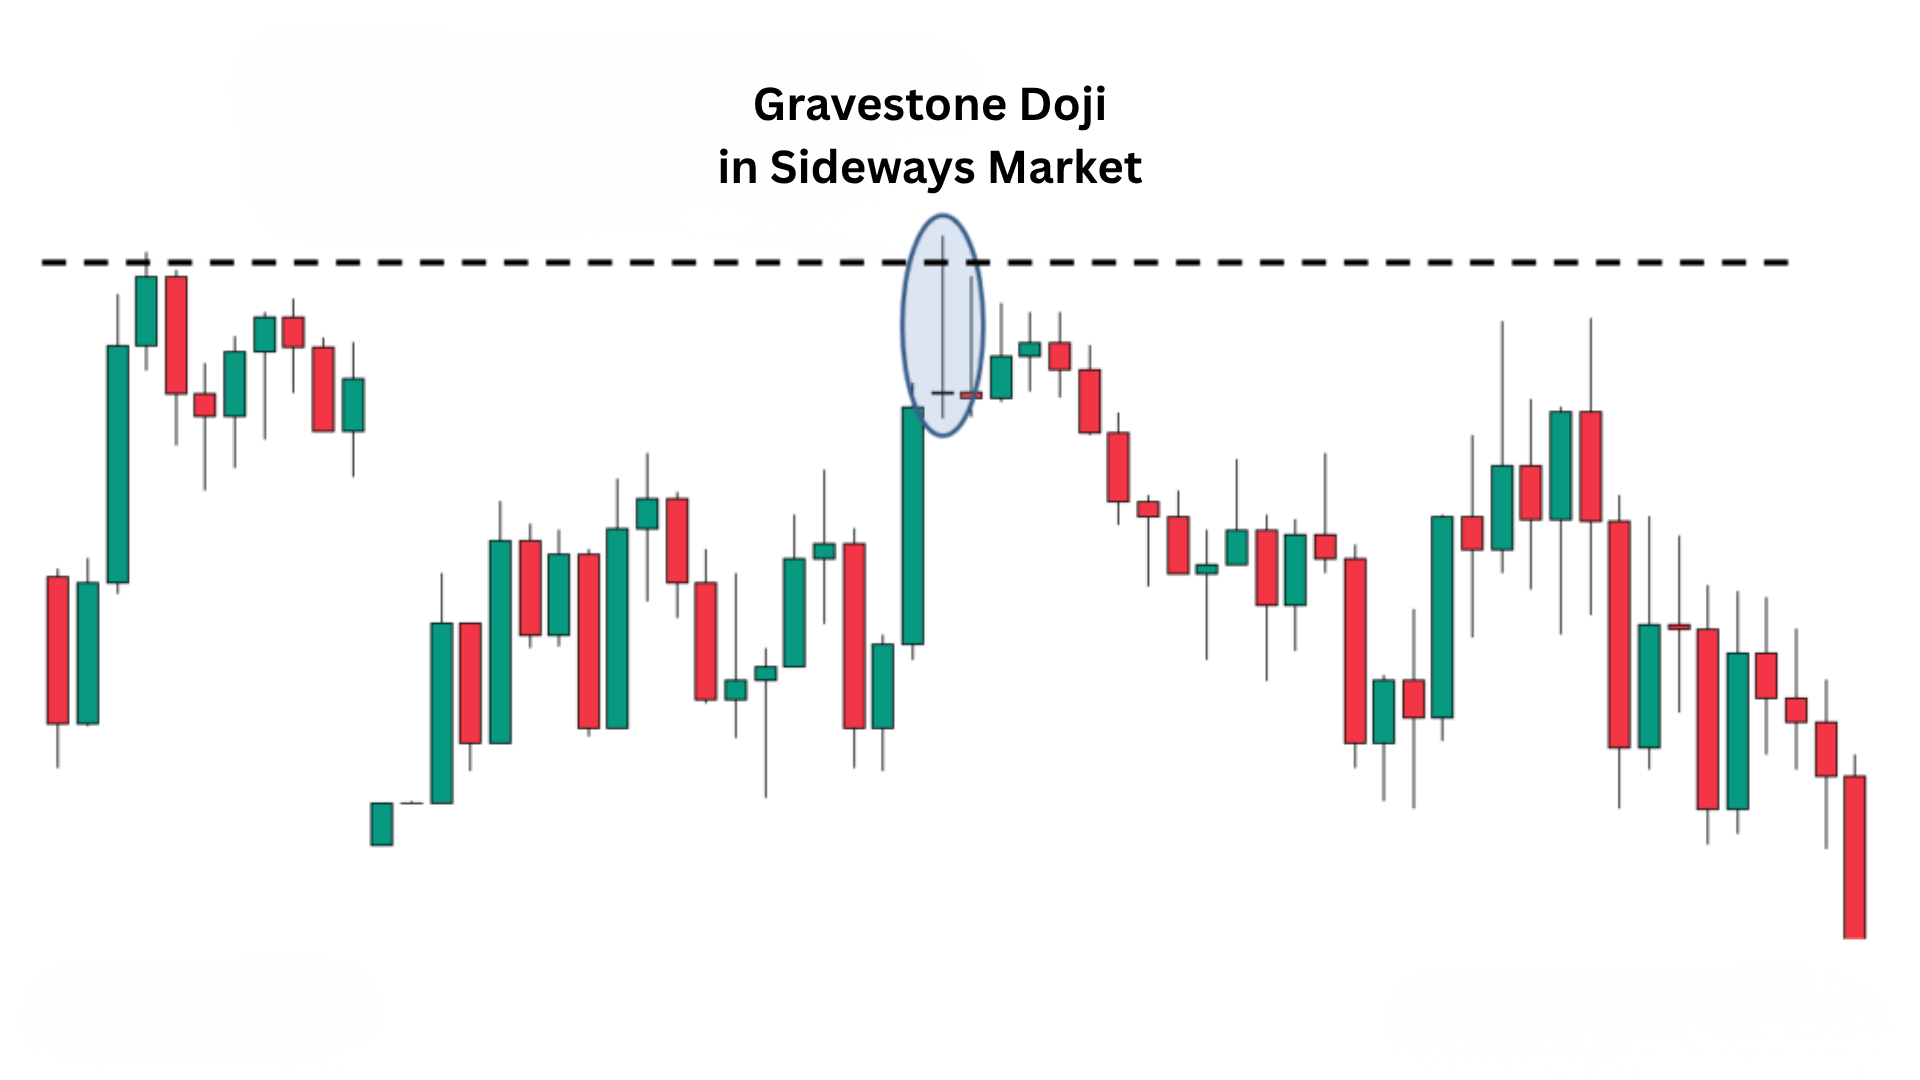
In this case, the gravestone doji appears while prices move sideways. Even though the candle shape looks right, the lack of trend means the setup doesn’t have much impact.
Price action remains flat afterward, showing that context matters; the same pattern can fail when it forms in a range instead of a clear uptrend.
Understanding both outcomes helps you see when the gravestone doji is worth acting on and when it’s better to wait for stronger confirmation.
Common Mistakes to Avoid While Reading Gravestone Doji
Even though the gravestone doji is reliable, beginners often make errors that weaken its value.
- Taking a trade before the next candle confirms the move.
- Ignoring the bigger trend and trading against long-term strength.
- Using it in a sideways or low-volume market where reversals rarely follow through.
- Confusing it with similar candles that have bodies (like a shooting star).
These mistakes can reduce the accuracy of the pattern and lead to unnecessary losses if you act too quickly.
Wrap Up
The gravestone doji gives you a clear window into how market pressure shifts from buyers to sellers. Once you understand what it means and how it forms, you’ll start noticing it more often in your own chart reading.
I hope this guide helps you see how this candle can act as an early signal for trend changes. Just remember, confirmation matters more than quick reactions.
Take your time, pair it with your other tools, and let the chart speak before making a move.
If you found this helpful, check out my other posts for more trading tips and pattern breakdowns that can sharpen your skills and build your confidence.