
Ever felt that sinking feeling when a stock keeps hitting the same ceiling and won’t budge? That resistance level tells you something important about market psychology.
Buyers are getting tired while sellers grow stronger with each rejected attempt. I’m going to teach you how to read these signals like a pro trader.
You’ll learn how to spot when an uptrend is about to reverse direction. The triple top pattern shows you exactly when to protect your profits before things go south. This guide cuts through the confusion and gives you practical steps you can use immediately.
What is the Triple Top Pattern?
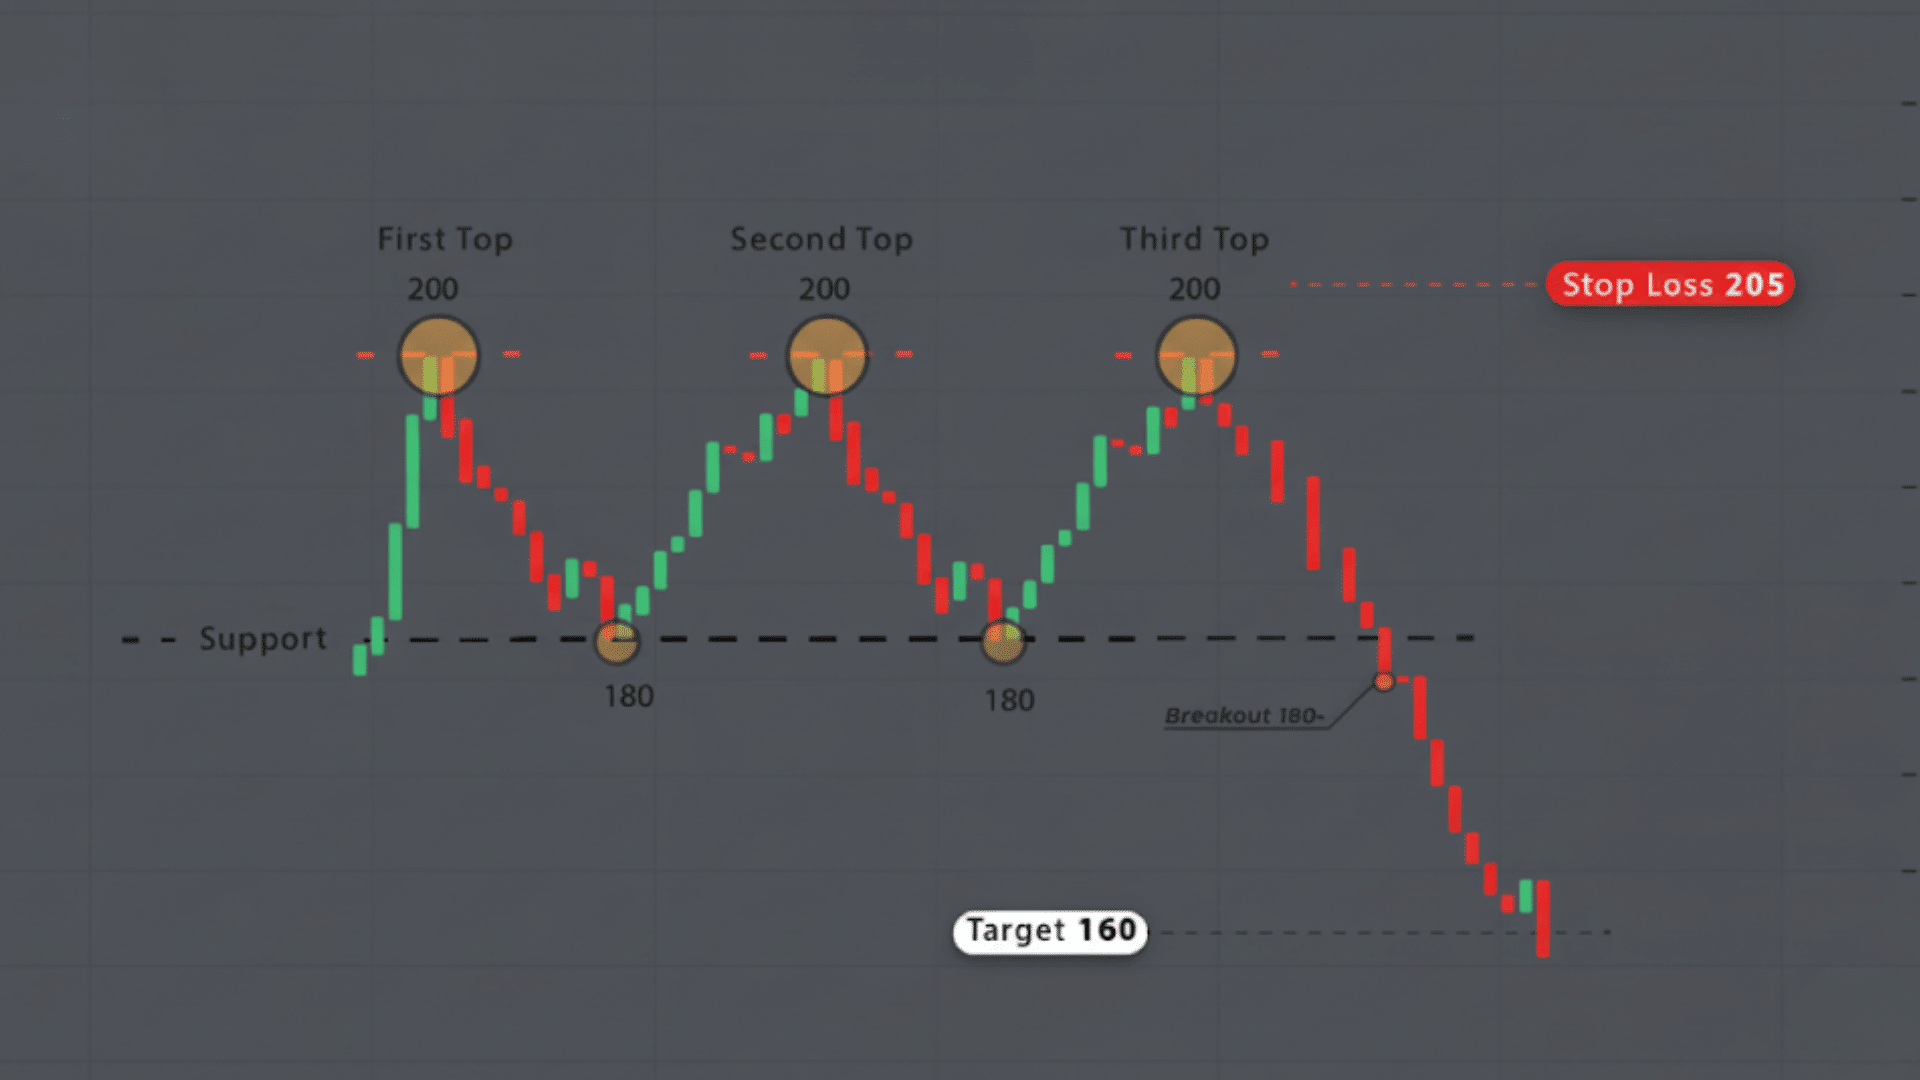
The triple top pattern is a bearish reversal pattern seen after an uptrend in price charts. It forms when the price tries three times to break a resistance but fails.
This creates three peaks at roughly the same level, separated by small drops. The pattern shows buyers are losing strength, while sellers are stepping in more.
It was first recognized in technical analysis many years ago as a strong signal of a potential trend change. Traders confirm it when the price drops below support after the third peak. This signals a likely shift from uptrend to downtrend.
Characteristics of the Triple Top Pattern
I’ve identified the key characteristics that help you recognize a triple top pattern on price charts. Here are the essential features that define this bearish reversal formation:
1. Formation
The triple top pattern forms with three similar peaks hitting a resistance level. Between peaks, the price pulls back to a support line. This support level acts as a floor, holding the price temporarily.
The sequence shows buyers repeatedly failing to push the price higher. This setup signals weakening bullish momentum and growing selling pressure as sellers prevent new highs.
2. Shape
Visually, the triple top looks like an “M” shape with three peaks at roughly the same height. The lows between peaks form a horizontal or slightly sloped support line.
The pattern looks compact but extends over time, showing price hitting the resistance area three times. This shape makes it easy to spot repeated failed breakout attempts on charts.
3. Duration
The triple top pattern usually takes weeks or months to form, requiring time for three distinct peaks. Spacing between peaks helps confirm this is not just random price movement.
Longer durations generally make the pattern more reliable. Fast formations can be less predictable. Patience is important when monitoring for this pattern.
4. Volume Consideration
Volume typically decreases on each peak during the triple top formation, showing less buying interest over time. This declining volume signals weakening momentum.
When the price finally breaks below the support (neckline), volume should spike, confirming sellers’ control. Volume helps confirm if the pattern is valid or could fail.
5. Confirmation
The triple top is confirmed when the price breaks below the support level with increased volume. This breakout shows sellers overpower buyers, signaling a trend reversal.
Traders often wait for this confirmation before entering bearish trades. Sometimes, price retests the broken support as resistance before continuing downward, further validating the pattern.
Triple Top Chart Pattern: How It Works in Technical Analysis

The Triple Top pattern is a strong bearish reversal signal that appears after an uptrend. It shows price hitting the same resistance level three times but failing to move higher each time.
To identify it, look for three peaks with pullbacks between, all roughly at the same price level. Key indicators like RSI and moving averages help confirm fading momentum and a possible reversal.
The pattern reflects the psychology of buyers losing strength while sellers gain confidence. Eventually, the price breaks below the support level, signaling that sellers now control the market. This often leads to a new downtrend forming.
Using the Triple Top Pattern in Trading Strategies

The triple top pattern offers traders specific strategies for entering, exiting, and managing risk effectively in bearish setups. Here’s how to apply this pattern in your actual trading decisions:
1. Risk-Reward Ratio
Using the triple top pattern helps set clear price targets and stop losses. Measure the height between the resistance peaks and the support line. Set your profit target equal to this height below the support when the price breaks down.
Put a stop loss just above the highest peak. This creates a good risk-reward ratio where potential gains outweigh losses, helping traders protect capital while aiming for profits.
2. Entry and Exit Points
Enter a short trade after the price breaks below the support line following the third peak. This confirms sellers are in control.
Exit near the projected target price based on the pattern’s height or at the next strong support. Exiting on time locks in profits and manages risk.
3. Confirmation Tools
Use technical indicators like RSI to spot weakening momentum during the triple top. Moving averages show a changing trend direction.
Confirm breakdowns with volume spikes to avoid false signals. Combining these tools improves trading accuracy and confidence.
4. Timeframes to Watch
The triple top pattern works best on daily and weekly charts where trends are clearer. Longer timeframes provide more reliable signals.
Shorter timeframes might produce false patterns due to market noise. Patience is key when monitoring this pattern to avoid premature trades.
Triple Top Pattern: Benefits and Risks
Every trading pattern comes with advantages and potential drawbacks that affect your decision-making process. Understanding both sides helps you use the triple top pattern more effectively in real market conditions:
| Benefits | Risks |
|---|---|
| The pattern signals a potential trend reversal when buyers repeatedly fail to break resistance levels | The pattern can fail and lead to losses when the price breaks above resistance instead of dropping |
| It predicts upcoming price declines by showing weakening buying momentum, helping traders position for downward moves | The pattern may not be reliable during strong bull markets or volatile conditions where trends overpower technical signals |
| Three distinct peaks at similar heights make the pattern relatively easy to identify on charts for most traders | Depending solely on this pattern without confirming with volume, indicators, or broader market context increases trading risk |
Weighing these benefits and risks helps you decide when to trade triple tops and when to wait. Always combine pattern analysis with volume confirmation and broader market trends for better trading outcomes.
How to Improve Triple Top Accuracy Using Other Indicators?
The triple top pattern works better when combined with other technical tools for stronger trade confirmation. Using multiple indicators together reduces false signals and increases your confidence in trade decisions. Here’s how to combine the triple top with other analysis methods:
- Combining with trendlines: Draw trendlines connecting the peaks and support levels to confirm the pattern’s structure and validate resistance strength.
- Pairing with volume analysis: Watch for declining volume at each peak and rising volume on breakdown to confirm sellers are taking control.
- Using momentum indicators: Apply RSI or MACD to spot divergence where price makes higher peaks but indicators show weakening momentum.
- Combining with other patterns: Look for additional bearish patterns like head and shoulders or double tops nearby to strengthen your reversal signal.
Combining multiple technical tools creates a more complete picture of market conditions before entering trades. This layered approach helps filter out weak signals and improves your overall trading success rate significantly.
Applying the Triple Top Pattern Across Different Markets

The triple top pattern appears across all financial markets but behaves differently depending on asset volatility and trading conditions. Here’s how the triple top pattern performs in different markets:
1. Stocks and ETFs
The triple top pattern works reliably in stock and ETF markets where price movements follow more predictable trends.
Stocks often respect resistance levels clearly, making the three peaks easier to identify on daily charts. Volume confirmation is especially important in equity markets since it validates institutional selling activity.
2. Forex and Commodities
Forex and commodity markets show more volatility, which can make triple top patterns harder to spot accurately.
Currency pairs often form triple tops around major psychological price levels like round numbers or previous highs. Use wider stop losses in volatile forex and commodity markets to avoid getting stopped out early.
3. Cryptocurrency Markets
Cryptocurrency markets display triple top patterns frequently due to extreme volatility and rapid trend changes daily.
Digital assets can form this pattern in just days or hours on shorter timeframes compared to stocks. Only trade crypto triple tops with small position sizes because of unpredictable price swings and higher risk.
Triple Top Pattern: Real-World Case Study
Thomas Bulkowski’s research analyzing 1,964 triple top patterns found they rank toward the bottom in performance with a higher failure rate than most patterns Bulkowski on Triple Tops.
A documented example is Block Inc. (SQ), where three swing high resistance peaks formed on the daily chart before breaking below support and declining in a bearish downtrend over subsequent weeks. Triple Top Pattern: Overview, How To Trade With Examples.
Another case was gold in 2016, which formed a triple top over 18 months, testing resistance between $1,350-$1,375 three times before breaking support around $1,250 and declining over $200. Triple top pattern: Definition, Importance, Benefits, Risks.
Traders capitalized by entering short positions at support breakdown, placing stops above the highest peak, and targeting declines measured from pattern height.
Common Mistakes Traders Make with the Triple Top Pattern
Even experienced traders make costly mistakes when trading the triple top pattern that hurt their accounts. Learning to spot these errors helps you trade smarter and protect your money. Here are the four mistakes you must avoid when trading this pattern:
- Acting Before Confirmation: Jumping into trades too early, before the neckline breaks, often leads to quick losses.
- Ignoring Volume Signals: Skipping volume analysis can trick you into taking trades that fail and lose money fast.
- Misidentifying the Pattern: Many traders confuse triple tops with double tops or regular pullbacks, leading to bad trades.
- Setting Stops Too Tight: Placing your stop loss too close gets you kicked out on normal price wiggles.
Dodging these mistakes boosts your win rate when you spot this bearish reversal pattern forming. Always double-check each part of the pattern before putting real money on the line.
That’s a Wrap
You’ve just learned a powerful tool for protecting your trading account from nasty surprises. The triple top pattern appears more often than you might think in real markets. Start looking for it on your favorite stocks during strong uptrends.
Practice identifying the resistance level where the price keeps getting rejected. Set alerts so you catch the breakdown when it happens.
Always combine this with volume analysis and other indicators for safety. Your trading confidence will grow as you spot these patterns before others do.
Keep a journal of every pattern you find and track the results. Drop a comment below about the first chart where you spot this setup.