Noticing prices making lower peaks while holding steady at the bottom on your trading charts? That’s a descending triangle, and this bearish pattern signals potential trouble ahead for price movements.
I’ve put together everything you need to understand how it forms and functions in real markets. You’ll learn how to identify this formation correctly, when to enter trades, and how to calculate price targets.
I’ll also cover trading strategies, volume confirmation techniques, and proper stop-loss placement for effective risk management. Common trading mistakes cost people money, so I’ll show you exactly what to avoid when trading this setup.
If you’re new to technical analysis or refining your skills, this pattern appears regularly across all timeframes. You’ll know exactly how to spot and profit from this pattern by the end.
This information is educational only and not investment advice. Seek guidance from a qualified financial advisor before investing your money.
What Is a Descending Triangle Pattern?
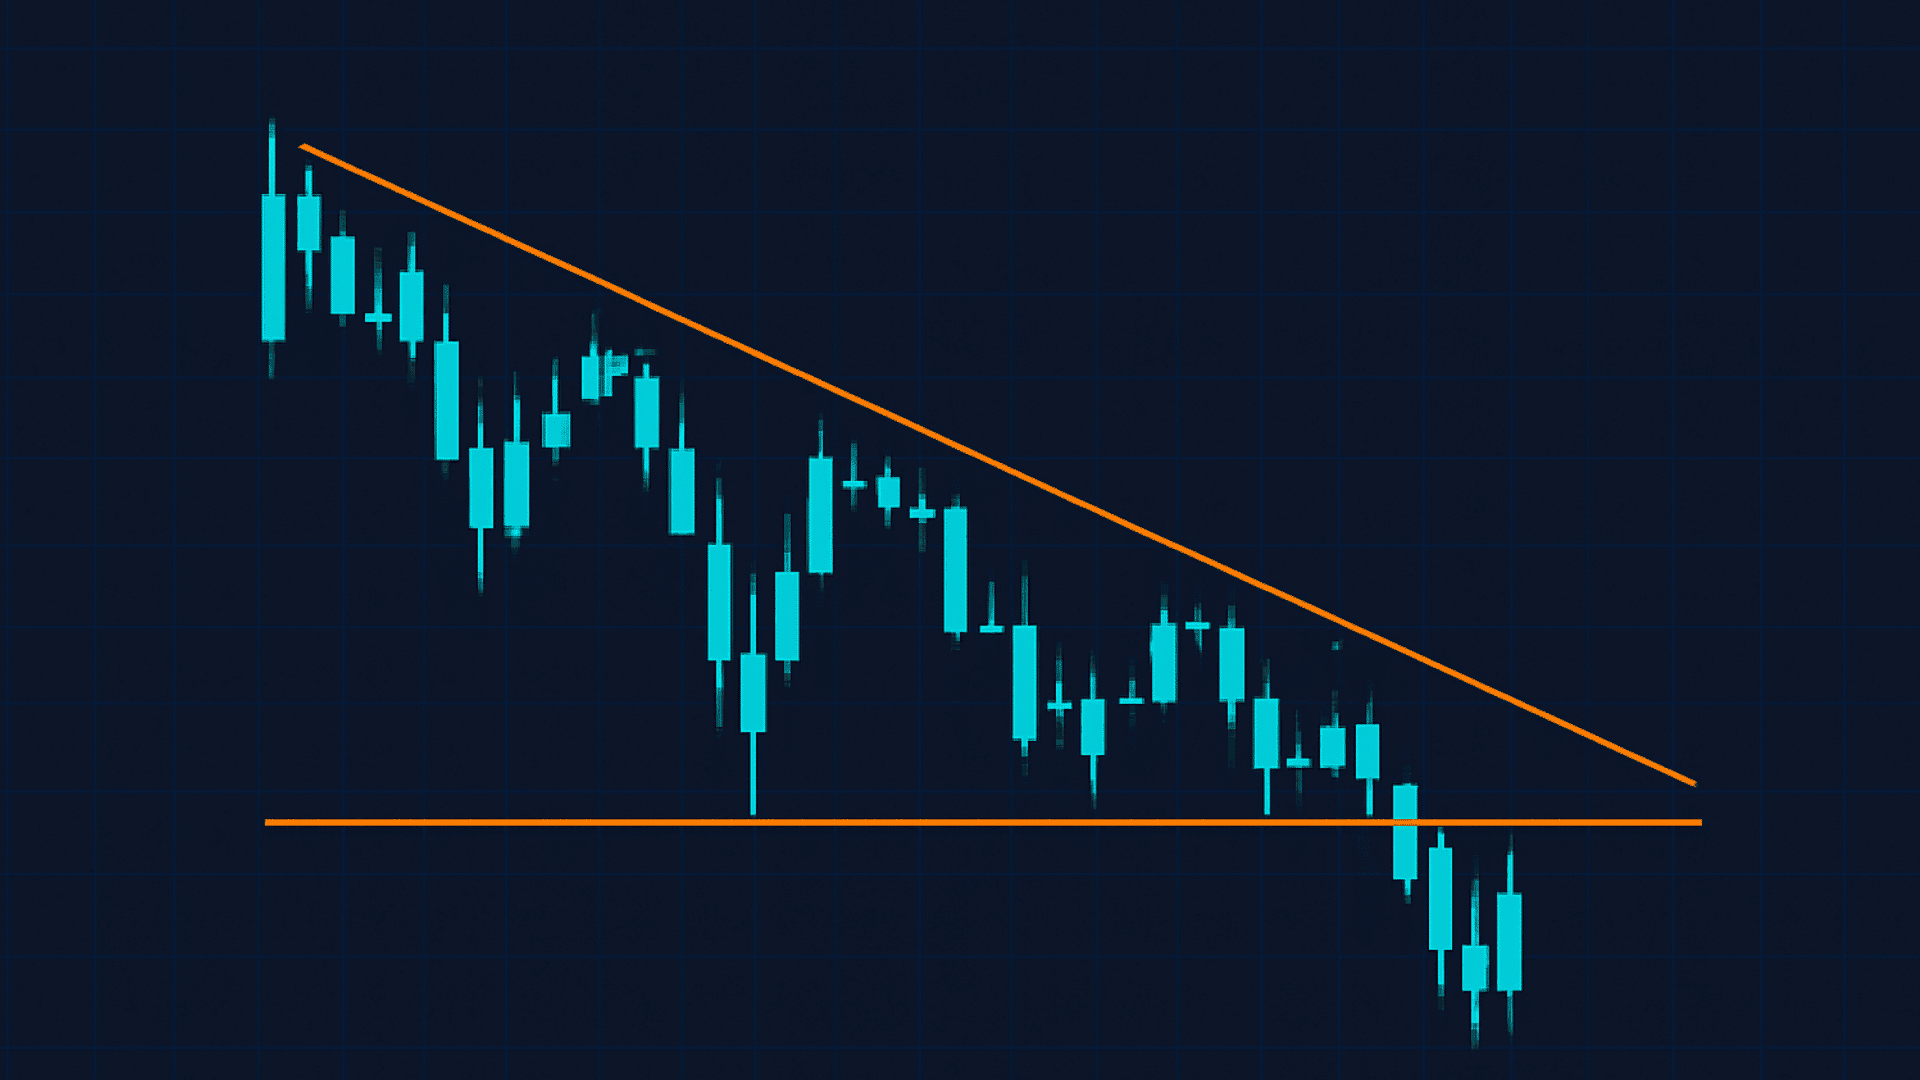
A descending triangle pattern is a bearish chart formation that shows sellers taking charge. Traders watch this pattern to spot potential downward price moves. It has two key parts:
- The descending resistance line connects lower highs. Each peak sits below the one before it.
- The horizontal support line connects similar low points. Price bounces off this flat base again and again.
This structure tells a clear story about what’s happening in the market:
Buyers keep defending the same price level. They step in to support to prevent further drops. Sellers become more forceful with time. They accept lower prices during each rally attempt.
When the support line finally breaks, selling pressure speeds up. This confirms the downtrend will likely continue. The pattern works because it shows a shift in control.
Bulls lose strength while bears gain confidence. Each lower high proves sellers are winning the battle.
Key Characteristics of the Descending Triangle
I’ve identified the key characteristics that help you spot a descending triangle accurately on price charts. Here are the essential features that define this bearish formation:
1. Structure and Validation
The descending triangle has a clear geometric structure that’s easy to spot. The pattern forms when a descending resistance line meets a flat support line, creating a triangle shape.
These lines converge toward an apex point, building pressure that eventually leads to a breakout.
- Descending Resistance Line: Connect at least two lower highs with a downward-sloping line that shows weakening buying pressure.
- Flat Support Line: Draw a horizontal line through two or more similar lows where buyers consistently defend the same price level.
- Apex Convergence: The two lines move closer together, creating a squeeze that signals an imminent breakout.
- Pattern Perfection: Real charts rarely form perfect triangles, so focus on overall behavior rather than exact geometric precision.
2. Trend Context
The descending triangle works differently depending on where it appears in the market cycle.
Context matters a lot when evaluating this pattern’s reliability. Always examine what came before the triangle to understand its likely outcome.
- Continuation Pattern: Most commonly appears during an existing downtrend, acting as a brief pause before prices continue falling.
- Reversal Setup: Can form after an uptrend to signal bearish reversal, though these setups are less reliable than continuation patterns.
- Market Alignment: Check broader market trends and higher timeframes to confirm the pattern aligns with the overall direction.
3. Volume Behavior
Volume patterns tell you whether a breakout is real or fake. Declining volume during formation is normal and expected.
The key moment comes when price breaks support—that’s when volume should surge dramatically.
- Formation Phase: Volume typically declines as price compresses within the triangle, showing trader indecision and hesitation.
- Breakout Phase: A spike in volume confirms the breakout’s strength and shows strong conviction behind the move.
- False Breakout Warning: Breakouts without rising volume often fail quickly, so always wait for volume confirmation before entering.
4. Duration and Timing
Time plays an important role in pattern reliability and effectiveness. Descending triangles can form over different periods, from days to months. Longer patterns on higher timeframes generally produce more reliable signals than quick formations.
- Time Span: Descending triangles can develop over days, weeks, or months, depending on the timeframe you’re analyzing.
- Breakout Timing: Most breakouts occur between 50% and 75% of the distance to the apex, creating the ideal trigger point.
- Reliability Factor: Longer formations on higher timeframes, like daily or weekly charts, tend to be more trustworthy and accurate.
5. Breakout Confirmation
Confirmation separates real moves from false signals that trap traders. A proper breakout requires the price to close below support, not just briefly dip below it. Sometimes price returns to retest the broken level, offering a second entry opportunity.
- Valid Breakout: Price must close below the horizontal support level with noticeable volume expansion to confirm the pattern.
- Retest Opportunity: Broken support often becomes new resistance, and the price may return to test it before continuing downward.
- Pattern Failure: The setup is invalidated if the price closes above the descending resistance line or makes a higher high.
6. Measuring the Target Move
The triangle’s height gives you a logical price target for the move. This measurement technique works across different markets and timeframes. It helps you set realistic profit targets and manage your trades effectively.
- Height Calculation: Measure the vertical distance from the first height to the support line at the triangle’s widest point.
- Target Projection: Subtract this measured height from the breakout level to estimate your downside price target.
- Example Scenario: If the first high is $60 and support is $50, the height is $10, so the target is $40 ($60 – $50).
How Does the Descending Triangle Function in Chart Analysis?
A descending triangle is mostly seen as a bearish pattern because it shows sellers pushing prices lower with each rally.
The pattern forms from lower highs along a descending trendline and a flat horizontal support line where buyers step in.
It generally signals a continuation of an existing downtrend, but can sometimes indicate a reversal after price consolidates.
The horizontal support acts as a key level where buying pressure holds temporarily, while the descending resistance line shows sellers gradually overpowering buyers.
Together, support and resistance lines create a tightening price range, signaling that a breakout, usually downward, is likely soon.
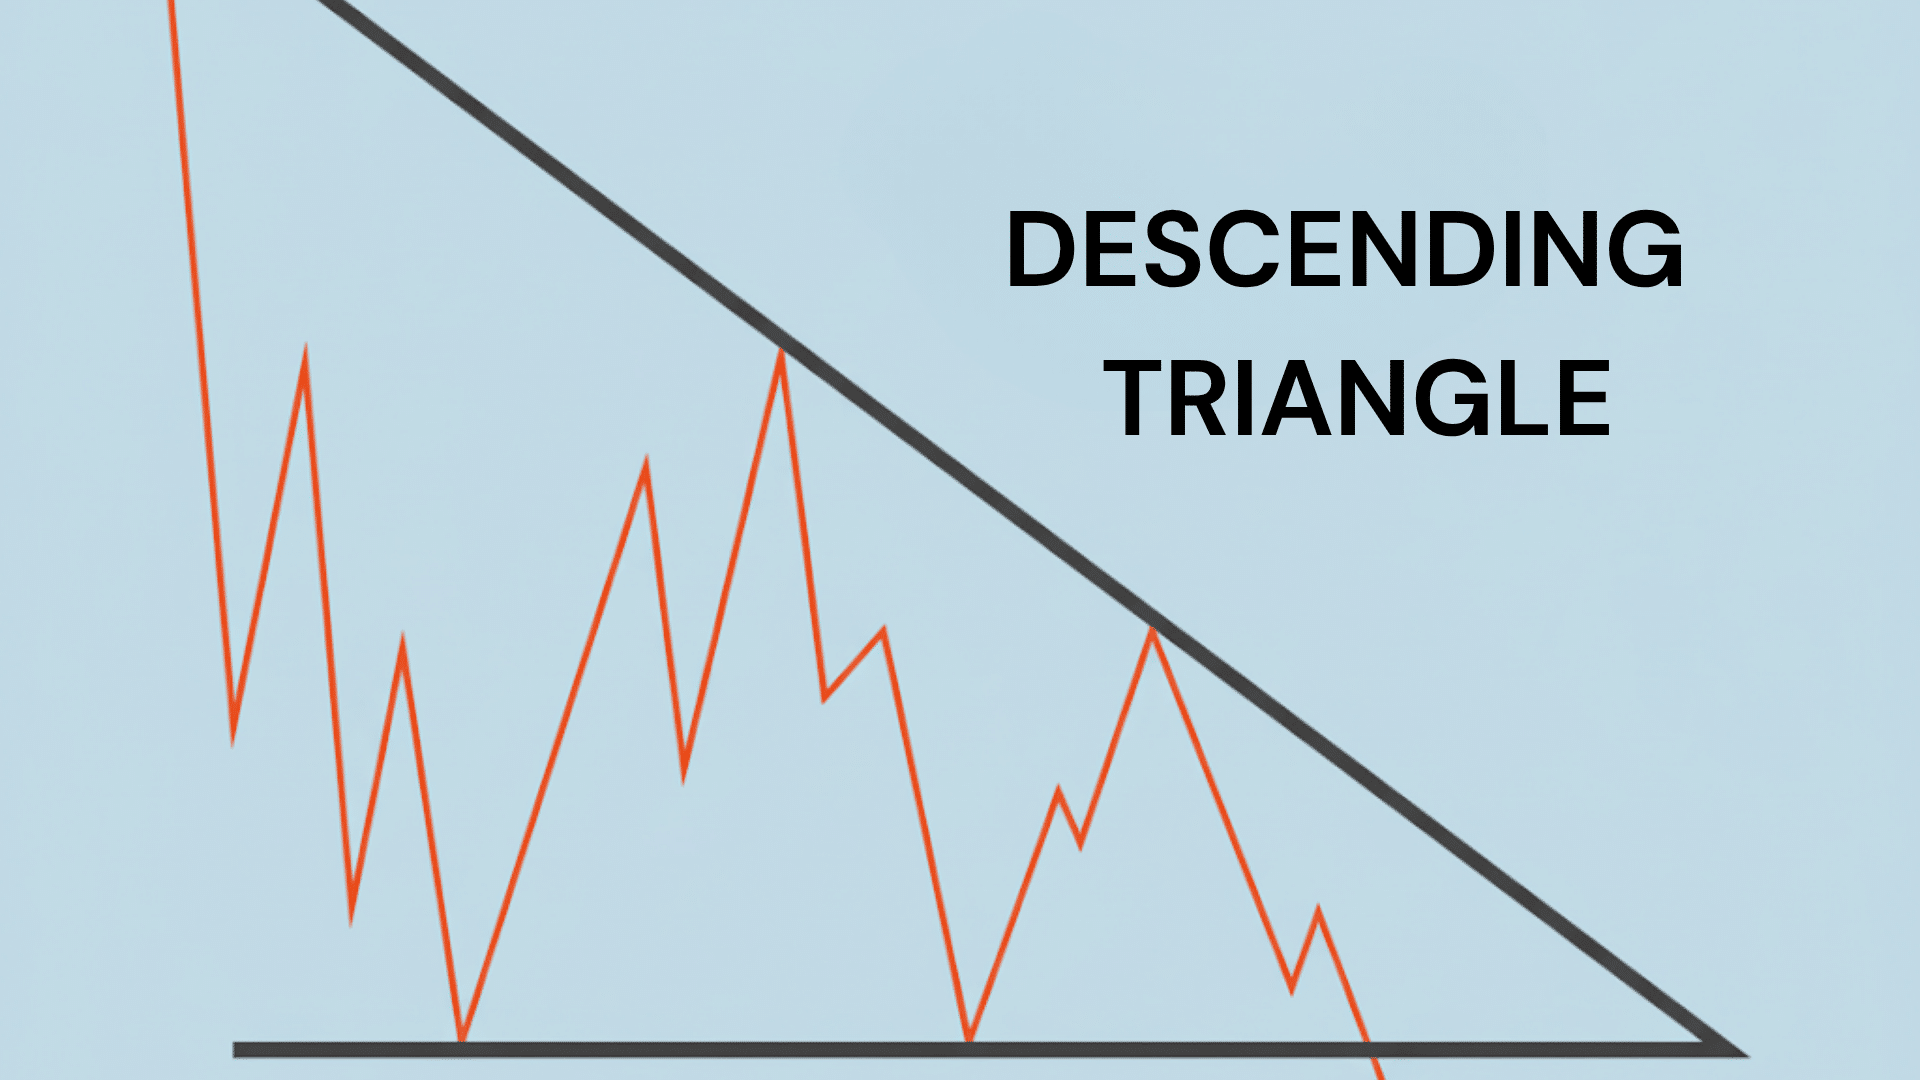
Descending Triangle Pattern: How to Identify It
Understanding how to identify the descending triangle pattern is important for traders. This pattern helps forecast price movements based on past trends. Here are the key points to spot it clearly on a price chart:
- The descending triangle appears as a right-angled triangle on price charts, featuring a downward-sloping resistance line and a flat support line.
- To spot it visually, watch for a series of lower highs forming the slanting top line and nearly equal lows forming the flat bottom.
- Recognizing the pattern is easier within a larger downtrend or consolidation phase because it often signals bearish continuation or reversal.
- This pattern can appear on various timeframes, like daily, weekly, or intraday charts.
- Patterns on longer timeframes are generally more reliable for predicting future price moves compared to those on shorter timeframes.
Recognizing these clues can help traders make better decisions based on the descending triangle pattern’s signals.
How to Trade Using the Descending Triangle Pattern?
Spotting the pattern is only half the battle. Knowing when and how to enter your trade makes all the difference. Let’s break down the exact steps you need to follow for trading this pattern successfully.
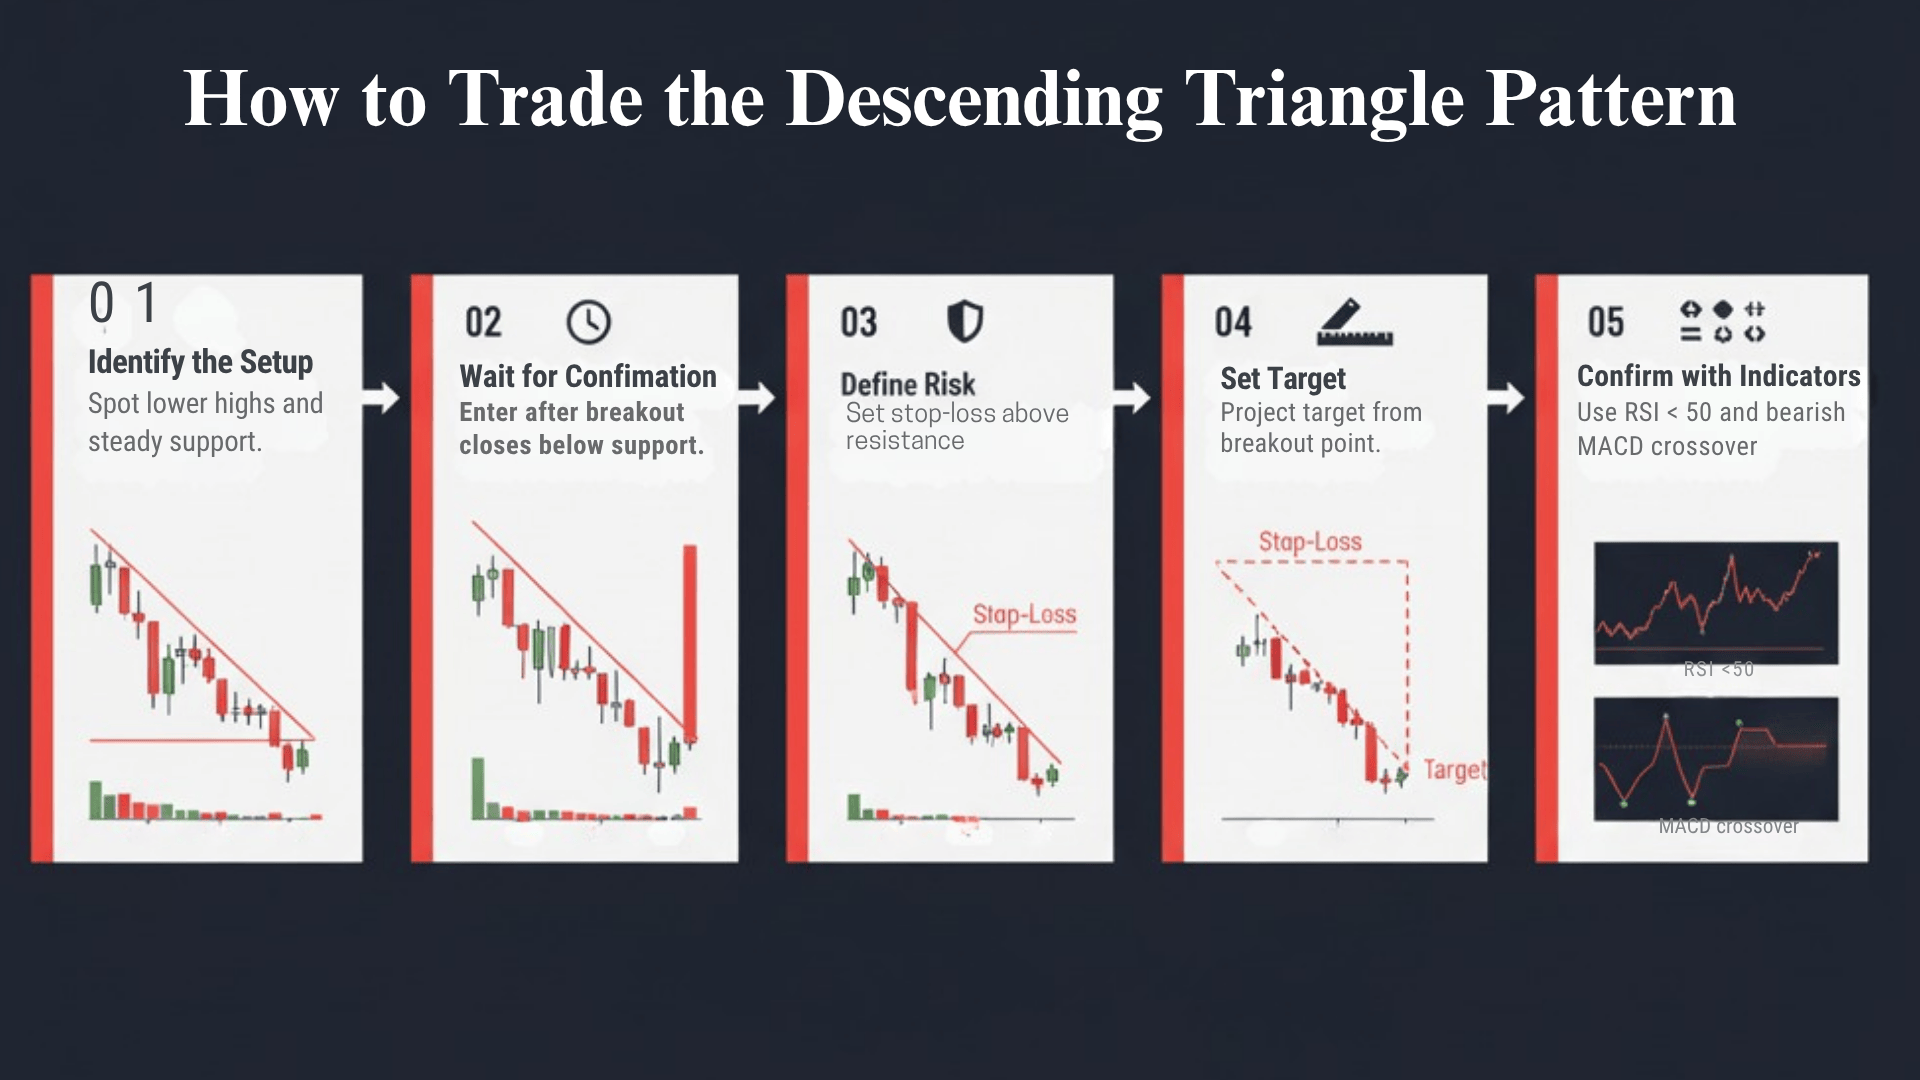
Step 1: Identify the Setup
Start by confirming the pattern structure on your chart. Look for at least two lower highs that form a descending line. You also need two similar lows creating a flat support base.
Check that the trendlines converge toward each other. Volume should be decreasing as the pattern develops. These elements together confirm you have a valid descending triangle.
Step 2: Wait for Confirmation
Never enter a trade before the breakout happens. Wait for the price to close below the support level with higher than average volume. A candle close is more reliable than just a quick touch.
Conservative traders should wait for a retest of broken support. Price often comes back to test the old support as new resistance. This second touch offers a safer entry with better risk management.
Step 3: Define Risk
Set your stop-loss above the last swing high in the pattern. This protects you if the breakout fails and the price reverses. Alternatively, place it just above the descending trendline.
Your stop should be far enough to avoid normal price noise. But keep it close enough to limit losses if you’re wrong. Never trade without a clear stop-loss in place.
Step 4: Set Target
Use the measured move technique to calculate your profit target. Measure the pattern’s height and subtract it from the breakout point. This gives you a logical price objective based on the pattern.
You can also take profits in phases at different levels. Book partial profits at a 1:1 risk-reward ratio, then let the rest run to 1:2. This approach balances safety with profit potential.
Step 5: Add Indicator Confirmation
Technical indicators increase your confidence in the trade setup. RSI should stay below 50 before and during the breakout. This confirms bearish momentum is in control of price action.
Look for a bearish MACD crossover to strengthen your bias. Price trading below the 50-day or 200-day moving average confirms trend alignment. Multiple indicators agreeing improve your win rate significantly.
Descending Triangle Pattern: Pros and Cons
Every trading pattern has strengths and weaknesses that you need to understand before making decisions. Here are the main advantages and disadvantages of descending triangles to help you trade them effectively:
| Advantages | Disadvantages |
|---|---|
| High potential for profit if the breakout occurs | False breakouts can occur, leading to losses |
| Useful in bearish market conditions or during corrective phases of a bull market | Requires careful risk management and volume confirmation to avoid being caught in a fake-out |
| Clear entry and exit points based on support break and target projection | Patterns may take an extended time to form, requiring patience from traders |
| Easily identifiable pattern with well-defined structure on charts | Not all descending triangles result in successful breakouts or follow-through moves |
Weighing these pros and cons helps you decide when to trade descending triangles and when to stay cautious. Always combine pattern recognition with proper risk management to protect your trading capital effectively.
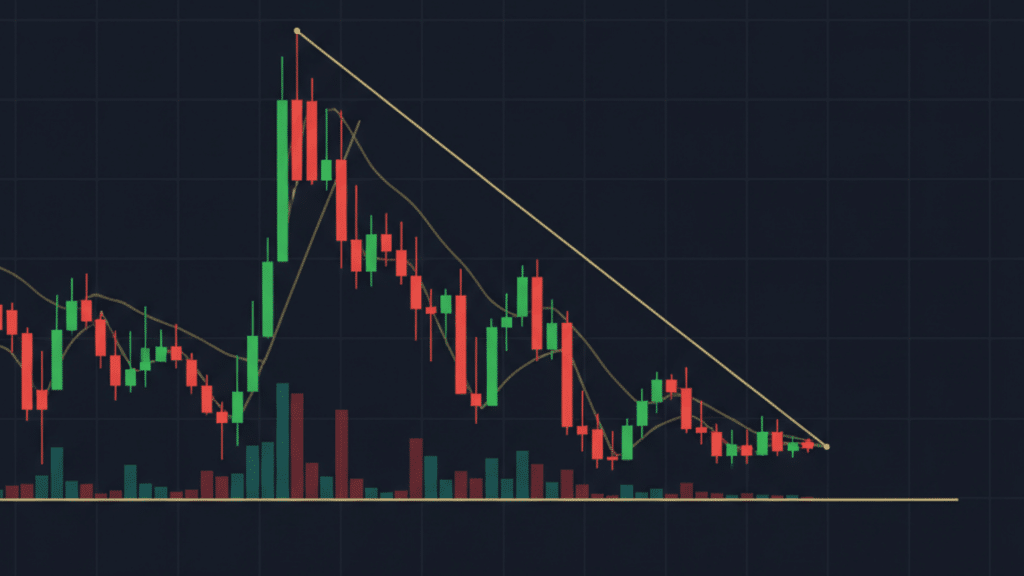
Real-World Examples of Descending Triangle Patterns

Bitcoin’s 2018 bear market offers a perfect example of this pattern in action.
The cryptocurrency formed a clear descending triangle near the $6,000 support level. Buyers kept defending this price while sellers pushed lower highs with each rally attempt.
When Bitcoin finally broke below $6,000, volume surged dramatically. The breakdown happened at $5,800 with strong selling pressure behind it.
Using the measured move technique, the target was around $3,500. Bitcoin reached this level within just a few weeks of breaking down.
Key Details:
- Support Level: $6,000
- Breakout Point: $5,800
- Measured Target: ~$3,500
- Outcome: Target achieved successfully; textbook continuation pattern
Mistakes Traders Make with Descending Triangles
Trading the descending triangle pattern can be tricky without careful attention to detail. Many traders make simple mistakes that cost money, and recognizing these common errors can help improve trading results. Here are some mistakes to watch out for:
| Mistake | Why It Hurts |
|---|---|
| Entering before breakout confirmation | Leads to false entries during consolidation |
| Ignoring the overall market context | Counter-trend triangles often fail |
| Overlooking volume | Low-volume breakouts often reverse |
| Placing the stop too tightly | Noise can trigger premature exits |
| Misidentifying triangles vs. channels | Channels have parallel lines, and triangles converge |
Avoiding these mistakes helps protect your capital and improves the chances of successful trades. Always stay patient and use sound risk management.
Busted (Failed) Descending Triangles
Not every descending triangle plays out as expected. Sometimes the pattern fails when the price breaks below support but quickly reverses upward. This traps short-sellers who entered too early.
The failure occurs when:
- Price reclaims the broken support level
- Price closes above the descending resistance line
These two conditions together invalidate the bearish setup completely. This reversal often triggers a strong rally due to short covering.
Trapped bears rush to exit, creating buying pressure that pushes prices higher. Exit losing short positions immediately when you see invalidation conditions occur.
Descending Triangle vs Other Chart Patterns
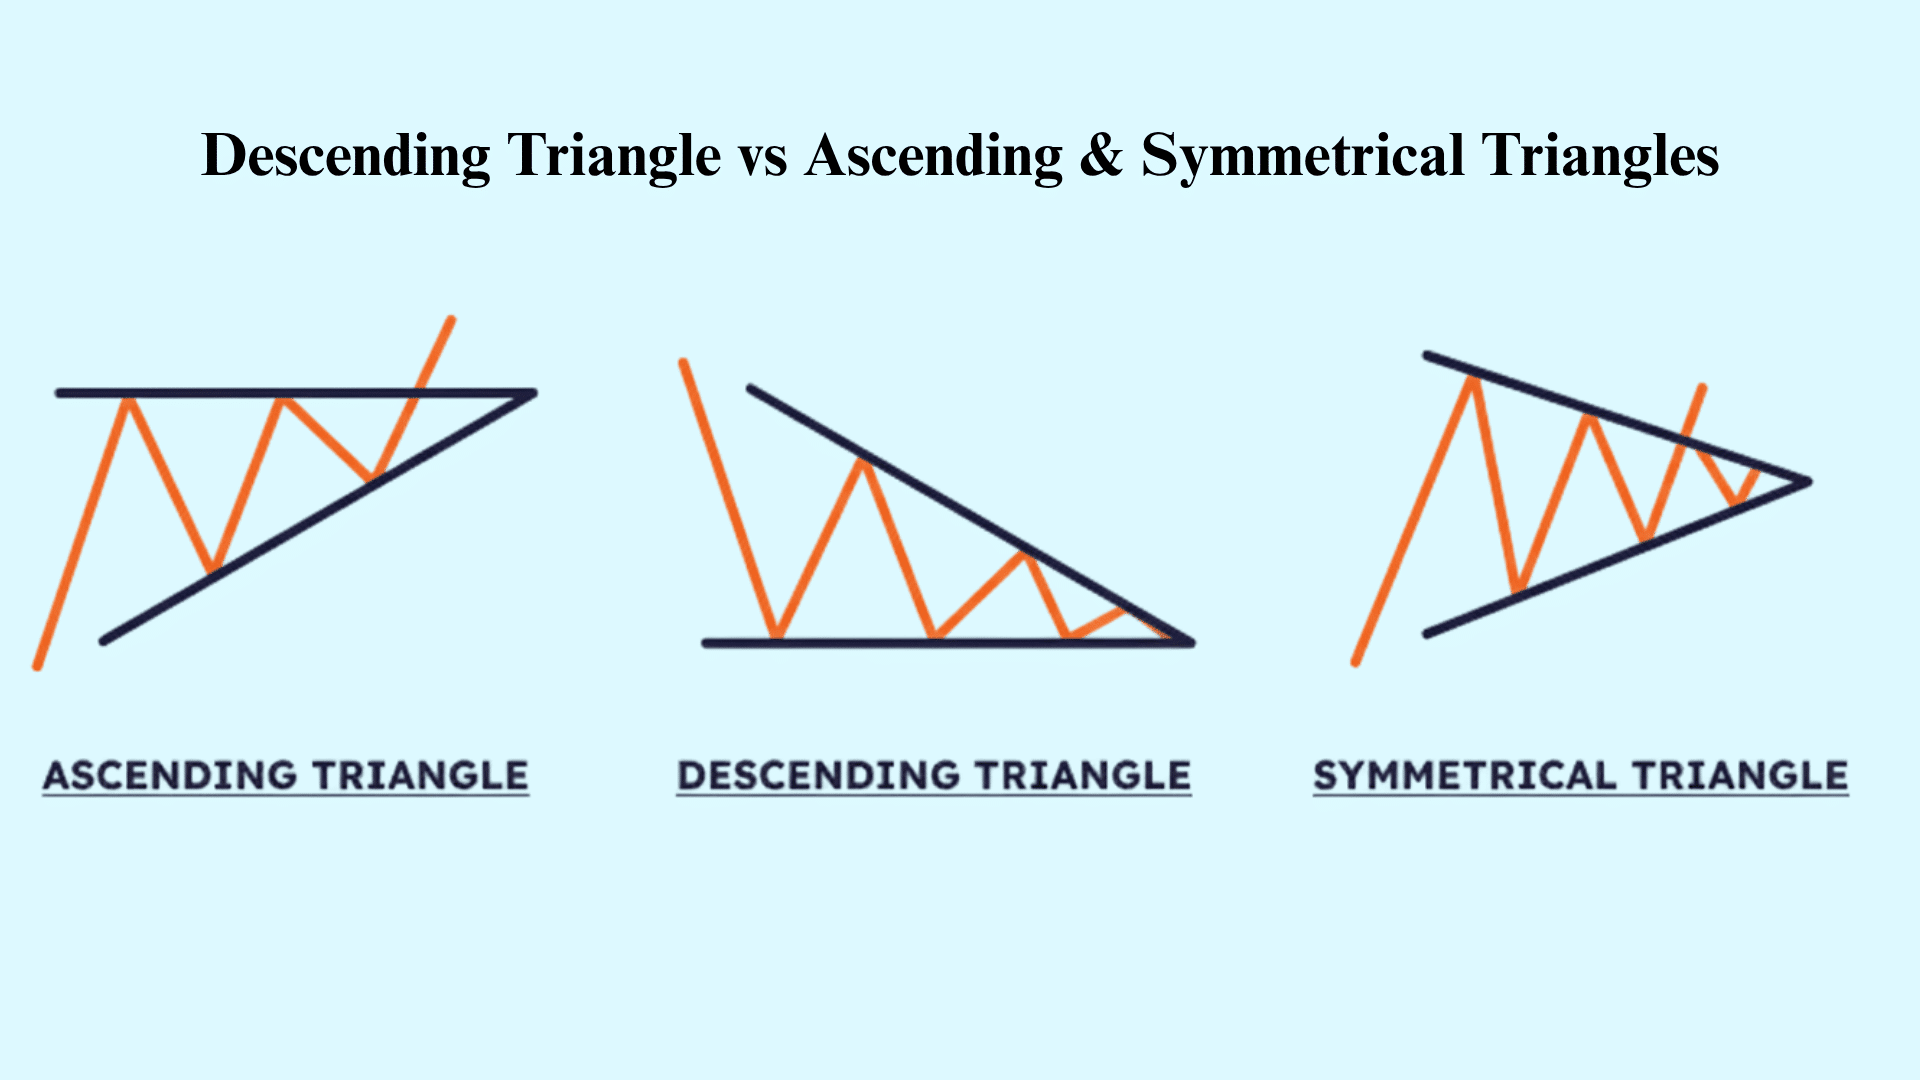
While the descending triangle is bearish, not all triangle patterns signal a price drop. Here’s how it stacks up against other common formations so you can tell them apart with confidence.
| Pattern | Flat Side | Slope Direction | Market Bias | Typical Breakout |
|---|---|---|---|---|
| Descending Triangle | Flat bottom | Downward top line (lower highs) | Bearish continuation | Usually downward, below the support |
| Ascending Triangle | Flat top | Upward bottom line (higher lows) | Bullish continuation | Usually upward, above resistance |
| Symmetrical Triangle | None (both sides slope) | Converging lines | Neutral / depends on trend | Either direction, confirm with volume |
Summing It Up
The descending triangle gives you clear warning signs before prices drop, helping you protect profits or find shorting opportunities. The simple structure, with its lower highs and flat support, makes it easy to spot once you practice.
Wait for confirmed breakouts with rising volume rather than jumping in early based on the formation alone. I recommend setting stop losses above recent highs to limit risk if the pattern fails or produces false signals.
Combine descending triangle analysis with broader market trends for better trade timing and higher success rates.
Practice identifying these formations on historical charts before risking real money in live markets or demo accounts.
What questions do you have about spotting or trading this pattern? Share your thoughts in the comments below!