Have you seen a stock dropping lower and lower, but something feels off about the way it’s falling?
Those tiny changes in selling strength often reveal major turning points that most traders miss completely while panicking.
Smart traders know how to read these hidden signals in chart patterns before the crowd figures it out.
I’m going to show you exactly how to spot when downtrends are losing steam and position yourself ahead of the bounce.
You’ll learn to identify key levels where buyers finally overpower sellers and take control of price action.
By mastering the inverse head and shoulders pattern, you’ll catch bullish moves early instead of chasing them after everyone else jumps in.
This content is for informational purposes only. Always consult a qualified financial advisor before making any investment or trading decisions.
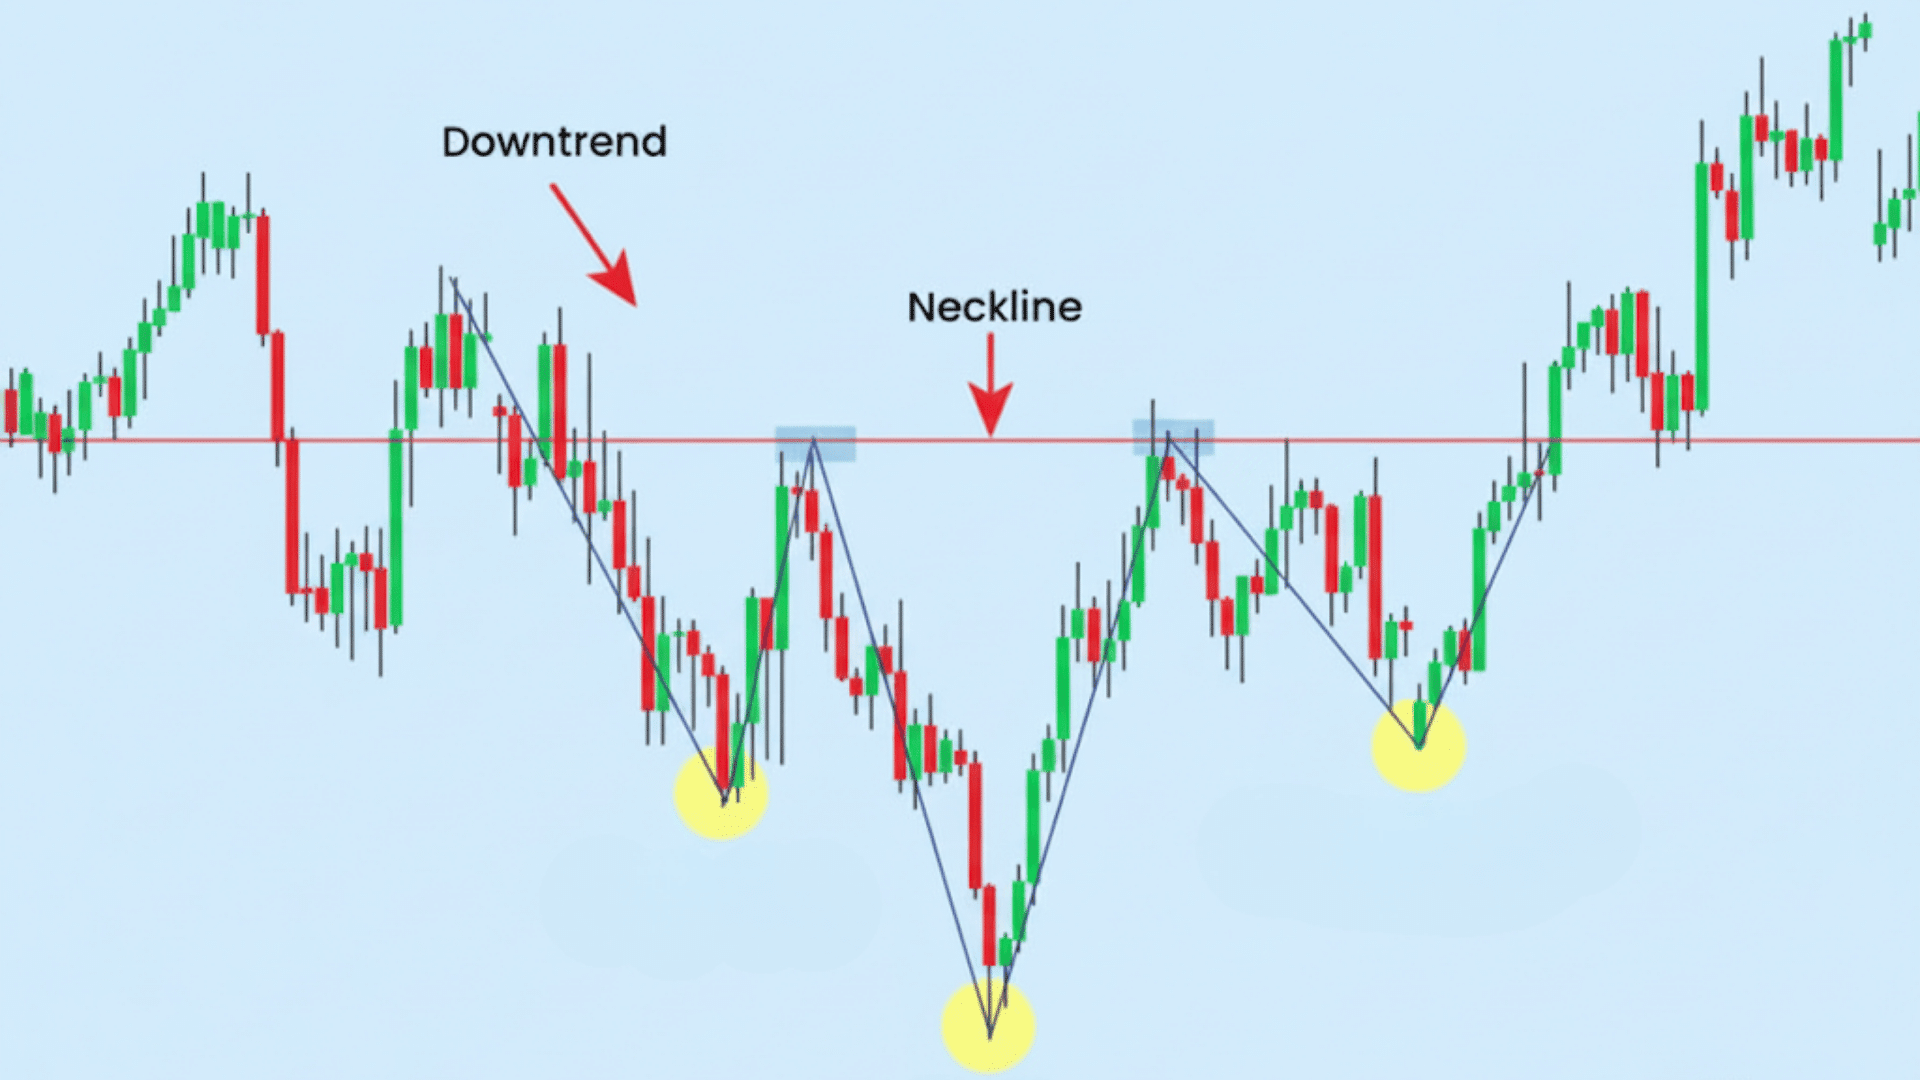
What Is the Inverse Head and Shoulders Pattern?
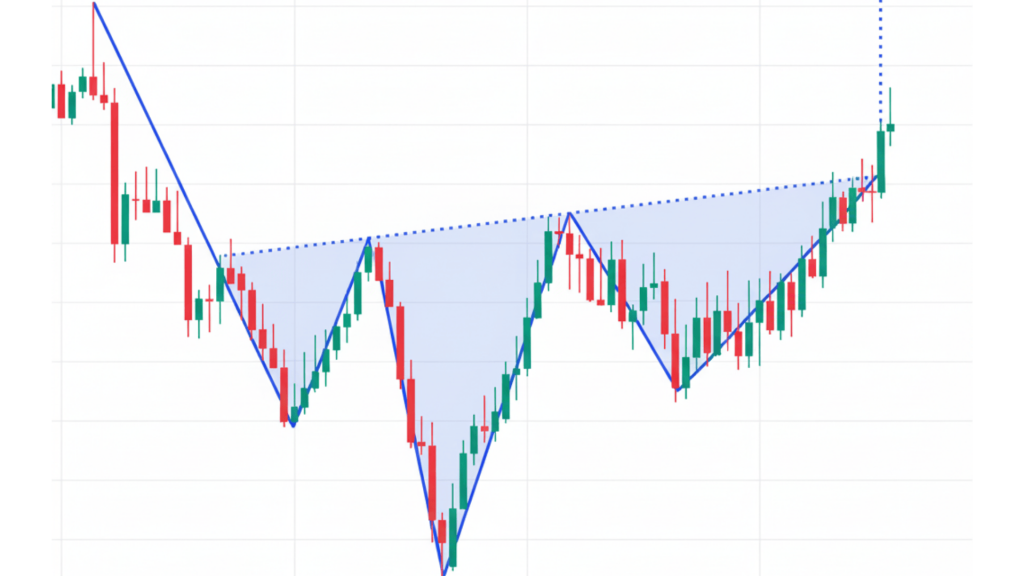
The inverse head and shoulders pattern is a bullish reversal formation that shows up after a downtrend runs out of steam.
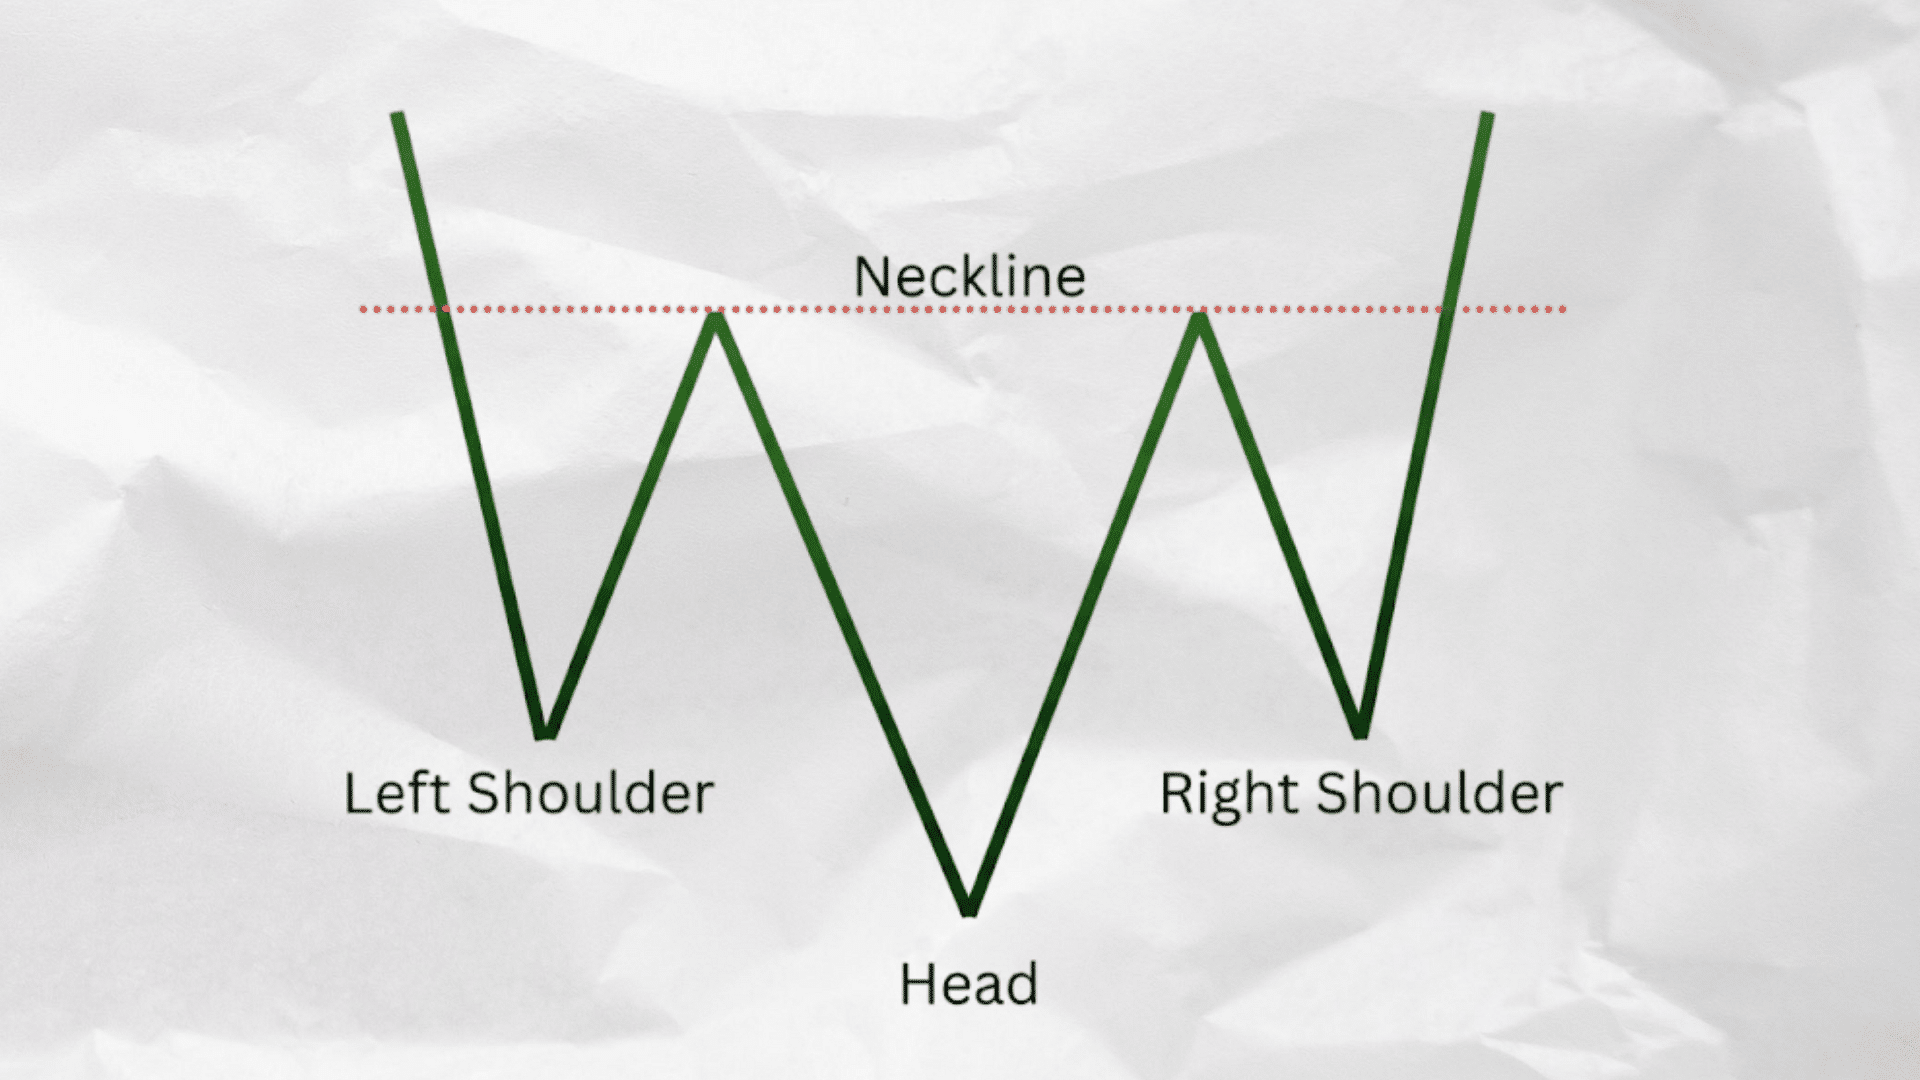
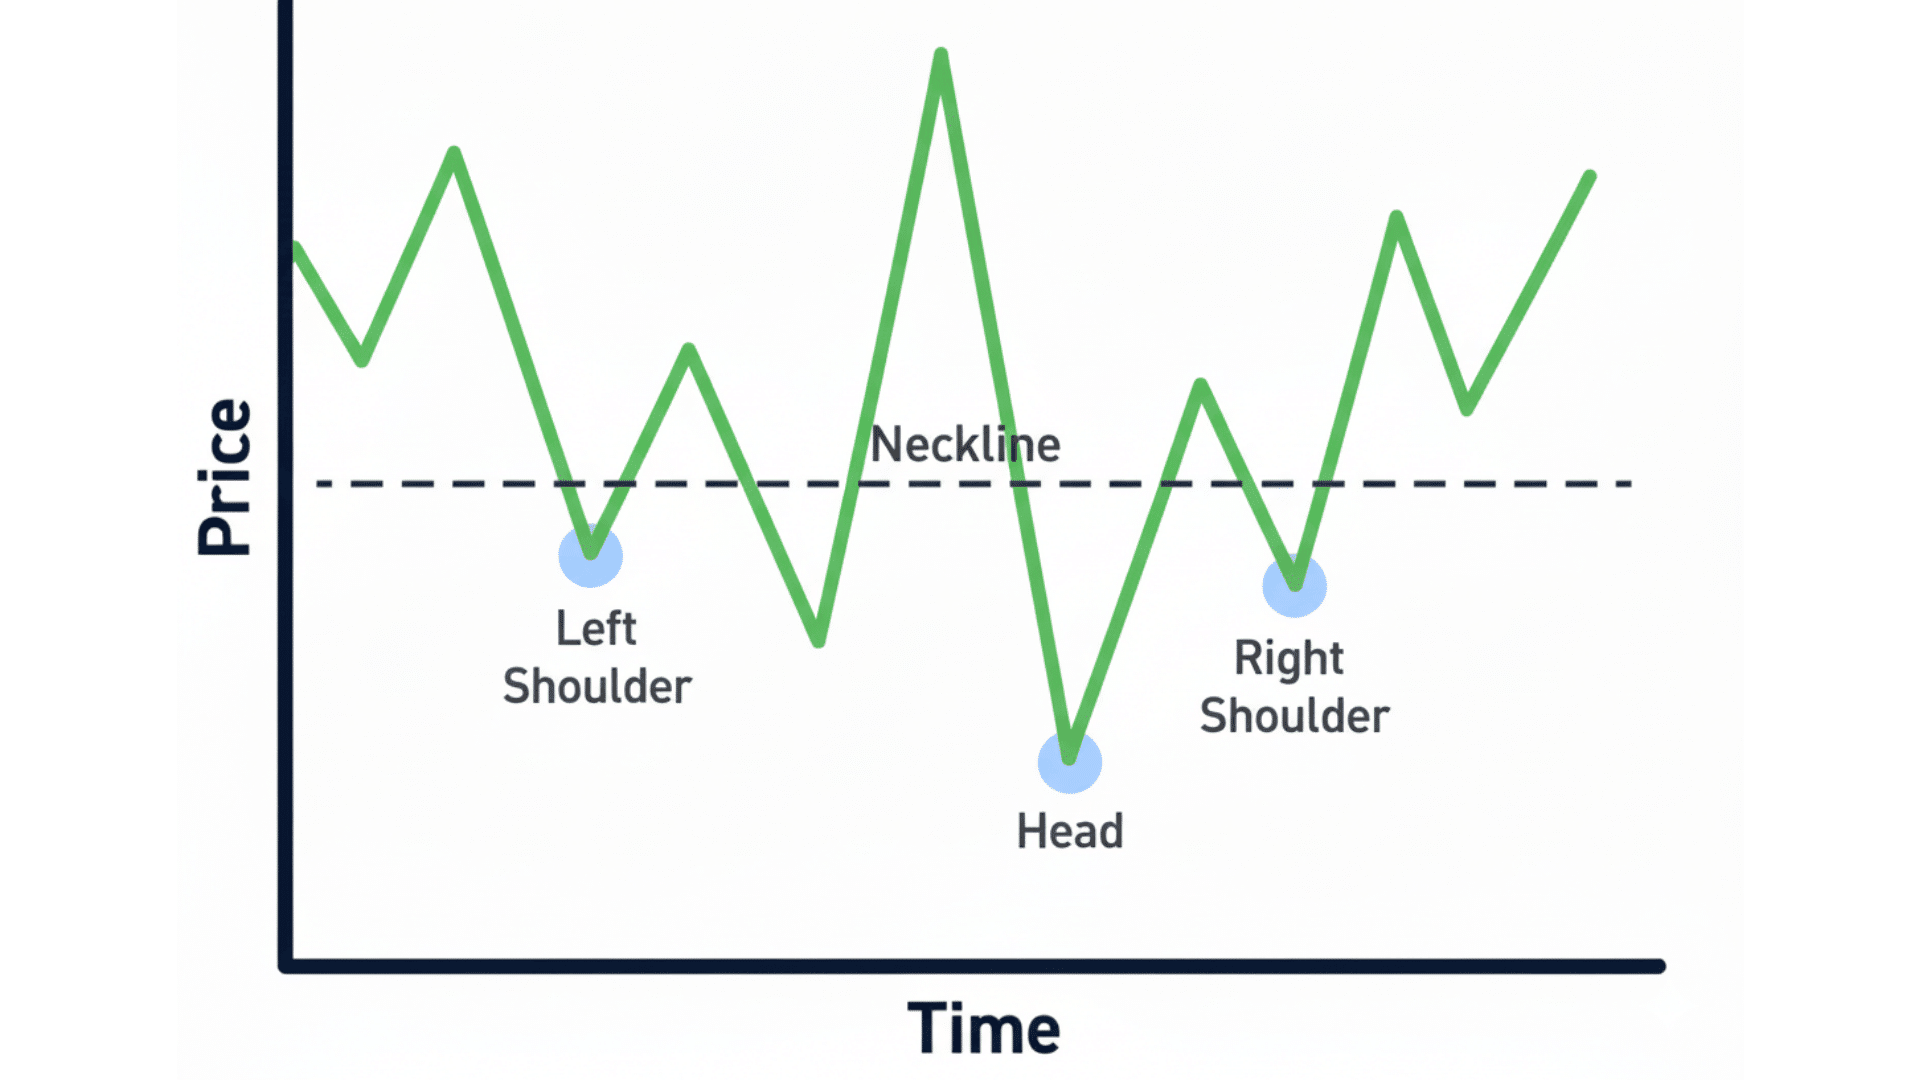
This pattern consists of three troughs, with the middle one dropping lower than the two on either side.
The left and right troughs are called shoulders, while the deepest middle trough is called the head. A neckline connects the highs between these three troughs and acts as the key resistance level to watch.
When price breaks above this neckline with strong volume, it confirms the pattern and signals a trend reversal.
Traders use this formation to identify when selling pressure is exhausted and buyers are ready to take control. The pattern helps you spot potential reversals early before a new uptrend begins.
Elements of the Inverse Head and Shoulders Pattern
I’ve broken down the inverse head and shoulders pattern into four key parts that you need to master for successful trading. Here are the essential parts of the inverse head and shoulders pattern:
1. Left Shoulder
Price drops to a new low during the downtrend. Sellers dominate, pushing the market down.
Then buyers step in briefly, causing a small bounce upward. This creates the first trough of the pattern. The rebound is usually modest and short-lived.
2. Head
The market falls again, this time much deeper than the left shoulder. Panic selling reaches its peak as fear spreads among traders. But then strong buying pressure emerges, lifting the price sharply back up.
This forms the lowest point of the entire pattern. The recovery from the head is often faster and more forceful than from the left shoulder.
3. Right Shoulder
Price dips once more, but fails to reach the depth of the head. This shallower low reveals that sellers are losing strength. Buyers are becoming more confident and stepping in earlier.
The right shoulder typically forms at a similar level to the left shoulder. When the right shoulder stays above the head’s low, it confirms weakening bearish momentum.
4. Neckline
This is the resistance line drawn across the peaks between the three troughs. It connects the high points that formed after the left shoulder and after the head.
The neckline acts as a critical barrier; when the price breaks above it with volume, the pattern confirms. Most traders wait for a clean close above this line before entering positions.
Types of Necklines:
| Neckline Type | Description | Signal Strength |
|---|---|---|
| Flat Neckline | Runs horizontally across peaks | Most common and easiest to trade. Clear breakout level. |
| Upward Sloped | Angles upward from left to right | Stronger bullish momentum. Higher success probability. |
| Downward Sloped | Angles downward from left to right | Weaker signal. Less reliable. Use tighter risk management. |
Market Psychology Behind the Pattern

The inverse head and shoulders pattern tells a story about trader emotions. Each stage shows a shift in sentiment from fear to confidence.
- Left Shoulder: Pessimism Dominates: Fear controls the market. Sellers push prices to new lows. A brief bounce occurs, but nobody trusts it.
- Head: Capitulation and Exhaustion: Panic selling peaks as prices crash the most deeply. Desperate traders finally give up and exit. Smart buyers start accumulating quietly at these lows.
- Right Shoulder: Optimism Returns: Price drops again, but not as far. Sellers are weaker now. Hope replaces fear as the downtrend loses steam.
- Breakout: Confidence Takes Over: Price breaks above the neckline. Buyers take full control of the market. Shorts cover their positions, fueling the rally higher.
Understanding this emotional cycle helps traders anticipate reversals rather than react to them. When you recognize these sentiment shifts early, you can enter trades before the crowd catches on.
This gives you better entry prices and higher profit potential. Most traders wait for confirmation and miss the best opportunities. By reading market psychology, you position yourself ahead of the masses.
How to Identify an Inverse Head and Shoulders on Charts
Spotting an inverse head and shoulders on your charts requires following a clear process with specific checkpoints. You need to verify each component before calling it a valid pattern worth trading. Here are the five steps to identify this bullish reversal pattern accurately:
- Identify a clear prior downtrend: Ensure the price has been falling consistently before the pattern forms, with at least several weeks of lower lows.
- Look for three distinct troughs: Find three valleys where the middle one drops lower than the two on either side, forming the head.
- Draw the neckline across the highs: Connect the peaks between the left shoulder and head, then extend to the right shoulder peak.
- Watch for volume increase during breakout: Volume should spike when price breaks above the neckline to confirm buyers are taking control.
- Use indicators for confirmation: Check RSI, MACD, and moving averages to verify momentum is shifting bullish alongside the pattern formation.
Practice identifying these patterns on historical charts before trading them with real money in live markets. Always wait for the neckline break with volume confirmation before entering any position based on this setup.
How to Trade the Inverse Head and Shoulders Pattern
Trading the inverse head and shoulders pattern requires precise entry timing and proper risk management for consistent success. Here’s how to execute trades based on this bullish reversal pattern:
1. Entry: Buy After Neckline Break
Wait for a candle to close above the neckline with strong volume. This confirms buyers have taken control, and the pattern is valid.
Alternatively, you can enter on a pullback whenthe price retests the neckline and holds it as support. The retest entry often provides a better risk-to-reward ratio.
2. Stop-Loss: Place Below Right Shoulder
Set your stop-loss just below the lowest point of the right shoulder. This placement keeps your risk manageable while giving the trade room to breathe.
If the price falls below the right shoulder, the pattern has likely failed, and you should exit.
3. Profit Target: Measure and Project
Calculate the vertical distance from the head’s low to the neckline. Then project that same distance upward from the neckline breakout point.
This gives you a logical price target based on the pattern’s structure. Many traders take partial profits at this target and let the rest run.
4. Risk Ratio: Aim for 2:1 or Better
Your potential profit should be at least twice your risk amount. If the setup doesn’t offer a 2:1 reward-to-risk ratio, consider skipping the trade.
Maintaining this discipline ensures you stay profitable over the long term, even with a moderate win rate.
5. Confirmation: Wait for Volume and Indicators
Never trade the pattern on the neckline break alone. Look for volume at least 50% above average during the breakout.
Also, check that momentum indicators like RSI or MACD support the bullish move. Multiple confirmations reduce the chance of getting caught in a false breakout.
False Breakouts & Re-Entry Plan
Sometimes price breaks above the neckline but then falls back below it. This can shake out early buyers and trap those who entered too soon. Here’s how to handle it:
- Wait for price to reclaim the neckline with volume: Don’t rush back in until buyers prove they’re serious again.
- Re-enter only after a second close above the neckline: One fake-out is enough; demand stronger proof the second time.
- Move stop-loss tighter, just under the new right-shoulder zone: Adjust your risk management since the pattern has already failed once.
Applying the Inverse Head and Shoulders Across Markets
The inverse head and shoulders pattern works across all financial markets but behaves differently based on asset class characteristics. Here’s how this bullish reversal pattern performs in stocks, forex, and cryptocurrency markets:
| Market | Pattern Performance | Trading Tips |
| Stocks and ETFs | The pattern shows up clearly in equity markets with strong institutional participation and reliable trends | Check daily volume spikes on breakout to confirm real buying interest from larger players |
| Forex Markets | Currency pairs respect this formation well, especially around major round numbers and support levels | Allow more time for pattern completion, as forex moves more slowly than stocks in most cases |
| Cryptocurrency | Digital assets form this pattern often, but breakouts fail more frequently due to wild swings | Trade with tight risk management and smaller sizes because crypto reversals happen without warning |
Understanding how the pattern behaves in each market helps you adjust your trading approach for better results. Always adapt your stop loss sizes and position sizing based on the specific market volatility you’re trading.
Tools to Validate the Inverse Head and Shoulders
Using confirmation tools alongside the inverse head and shoulders pattern improves your trading accuracy. These indicators help you filter out false signals and focus on high-probability setups. Never rely on the pattern alone; always check for supporting evidence.
- Volume Surge: Volume should spike at least 50% above average during the neckline breakout to confirm genuine buying pressure.
- RSI Divergence: When the RSI forms higher lows while the price creates the head’s lower low, it signals a shift in momentum to bullish before the breakout.
- Moving Average Crossovers: A shorter moving average crossing above a longer one after the breakout confirms the trend has flipped from bearish to bullish.
- MACD Bullish Cross: The MACD line crossing above the signal line around the right shoulder or breakout adds momentum confirmation to the pattern.
Combining these tools filters out weak patterns and keeps you in only the strongest setups. The more confirmations you have, the higher your probability of success.
Benefits and Drawbacks of the Inverse Head and Shoulders
The inverse head and shoulders pattern offers clear advantages but also comes with limitations you should understand before trading it. Here’s a balanced look at the strengths and weaknesses of this bullish reversal pattern:
| Benefits | Drawbacks |
| Strong signal for spotting trend reversals from down to up | False breakouts happen when volume doesn’t confirm the move |
| Simple to recognize once you practice finding the three troughs | The pattern takes a long time to develop completely on charts |
| Gives you exact levels for entering and exiting trades safely | Doesn’t work well when markets move sideways without clear trends |
Understanding both the advantages and disadvantages helps you set realistic expectations when trading this formation. Always combine pattern recognition with volume analysis and other confirmation tools for better trading results overall.
Mistakes to Avoid When Trading This Pattern
Learning what not to do is just as important as knowing the right way to trade this formation. Here are the four most common errors you need to avoid:
- Entering Too Early: Jumping into trades before the neckline breakout occurs can lead to losses if the pattern fails to complete properly.
- Ignoring Volume: Trading the breakout without checking if volume confirms it often results in false signals that quickly reverse against you.
- Misidentifying the Pattern: Confusing random price bounces or consolidation zones with a true inverse head and shoulders costs you money on bad trades.
- Chasing After Breakout: Entering too late after the price has already run up significantly reduces your profit potential and worsens your risk-reward ratio.
Avoiding these mistakes dramatically improves your success rate when trading this powerful reversal pattern in any market. Always verify every component of the pattern before risking real capital on any trade setup you identify.
Case Study: Tesla Inverse Head and Shoulders

Tesla’s stock during 2019-2020 provides a textbook example of the inverse head and shoulders pattern in action. This trade delivered substantial profits to those who correctly identified and traded it.
The Setup Tesla’s price action formed three clear troughs over several months. The left shoulder appeared first, with the price dropping to $250 before bouncing back to $280. Then the head formed as the price plunged deeper to $176, the panic-selling phase. Finally, the right shoulder developed at $230, indicating that sellers couldn’t push any lower.
Neckline Break and Entry The neckline sat at the $300 level, connecting the peaks after each trough. When Tesla broke above $300 with heavy volume, the pattern was confirmed. Traders who entered here had clear confirmation that buyers had taken control.
Measuring the Target: The distance from the head ($176) to the neckline ($300) was $124. Adding this same distance above the neckline projected a target of $424. Tesla hit this target, rewarding traders with roughly 40% gains from the breakout.
Why It Worked: Every element aligned perfectly, clear pattern structure, volume confirmation, and proper technical execution. This mirrors findings from Carol Osler and P.H. Kevin Chang at the New York Fed, whose research proved head-and-shoulders patterns generate consistent profits across markets when traded with discipline.
Strategies to Trade This Pattern Accurately
Improving your success rate with the inverse head and shoulders pattern requires using advanced techniques that professional traders rely on. Here are five proven tips to boost your pattern trading accuracy and filter out weak setups:
- Combine with Fibonacci retracements: Use Fibonacci levels to identify where price might pause or reverse after the neckline breakout confirmation.
- Trade on higher timeframes: Daily and weekly charts produce more reliable signals than hourly charts because they filter out market noise.
- Avoid low-volume sessions: Skip trading during holidays or Asian session hours when volume is light and breakouts often fail.
- Check multiple timeframes: Confirm the pattern appears on both daily and weekly charts before committing capital to any trade.
Applying these advanced techniques separates consistently profitable traders from those who struggle with pattern recognition alone. Always practice these methods on historical charts first before using them with real money in live markets.
That’s a Wrap
You now have a solid framework for spotting and trading this powerful bullish reversal formation successfully. Always wait for the neckline break with strong volume before entering any position based on this setup.
Check broader market conditions to ensure the overall market or sector shows strength to support the reversal first.
Practice identifying these patterns on historical charts until spotting them becomes automatic in real-time trading.
Start small with position sizes and build up as you gain confidence through winning trades. I track every pattern I find, and you should do the same for consistent improvement.
Drop a comment below sharing your first successful trade using this pattern or questions about your charts.