Ever heard traders talk about a “golden cross” and wondered what the fuss is about? You’re not alone. This chart pattern gets mentioned a lot in market commentary, but many investors don’t fully understand what it means or how to use it.
Here’s the thing: a golden cross can signal when a stock or index might be shifting from bearish to bullish. It’s a straightforward pattern that even beginners can spot. But like any trading tool, it has strengths and weaknesses.
In this guide, we’ll break down what a golden cross is, how it forms, real examples from the market, and whether it actually works. You’ll also learn common mistakes to avoid and how to trade using this pattern safely.
Let’s get started.
What Is a Golden Cross in Stocks?
A golden cross is a widely recognized technical analysis pattern that traders watch closely. It signals a potential shift in market momentum from bearish or sideways to bullish. Think of it as a sign that buyers might be taking control after a period of weakness or uncertainty.
Definition & Key Concept:
- What exactly is a golden cross? A golden cross happens when a short-term moving average crosses above a long-term moving average. This crossover is the key event traders look for.
- Which moving averages are used? Most traders use the 50-day moving average as the short-term MA and the 200-day moving average as the long-term MA. These are the standard time periods.
- What does this crossover mean? It suggests that recent price momentum is now stronger than the longer-term trend. Traders view this as a bullish signal that could indicate rising prices ahead.
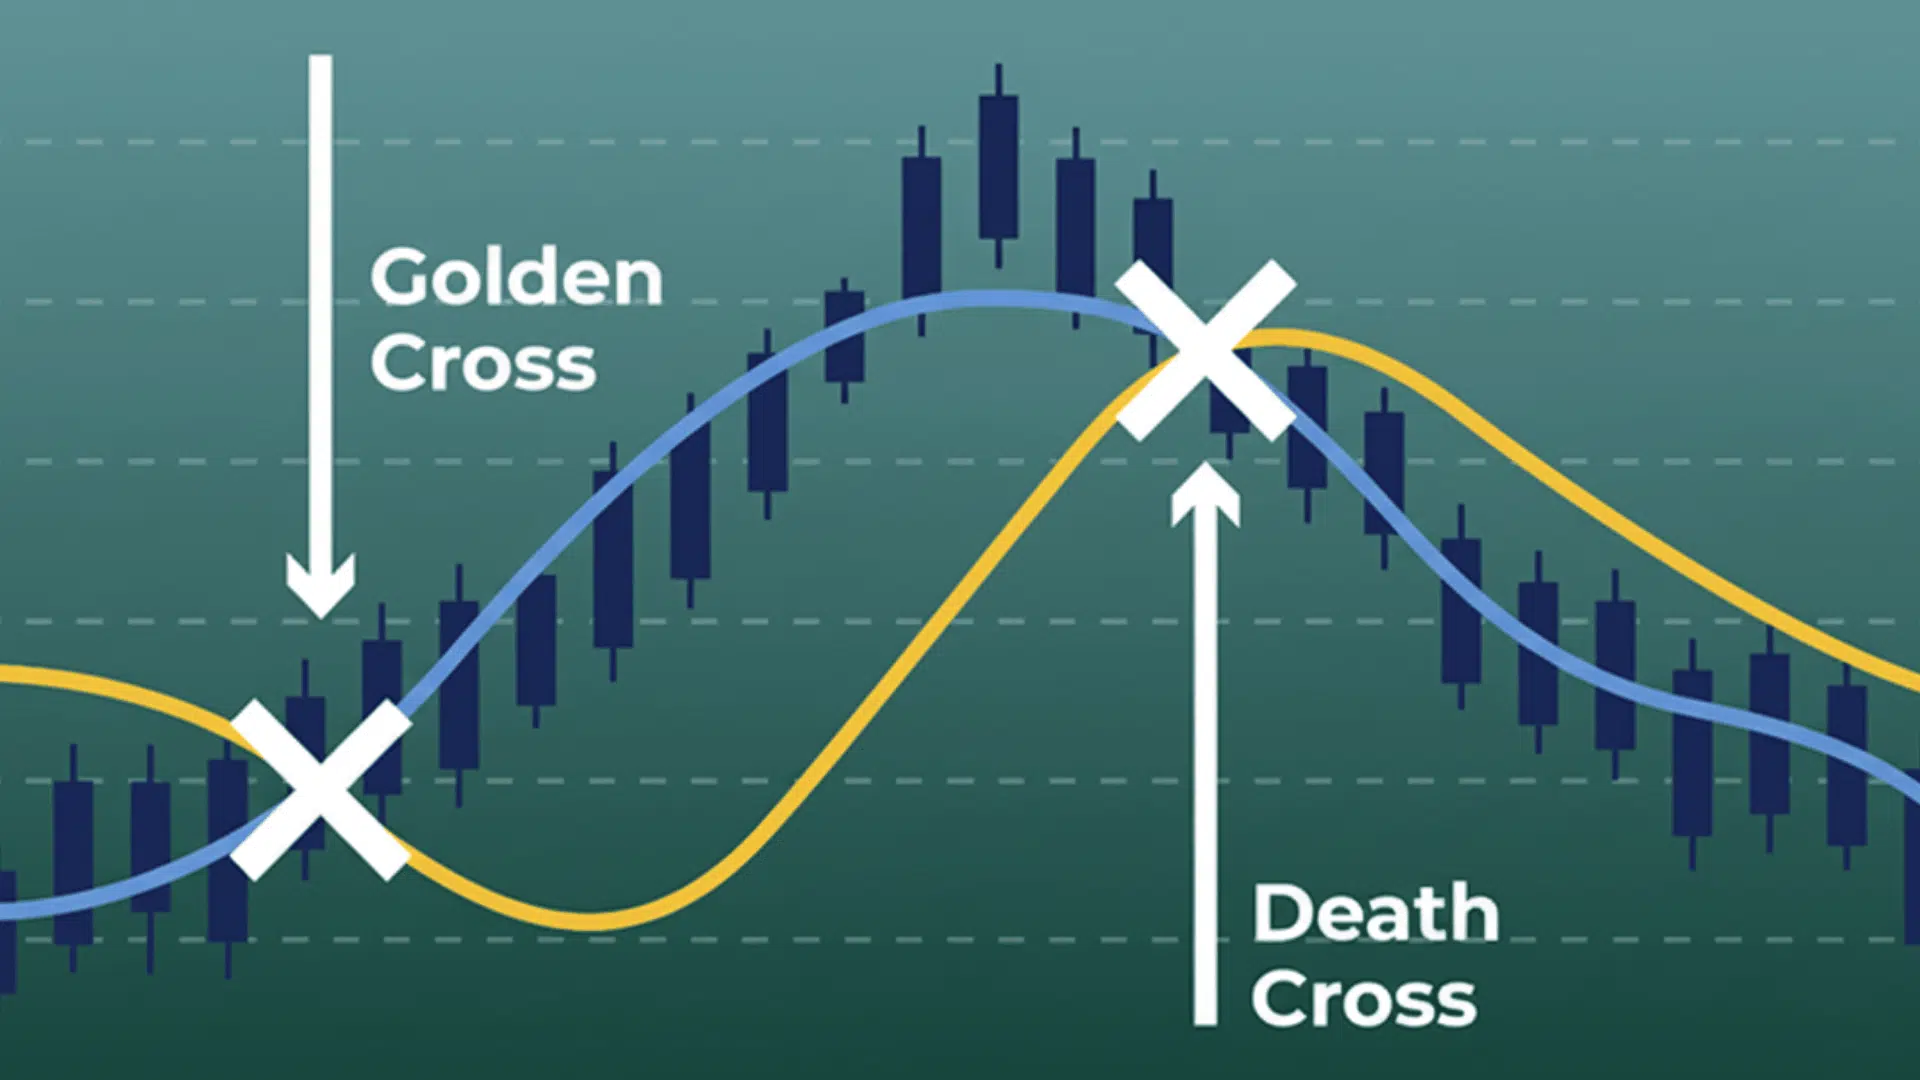
- How does it relate to the death cross? The golden cross is the opposite of a death cross. A death cross occurs when the short-term MA falls below the long-term MA, which traders see as a bearish warning sign.
Why the Name “Golden Cross”?
The term “golden cross” reflects what traders hope it represents: a golden opportunity. When the short-term trend rises above the longer timeframe, it creates a visually clear crossover on price charts.
This crossing point suggests a potential turning point in the market. The name stuck because traders see it as a valuable signal worth watching. Market analysts and financial media use this term frequently when discussing potential bullish trends.
How the Golden Cross Forms: Step by Step
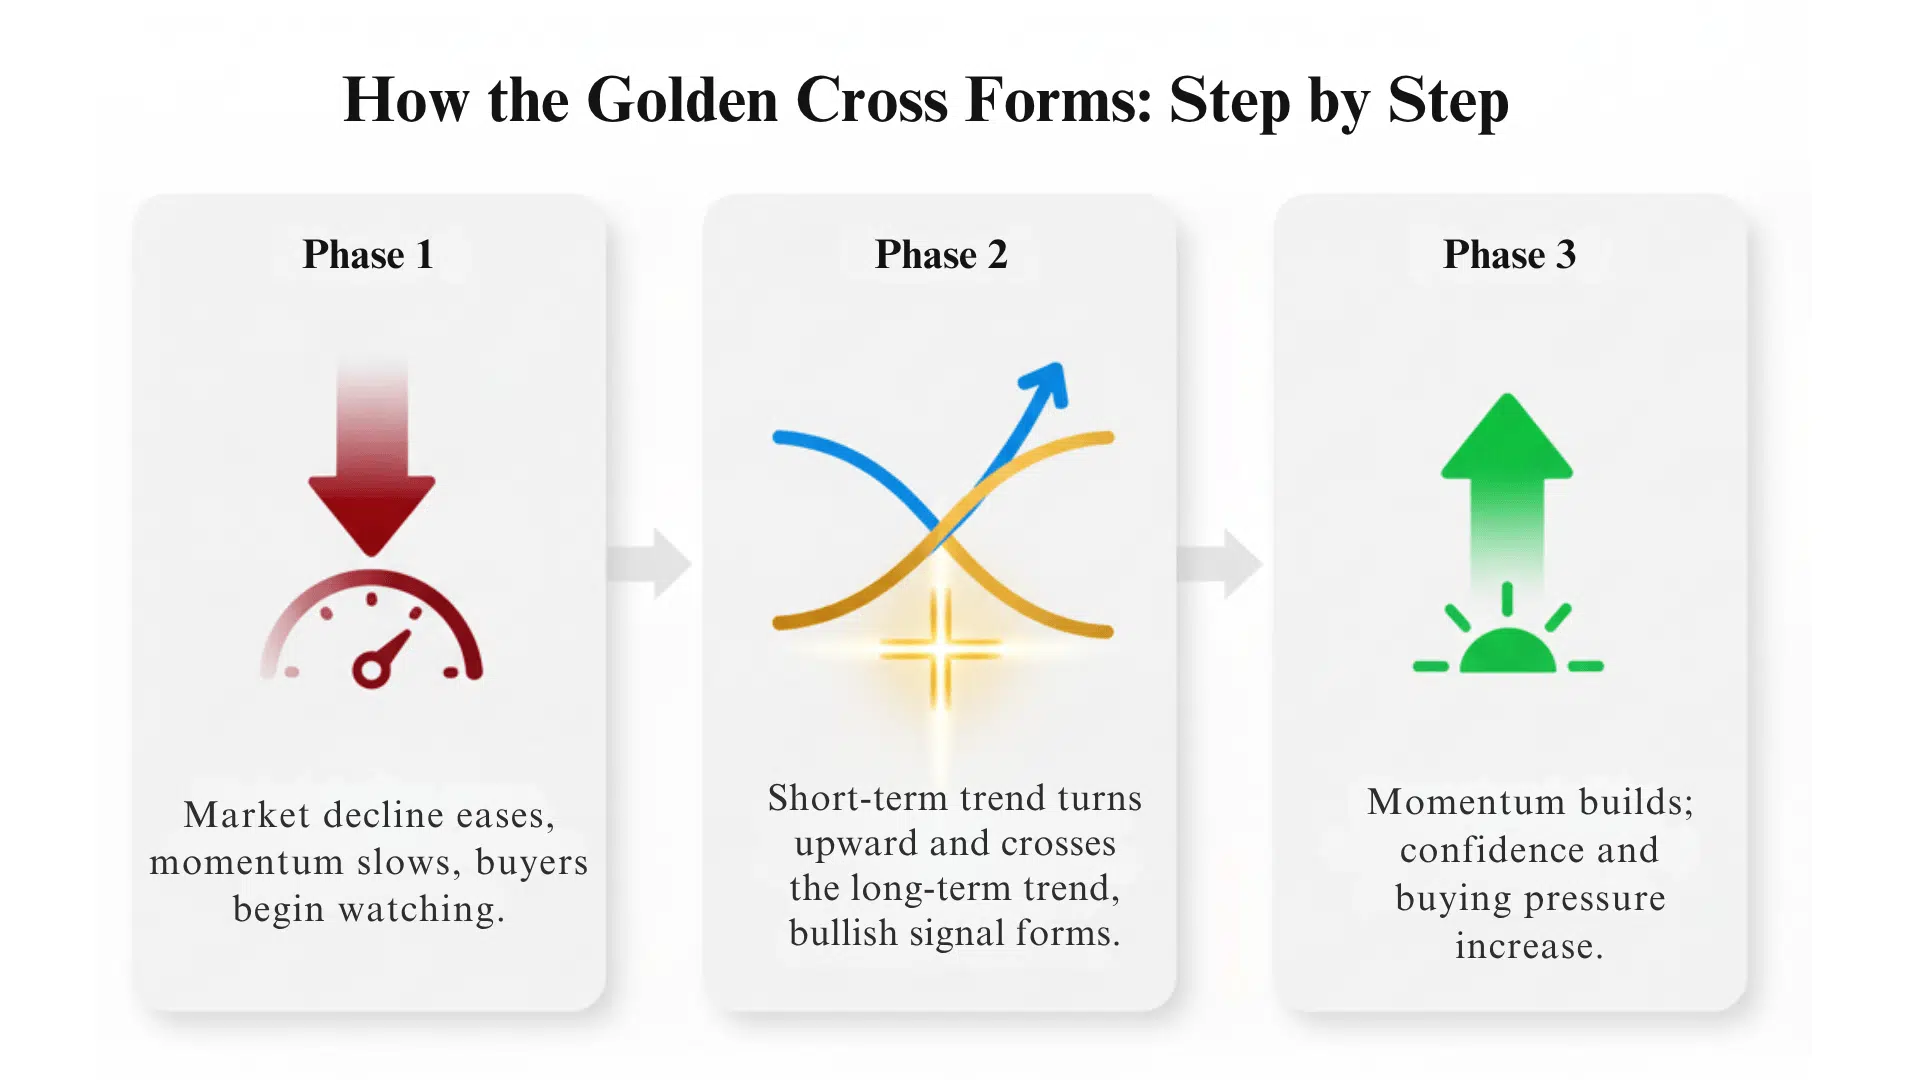
Understanding the stages helps you recognize when a golden cross might be meaningful and when it might just be noise. The formation happens in three distinct phases. Each stage tells you something different about where the market might be headed.
Stage 1: Pre-Crossover (Downtrend or Consolidation)
Before a golden cross forms, the asset has typically been in a downtrend. The short-term moving average sits below the long-term moving average during this phase.
Prices may have already bottomed out or entered a sideways trading range where they move without a clear direction. At this stage, investor sentiment remains cautious.
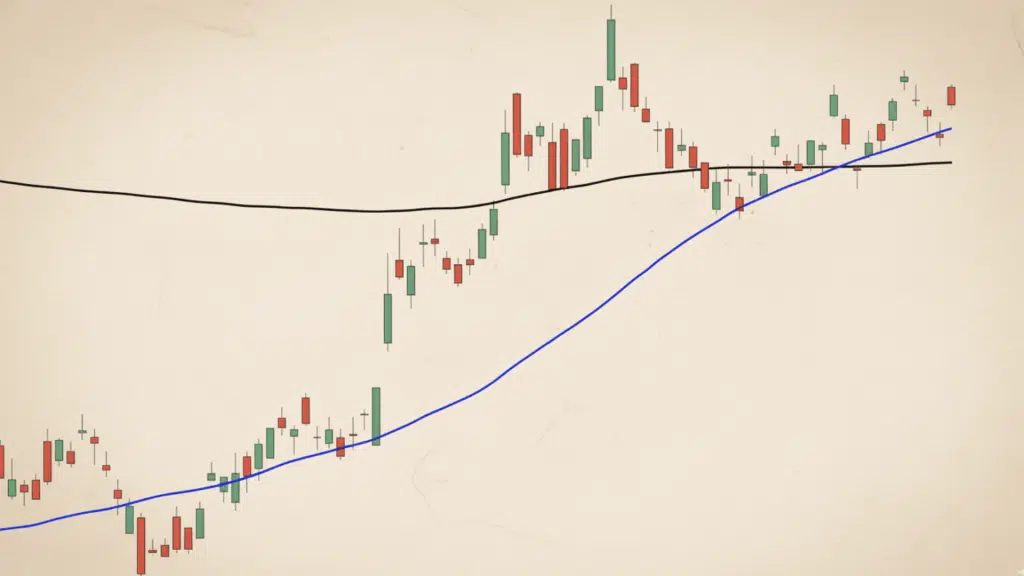
Stage 2: Crossover Event
This is when the actual golden cross happens. The short-term MA, like the 50-day, begins climbing and crosses above the long-term MA, such as the 200-day.
This crossing is the key moment traders watch for on their charts. Ideally, trading volume should pick up around this time.
Stage 3: Post-Crossover Confirmation & Trend Follow-through
After the crossover occurs, the real test begins. Price should continue moving upward while the short MA stays above the long MA. If this happens, it confirms the bullish signal.
The long-term moving average often starts acting as a support level rather than a resistance level. Momentum builds as more traders notice the pattern.
Visual Summary:
| Stage | What’s Happening | Signal Relevance |
|---|---|---|
| Pre-Crossover | Short MA below long MA; trend weak or sideways | Watch for signs of bottoming |
| Crossover | Short MA crosses above long MA | Key trigger moment |
| Post-Crossover | Short MA remains above long MA & price rises | Trend confirmed, higher conviction |
Example of a Golden Cross
Having a real-world example helps cement the concept. Let’s look at one of the most talked-about golden crosses in recent history.
- When did a major golden cross occur recently? The S&P 500 index formed a golden cross in early July 2020. This happened roughly four months after the COVID-19-induced market crash that shook global markets.
- What does historical data tell us about golden crosses? Research shows that after a golden cross, the S&P 500 was higher one year later more than 71% of the time. The average one-year return following this signal was over 10%.
- Does this guarantee profits? No, the pattern is not guaranteed to deliver gains. Timing and context matter significantly when using this signal.
This S&P 500 example shows why traders pay close attention to the golden cross. The 2020 formation came at a critical moment when markets were recovering from pandemic lows.
Many investors who spotted this signal early benefited from the subsequent rally. However, the statistics also remind us that nearly 3 out of 10 times, the market didn’t rise after a golden cross.
This is why experienced traders use it as one tool among many, not as a sure bet.
Why the Golden Cross Matters for Traders & Investors
Here’s why this pattern gets so much attention from both professional and individual traders.
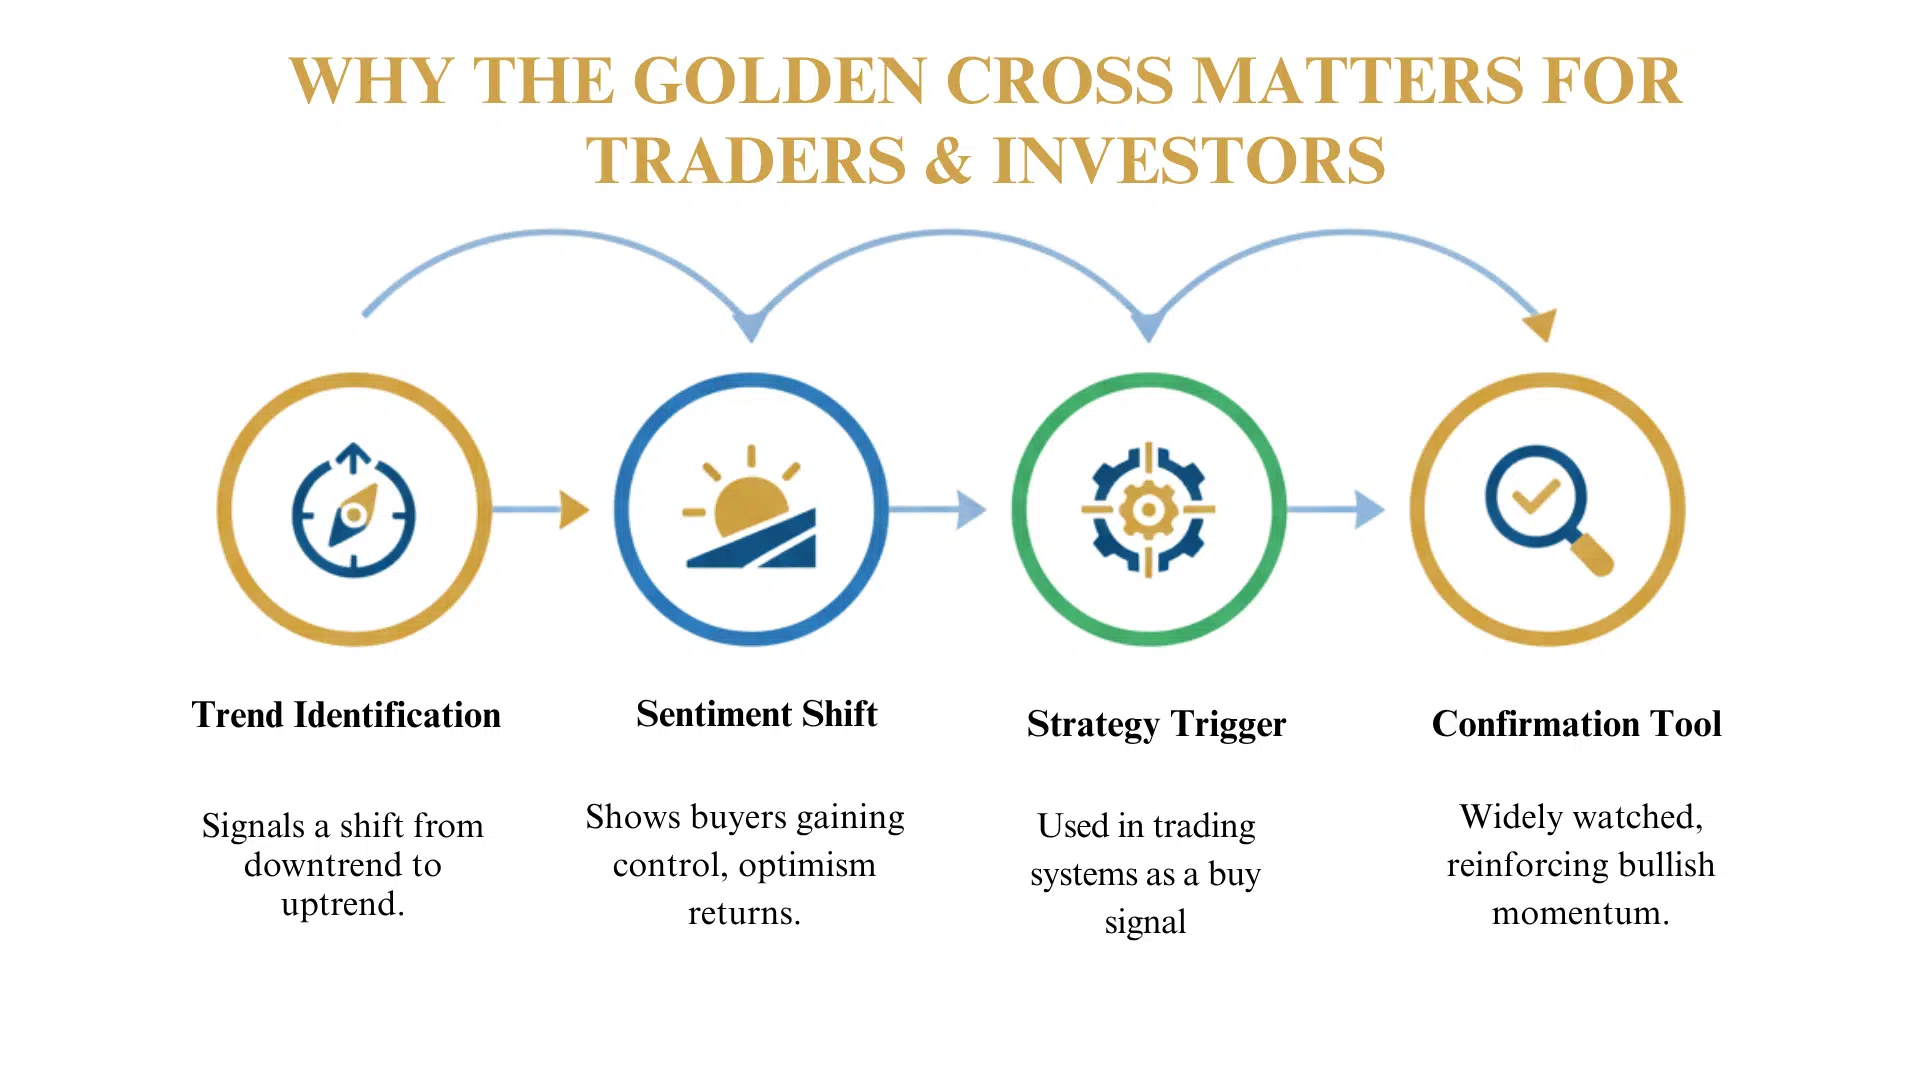
- Trend Identification: The golden cross helps signal when a downtrend might be reversing into an uptrend. It gives traders a clear visual cue that the market direction could be changing.
- Sentiment Shift: The crossover often signals that buyers are gaining control over recent price action. This shift in market sentiment can mark the beginning of renewed optimism.
- Strategy Trigger: Many trading systems and thematic strategies include the golden cross as a filter or entry signal. Automated trading programs often look for this pattern before making buy decisions.
- Confirmation Tool: Because it uses widely followed moving averages like the 50-day and 200-day, it has broad awareness among traders. This widespread recognition can reinforce its effect to some degree, creating a self-fulfilling element.
The golden cross matters because it combines simplicity with effectiveness. Traders don’t need complex calculations to spot it.
When millions of traders watch the same signal, their collective actions can push prices in the expected direction. However, the golden cross has an important limitation. It’s lagging in nature because it reflects past data rather than predicting the future.
This is why experienced traders often use it in conjunction with other indicators rather than as a solo trigger.
Technical Analysis Behind the Golden Cross
To make effective use of the golden cross, it helps to understand the moving averages and how variations can affect results.
The classic pattern uses Simple Moving Averages (SMAs), which calculate the average of closing prices over a set period, with the standard being 50-day and 200-day periods on a daily chart.
Some traders prefer Exponential Moving Averages (EMAs) instead, which give more weight to recent prices and respond faster to changes.
You can also adjust timeframes to suit your trading style, using combinations like 20/100 or 10/50, though shorter periods generate more signals along with more false crossovers.
Beyond just spotting the crossover, smart traders look for confirmation through increased trading volume, momentum indicators like RSI or MACD showing bullish turns, price staying above the long MA to avoid fake crosses, and a favorable broader market context, including sector strength and macro conditions.
How to Trade Using the Golden Cross Strategy
If you’re considering using the golden cross as part of your strategy, here’s a breakdown of how to approach it with caution. Trading this pattern requires more than just spotting the crossover.
Entry & Timing Tips
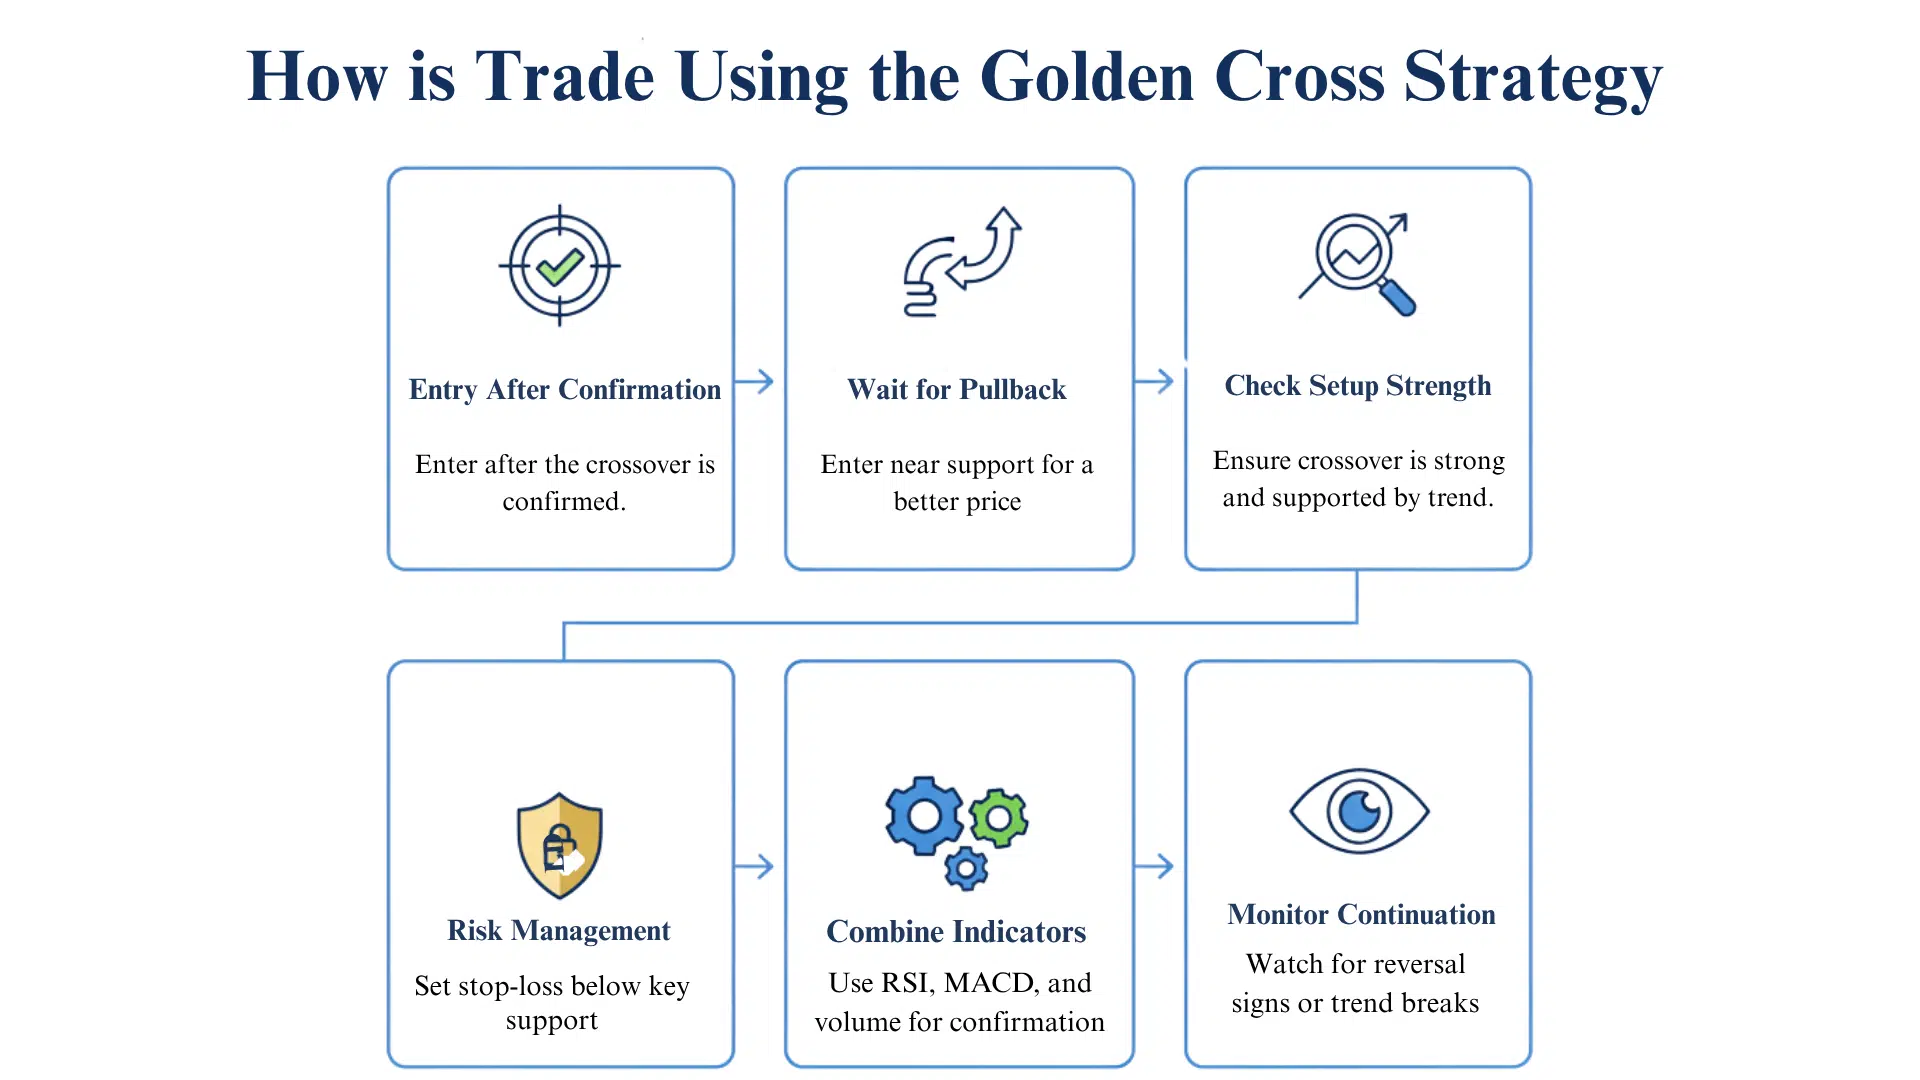
- Option A: Enter After Confirmation. Enter shortly after the crossover occurs once it’s been confirmed. This approach gets you in early but requires quick action when you spot the pattern.
- Option B: Wait for a pullback toward the long MA, like the 200-day, that holds as support. Then enter the bounce back up. This method offers a better entry price but requires patience.
- Check Your Setup: Ensure you’re comfortable with the risk and reward before entering. Make sure the crossover isn’t isolated or weak. A strong crossover shows clear separation between the moving averages and sustained price strength.
Risk Management
- Set Stop Losses Always set stop losses below recent support levels or below the long MA. This protects your capital if the trade doesn’t work out as expected.
- Use Proper Position Sizing: Align your position size with your risk tolerance. Just because a golden cross formed doesn’t guarantee success. Never risk more than you can afford to lose on any single trade.
- Monitor for Reversal Signs. Watch carefully if the short MA dips back below the long MA. This could signal a trend change or reversal. Be ready to exit if the pattern breaks down.
Indicators to Combine
Don’t rely on the golden cross alone. Combine it with other signals for better results.
- Volume Analysis: Look for a volume spike or above-average volume at the crossover. Strong volume confirms real buying interest.
- Momentum Indicators: Check if RSI or MACD are trending upward. When momentum aligns with the crossover, the signal becomes more reliable.
- Market Context: Consider sector strength and broad market conditions. A golden cross in a strong sector within a bullish market carries more weight.
The key is to avoid relying on the crossover in isolation. Professional traders stack multiple confirmations before committing capital. This layered approach reduces the chance of getting caught in false signals and improves your overall success rate.
Golden Cross vs. Death Cross: What’s the Difference?
Understanding both patterns helps frame the golden cross in context and appreciate when caution is warranted. These two signals are mirror opposites of each other.
| Feature | Golden Cross | Death Cross |
|---|---|---|
| Short MA crosses | Above long MA (e.g., 50-day above 200-day) | Below long MA (short MA drops under long MA) |
| Typical interpretation | Bullish trend reversal or upward momentum | Bearish trend reversal or downward momentum |
| Long MA behavior | May act as support after crossover | May act as resistance after crossover |
| Common use case | Signal to consider long positions or trend following | Signal to reduce exposure or consider exiting/shorting |
The key difference lies in direction. A golden cross signals bullish momentum when the short-term MA rises above the long-term MA. A death cross signals bearish momentum when it drops below.
Both patterns use the same moving averages but point to opposite market conditions. Understanding both helps you recognize when sentiment is shifting in either direction.
Does the Golden Cross Really Work?
What does the historical data tell us? The numbers are encouraging but not perfect.
- What do the statistics show? For the S&P 500, historical data shows that after a golden cross, the index was higher one year later in over 71% of cases. The average 12-month return was above 10%.
- What’s the catch? The golden cross is lagging and may appear after much of the rally is already underway. You might miss a significant portion of the gains before the signal even forms.
- Does past performance guarantee future results? No. Markets differ by timeframe, sector, and conditions. What worked in the past may not work the same way in the future.
The data suggests the golden cross has real value, but it’s not foolproof. A 71% success rate means it fails nearly 3 out of 10 times. The 10% average return sounds good, but remember that’s an average across many years and market conditions.
It’s a useful tool in your toolkit, not a standalone magic signal. Use it as part of a complete trading strategy rather than relying on it alone.
Tools & Platforms to Spot a Golden Cross
Here are some practical ways to monitor and act on golden cross patterns. You don’t need expensive software to get started.
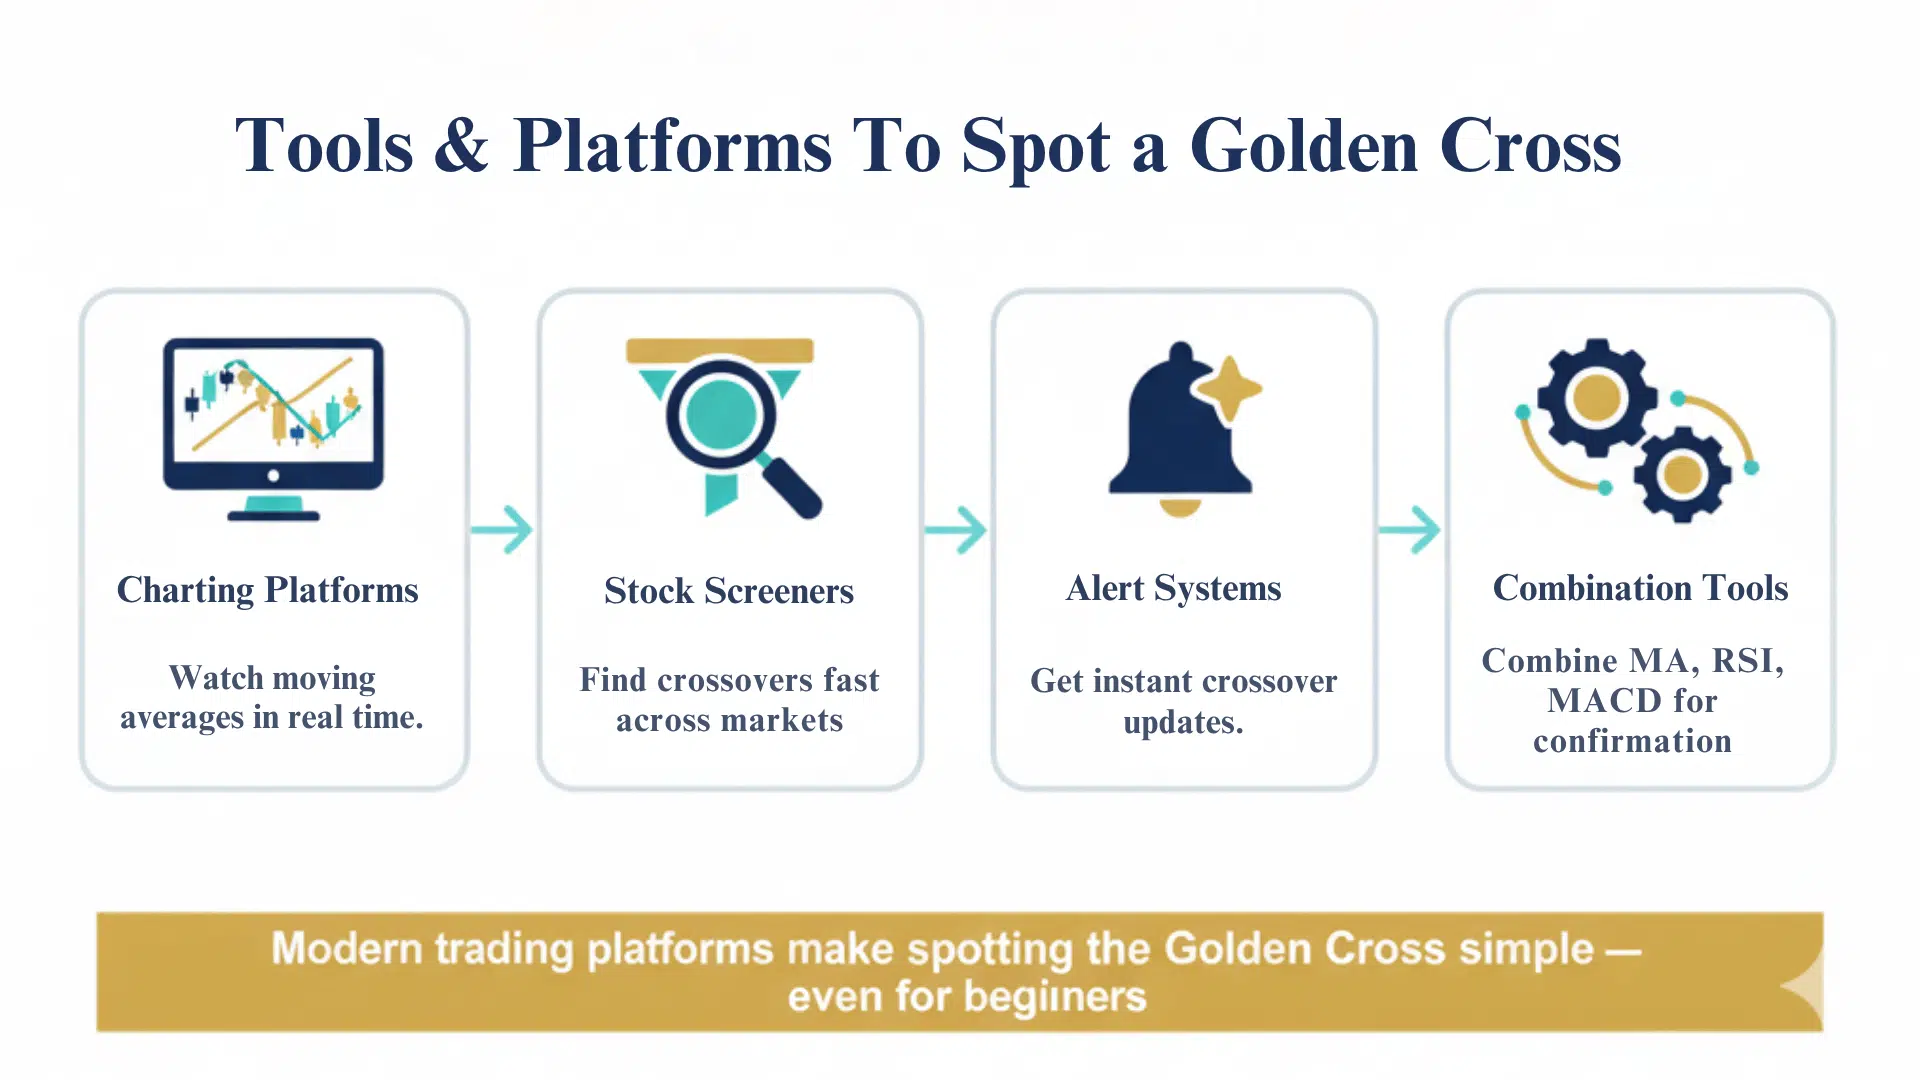
- Charting Platforms Use platforms like TradingView or StockCharts to overlay 50-day and 200-day moving averages on your charts. These tools let you watch for crossovers in real time and review historical patterns.
- Stock Screeners Filter stocks where the 50-day MA is about to cross or has just crossed the 200-day MA. Screeners help you find opportunities across hundreds of stocks without manually checking each chart.
- Alert Systems Set notifications for when the crossover happens or when the price moves through the long MA. Alerts ensure you don’t miss important signals even when you’re not actively watching the markets.
- Combination Tools Use the golden cross alongside RSI, MACD indicators, or volume filters to increase confidence. Many platforms let you layer multiple indicators on one chart for complete analysis.
Most modern trading platforms include these features at low or no cost. TradingView offers free plans with basic charting and screening capabilities. Your brokerage likely provides similar tools as well.
The key is setting up your workspace once so you can quickly spot golden crosses as they form. Spend time learning your chosen platform’s features to make monitoring efficient and effective.
Final Notes
The golden cross is a powerful technical signal that shows when short-term momentum crosses above long-term trends.
Historical data support its value, with the S&P 500 rising over 71% of the time after this pattern forms. But remember, it’s not perfect and shouldn’t be used alone.
Combine the golden cross with volume analysis, momentum indicators, and solid risk management. Understand its lagging nature and always check the market context before trading. Use it as one tool among many in your trading toolkit.
Ready to spot golden crosses in real time? Start using charting platforms like TradingView to practice identifying this pattern. Set up alerts so you never miss a potential signal.
What’s your experience with the golden cross? Have you traded using this pattern? Share your thoughts in the comments below.