
Have you ever watched a stock rally hard, only to crash the next day?
That sharp reversal often leaves a clue on your chart. It’s called the shooting star pattern. This single candlestick tells you when buyers are losing control and sellers are taking over.
The shooting star is one of the most reliable bearish reversal signals in technical analysis. Beginners can spot it easily. Experienced traders use it to time exits and short entries.
In this guide, you’ll learn exactly what a shooting star looks like. We’ll show you how to identify it on charts. You’ll get a step-by-step trading strategy with entry points, stop losses, and profit targets. We’ll also cover a real case study on Lockheed Martin.
By the end, you’ll know how to turn this simple pattern into actual profits.
What is a Shooting Star Pattern?
A shooting star pattern is a bearish candlestick formation that signals a potential trend reversal in stock trading. It gets its name from its appearance, which looks like a shooting star falling from the sky.
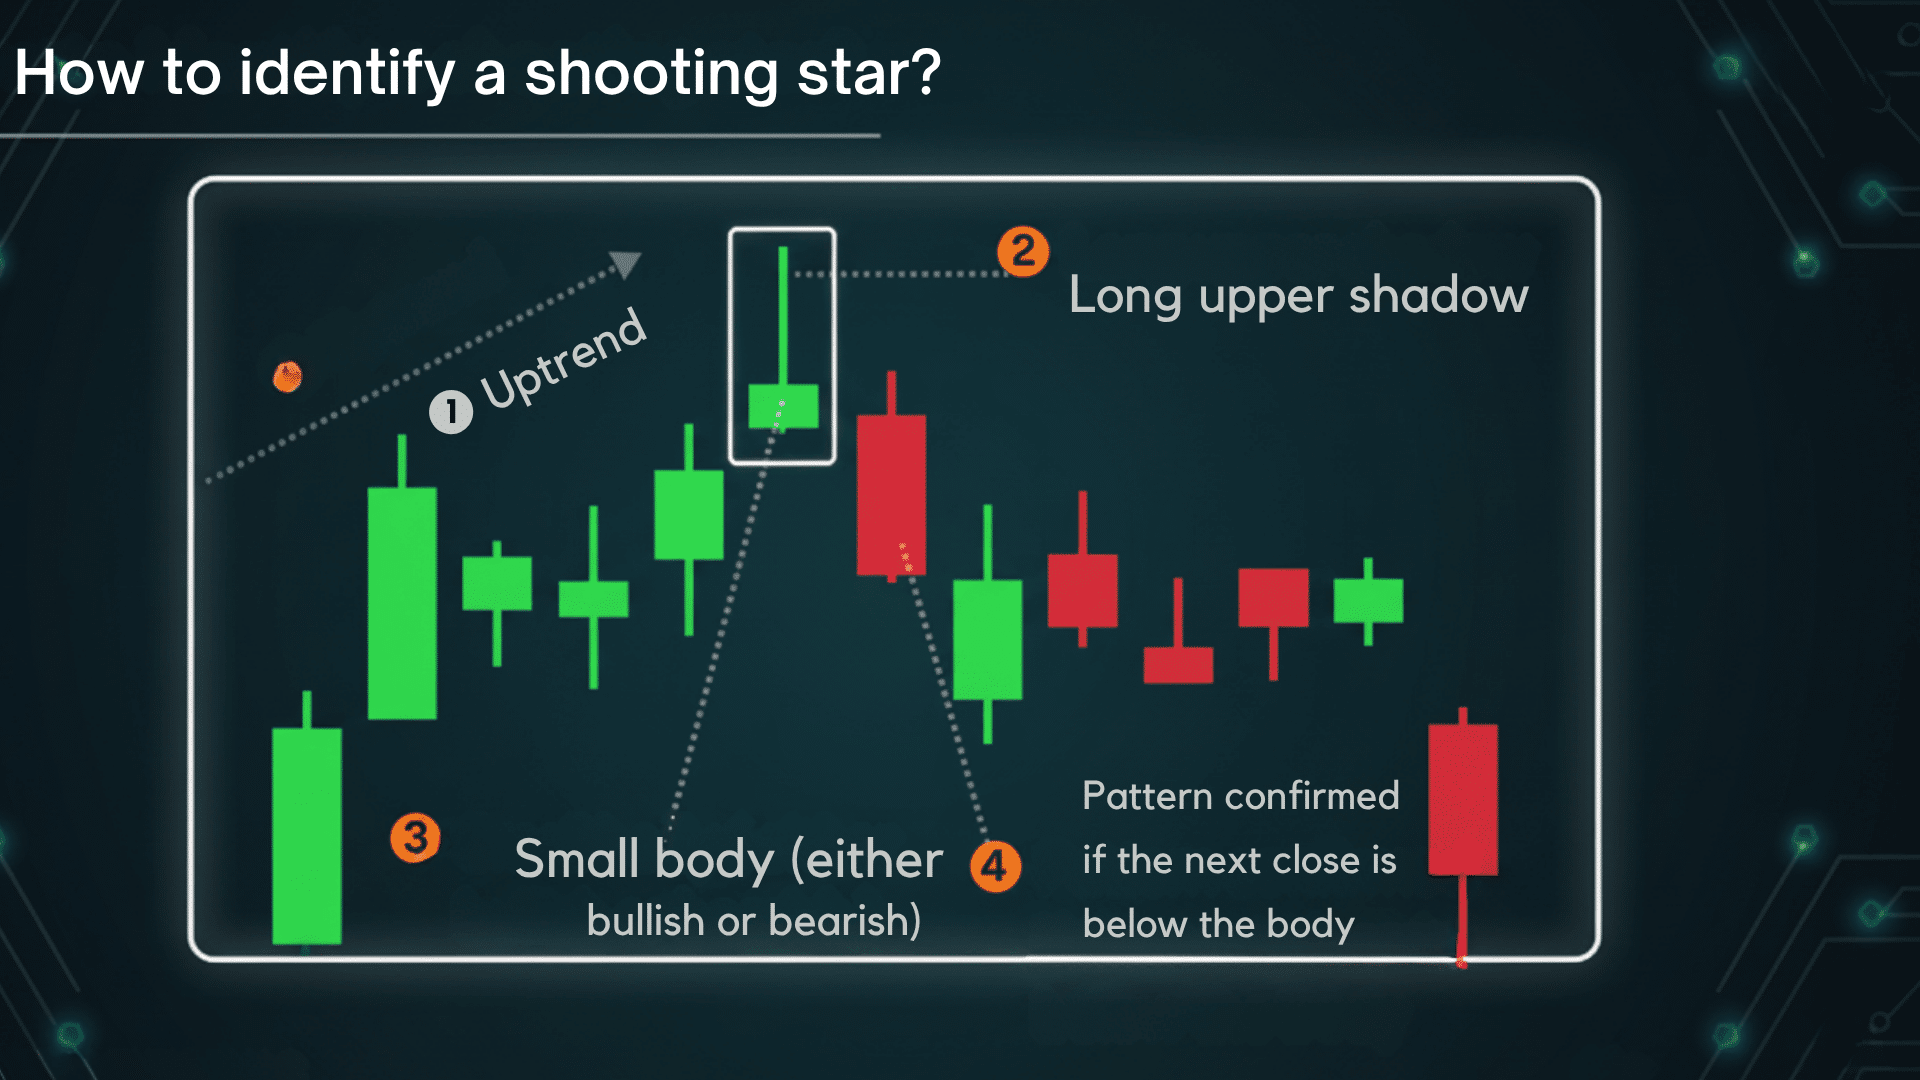
The pattern has three key features: a small real body positioned near the bottom of the candle, a long upper shadow that’s at least twice the length of the body, and little to no lower shadow.
This formation tells an important story about market psychology. When you see this pattern, it means buyers pushed prices higher during the session, but sellers took control and drove prices back down near the opening level.
The long upper tail shows rejected higher prices. The small body near the low confirms that bears won the battle.
This shift from buyer optimism to seller dominance makes the shooting star a warning sign that an uptrend may be losing steam.
How to Identify a Shooting Star on Stock Charts?
Spotting a shooting star pattern on your charts is easier than you might think. But knowing where to look makes all the difference. The pattern doesn’t appear randomly. It shows up at specific moments when the market is ready to shift direction.
1. Where does it form?
The shooting star typically appears at the end of an uptrend.
Look for it after a series of bullish candles when prices have been climbing steadily. If you see this pattern during a downtrend or sideways market, it’s not a valid shooting star signal.
2. What are the ideal conditions?
Volume plays a critical role in confirming the pattern’s strength. Higher volume during the shooting star formation adds credibility to the reversal signal.
Low-volume setups often lead to false signals and failed trades.
3. Which timeframes work best?
Daily and weekly charts provide the most reliable shooting star patterns. Shorter timeframes, like 15-minute or hourly charts, generate too many false signals. Stick to longer timeframes for better accuracy and fewer headaches.
4. How does price typically move?
Before the pattern forms, you’ll see steady price increases with strong buying momentum. The shooting star day opens near the previous close, rallies sharply during the session, then falls back to close near the opening price.
After confirmation, prices usually decline as sellers take control. The longer the upper shadow compared to the body, the stronger the bearish signal becomes.
How to Trade a Shooting Star Pattern: Step-by-Step Strategy
Trading the shooting star pattern requires patience and discipline. Following a structured approach helps you avoid common mistakes and improve your win rate. Here’s how to execute this strategy from start to finish.
Step 1: Identify the Pattern in an Existing Uptrend
First, confirm that the stock has been in a clear uptrend before the shooting star appears. Look for at least three to five consecutive bullish candles or a sustained price increase over several weeks.
The pattern only works as a reversal signal when there’s an actual uptrend to reverse. Avoid trading shooting stars that appear in choppy or sideways markets.
Step 2: Wait for Confirmation Candle
Never enter a trade based solely on the shooting star candle itself. Wait for the next trading session to confirm the pattern.
A proper confirmation candle should close below the shooting star’s closing price, ideally with strong volume. This bearish follow-through proves that sellers are truly in control.
Without confirmation, you risk entering too early and getting stopped out.
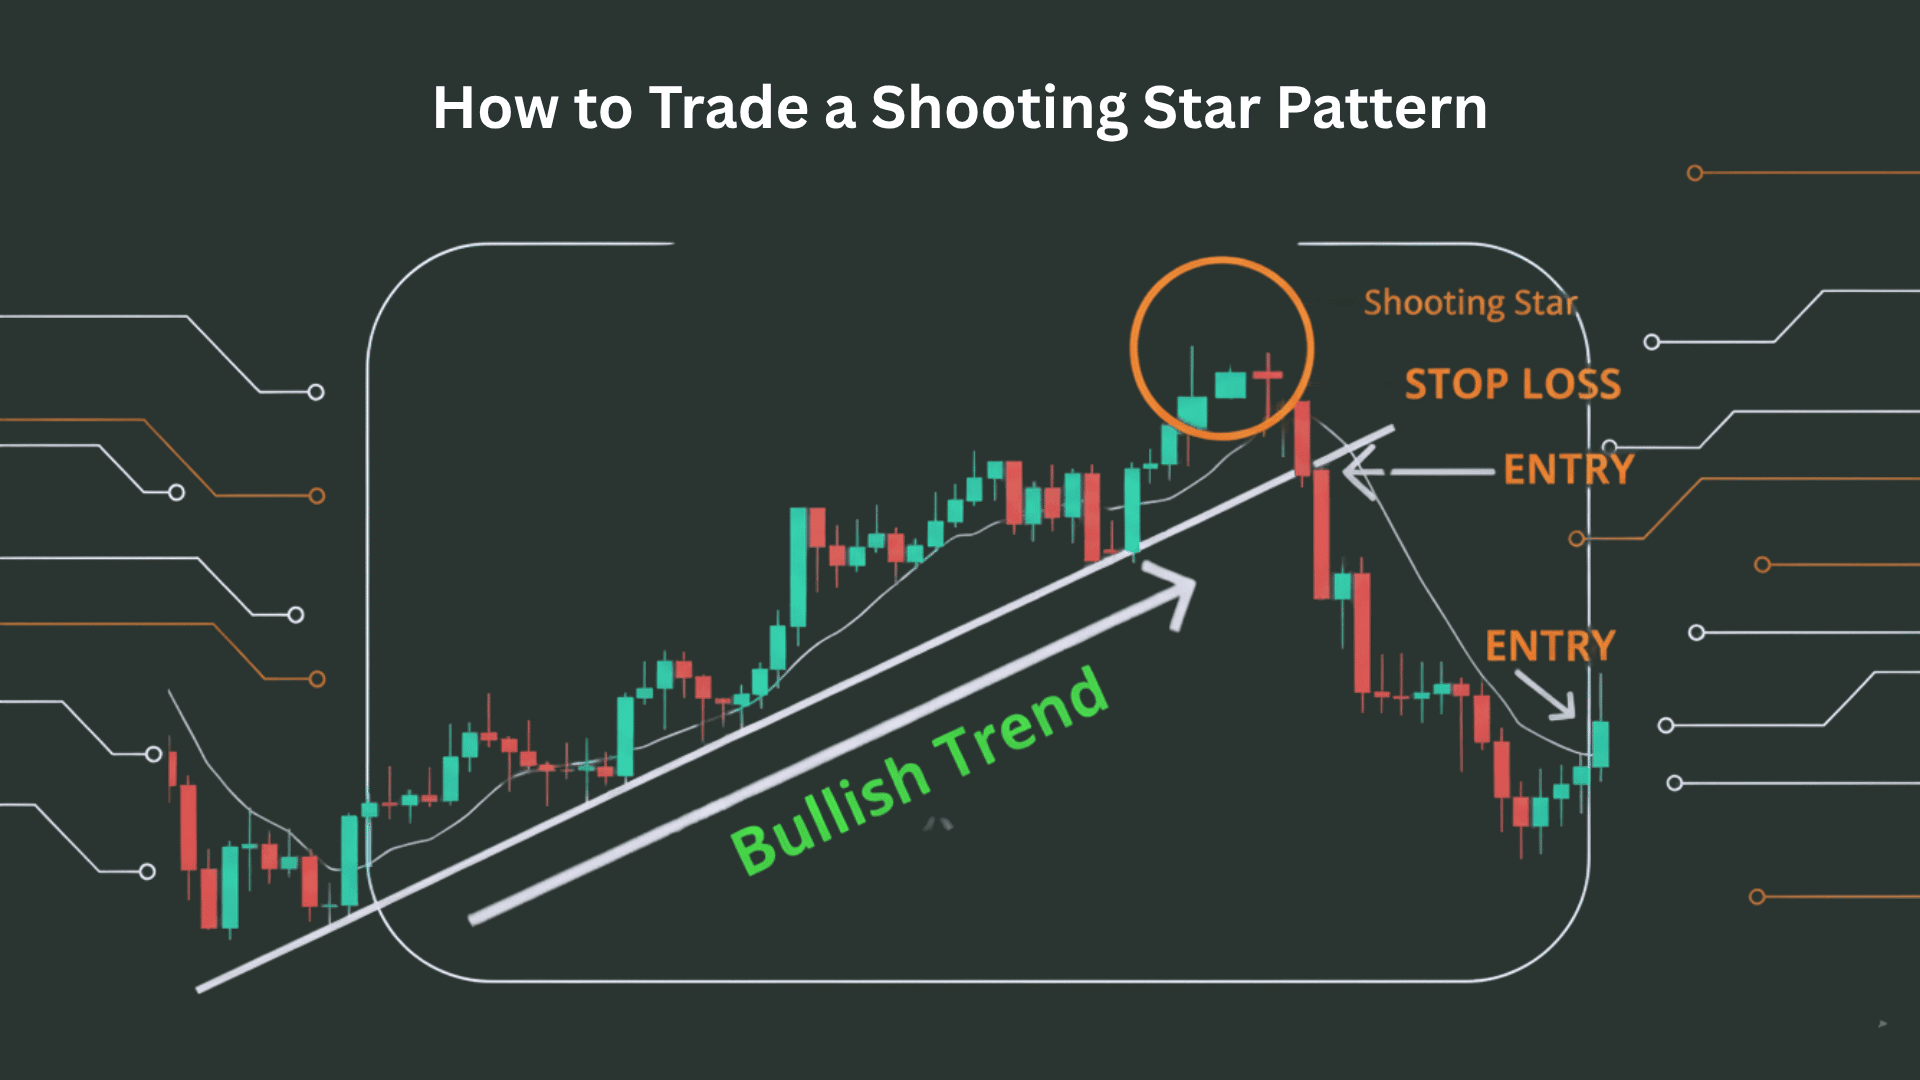
Step 3: Plan Your Entry Point Below the Shooting Star’s Low
Your entry should be placed just below the low of the shooting star candle. Some traders enter immediately after the confirmation candle closes.
Others place a sell stop order below the shooting star’s low to catch the breakdown. Choose the method that fits your trading style and risk tolerance.
Step 4: Set Stop-Loss Above the Pattern’s High
Risk management is non-negotiable when trading reversal patterns. Place your stop-loss slightly above the highest point of the shooting star’s upper shadow.
This protects you if the uptrend continues despite the pattern. Add a small buffer of 1-2% above the high to avoid getting stopped out by normal price fluctuation.
Step 5: Define Profit Targets Based on Risk-Reward Ratio
Calculate your potential profit before entering any trade. Measure the distance from your entry to your stop-loss. Then aim for at least a 2:1 or 3:1 reward-to-risk ratio.
Look for nearby support levels where the stock might bounce. Those levels make logical profit targets where you can exit part or all of your position.
Optional: Use Stock Screeners to Find Opportunities
Most trading platforms offer stock screeners that filter for specific candlestick patterns. Set up custom scans to find stocks showing shooting star formations in real time.
Add filters for volume, RSI levels, and trend strength. This saves hours of manual chart reviewing. Popular platforms like TradingView, Finviz, and Thinkorswim all support candlestick pattern screening.
Advantages and Disadvantages of Trading Shooting Star Patterns
Every trading strategy has strengths and weaknesses. Understanding both sides helps you use the shooting star pattern more effectively and avoid costly mistakes.
Pros
- Simple to spot even for beginners: The shooting star has a distinctive shape that’s easy to recognize once you know what to look for, making it perfect for new traders learning technical analysis.
- Works well in trending markets: When a strong uptrend is in place, the shooting star provides reliable reversal signals that often lead to profitable short trades or exit points.
- Strong visual reversal indicator when confirmed with volume: High volume during the pattern formation adds significant weight to the signal, giving traders confidence that a real shift in sentiment is occurring.
Cons
- False signals in sideways markets: Choppy or range-bound markets generate many shooting star lookalikes that fail to produce any meaningful price decline, leading to frustrating losses.
- Requires confirmation to avoid premature entries: Jumping in too early without waiting for the next candle’s bearish close often results in stopped-out trades when the uptrend continues.
- Less reliable without volume or supporting indicators: A shooting star appearing on weak volume or without other technical confirmation often turns out to be just noise rather than a true reversal signal.
Case Study: Shooting Star Pattern on Lockheed Martin
Real-world examples bring trading patterns to life. Let’s look at how a shooting star played out on Lockheed Martin’s chart.
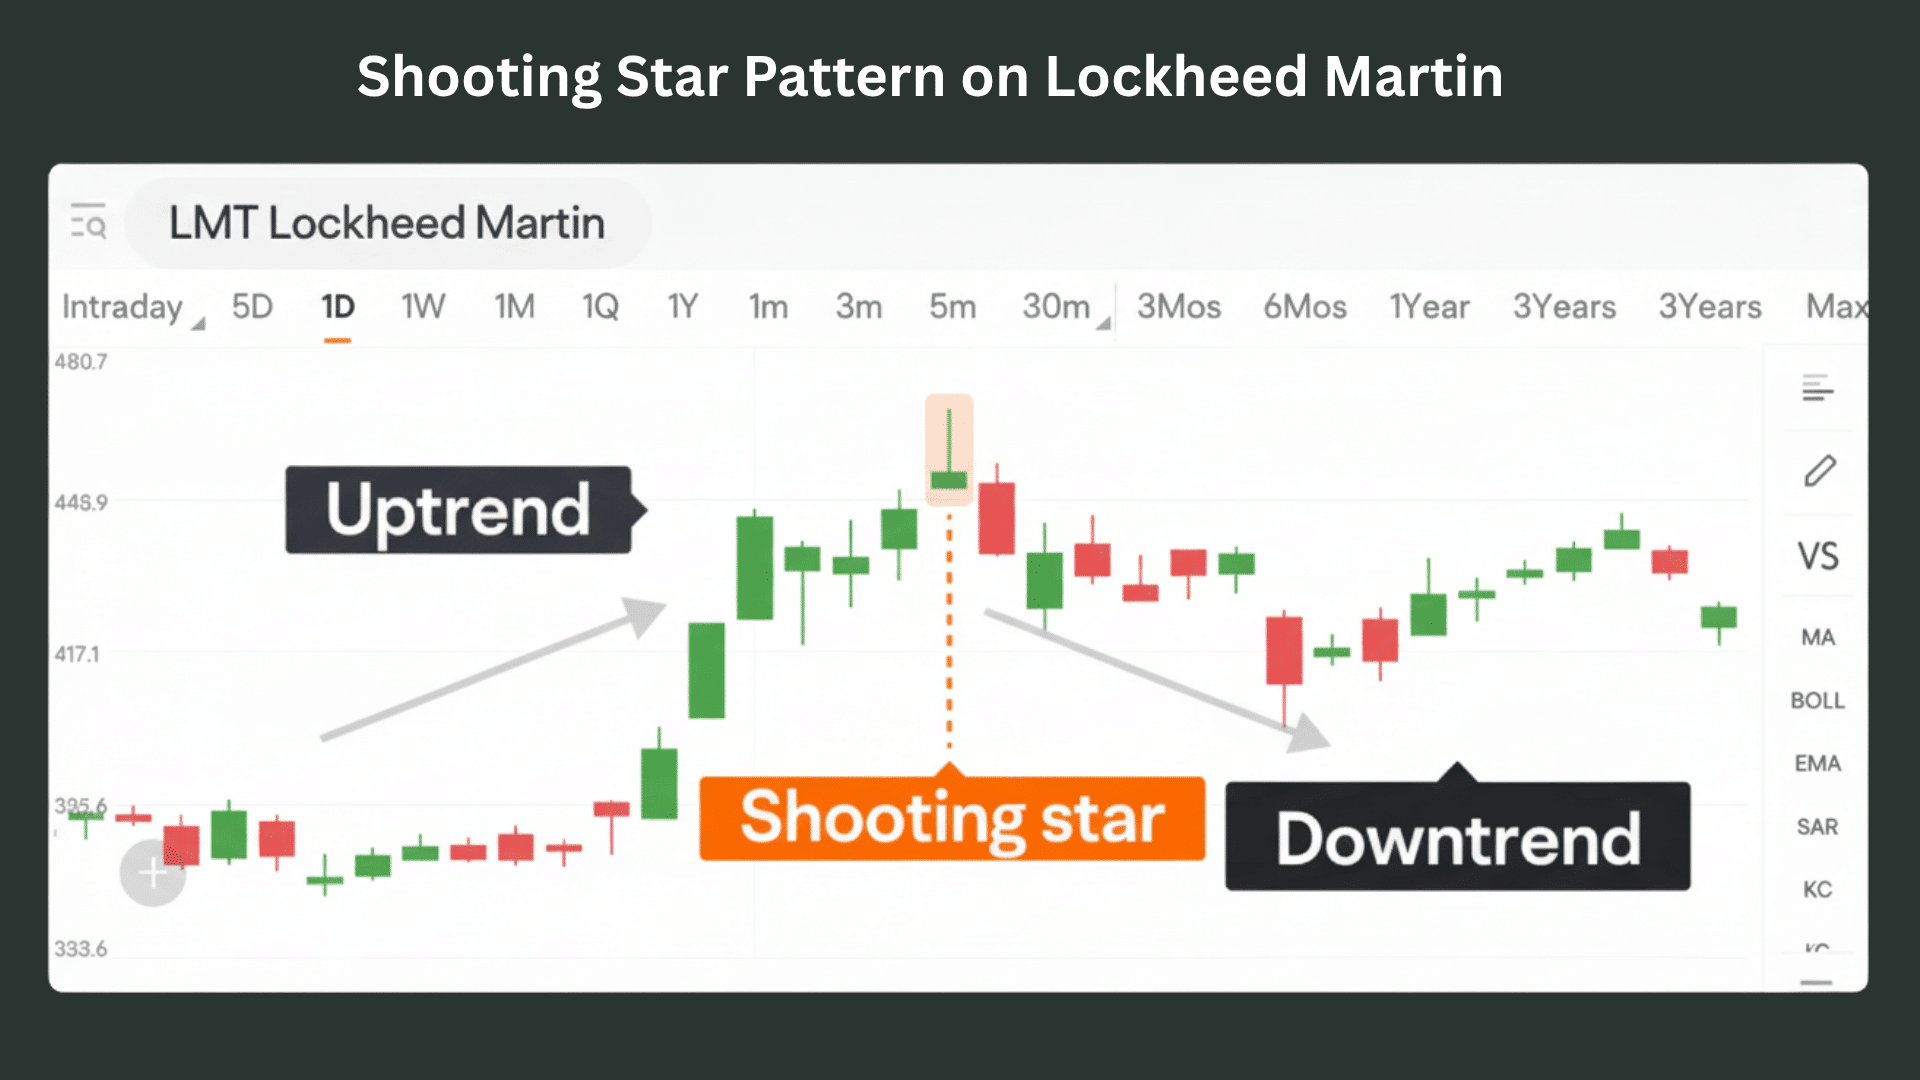
1. The Uptrend Phase
Lockheed Martin was climbing steadily for weeks. Defense spending news kept investors optimistic. The stock kept making higher highs. Bulls were clearly in control. Then everything changed in one session.
2. The Shooting Star Forms
LMT opened normally and shot up 4% by midday. Buyers were aggressive early on. But sellers stepped in hard during the afternoon.
The stock gave back all its gains. It closed near where it opened. The candle showed a tiny body at the bottom with a long upper tail. This was a classic shooting star at the peak.
3. Volume Confirmed the Signal
Trading volume that day was well above average. This meant real selling was happening, not just noise. The next day, LMT opened lower and continued to fall.
It closed below the shooting star candle. High volume continued. The pattern was now confirmed.
4. What Happened Next
LMT dropped about 8% over the following weeks. The uptrend had reversed. Traders who spotted the pattern and waited for confirmation made profits on short positions.
Those who bought at the top got caught.
The Takeaway
This case shows why confirmation matters. If you sold right on the shooting star day without waiting, you might have been wrong. The next day’s bearish close gave you the proof you needed. Patience pays off when trading reversal patterns.
Shooting Star Pattern vs Similar Candlestick Formations
The shooting star looks like other candlestick patterns. Know the differences to avoid mistakes.
| Pattern | Key Similarities | Critical Differences | When to Use Each |
|---|---|---|---|
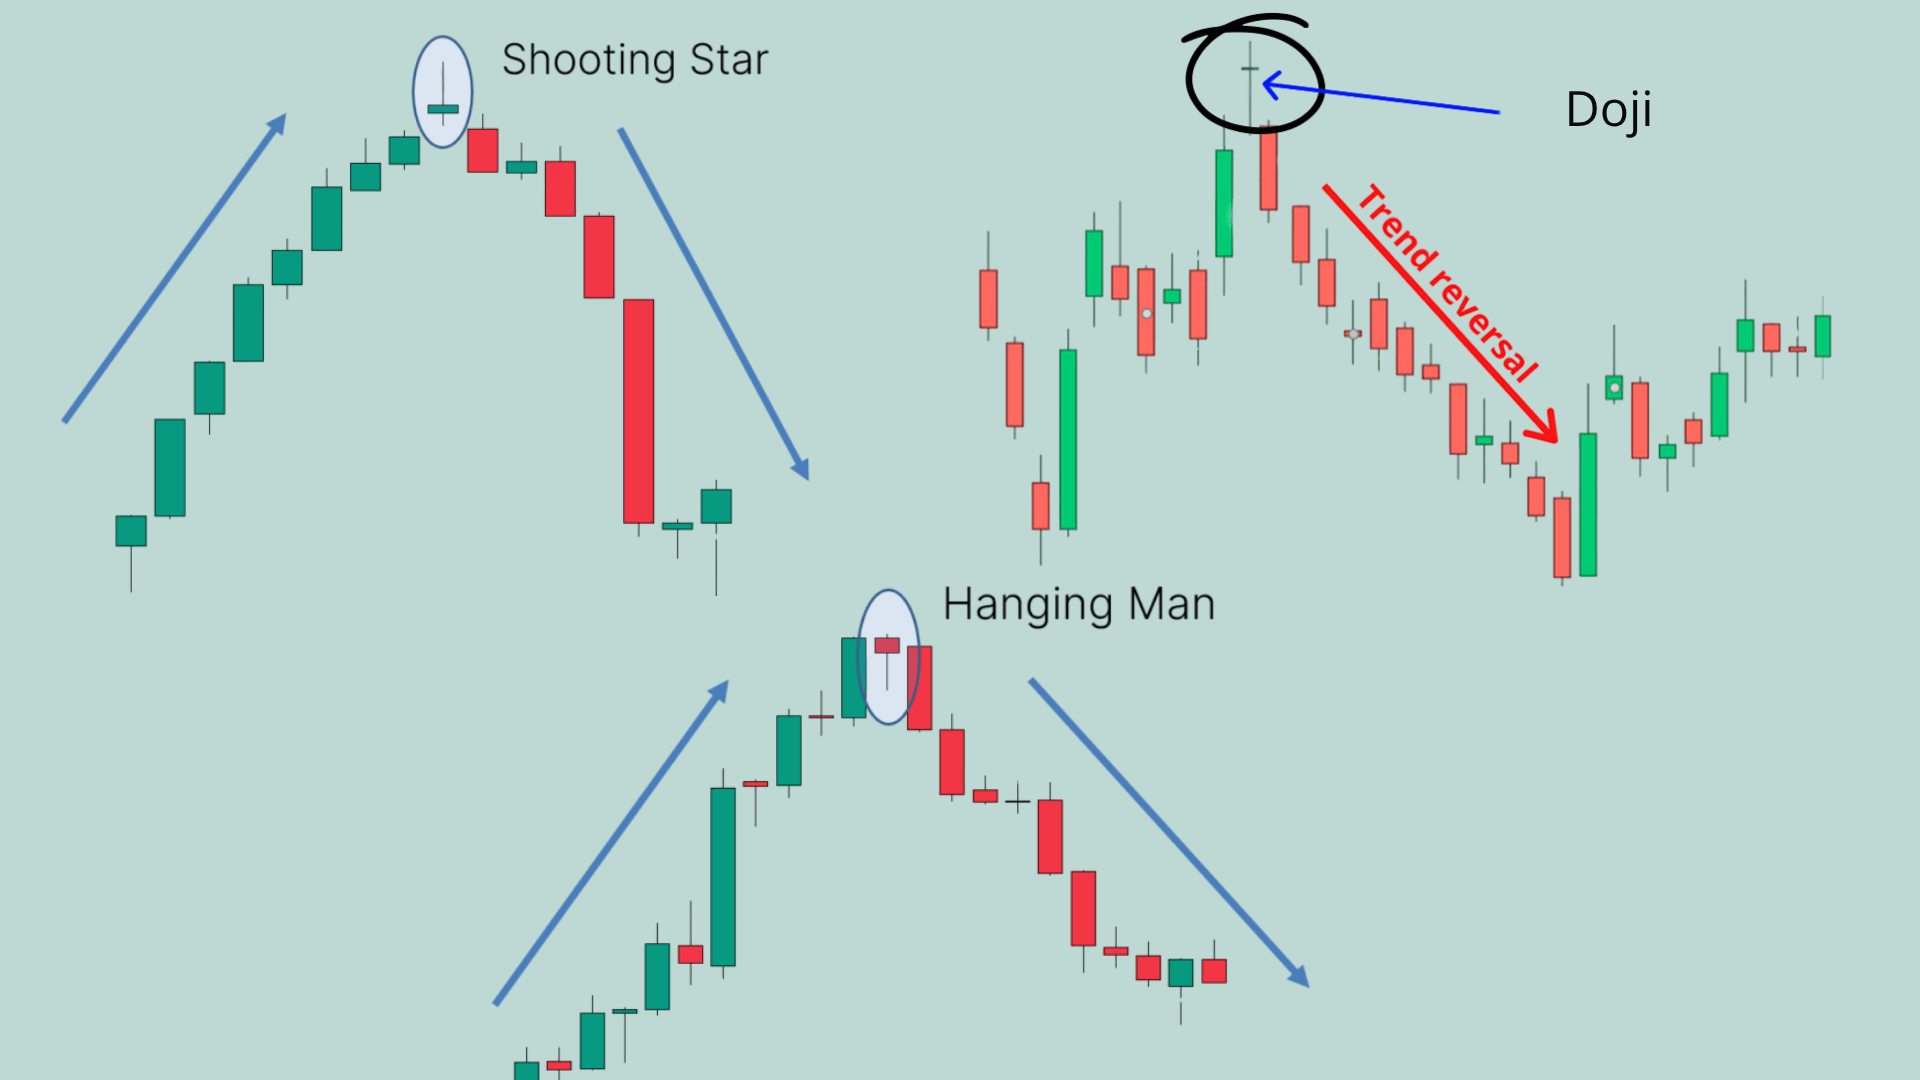
| Shooting Star vs Inverted Hammer | Both have small bodies. Both show long upper shadows. The shape looks the same. | Shooting star forms at the top. Inverted hammer forms at the bottom. Context changes everything. | Shooting star signals sell. Inverted hammer signals buy. Location matters most. |
| Shooting Star vs Doji | Both show market indecision. Both can signal reversals. Neither shows a clear direction. | A shooting star has a visible body. Doji has no real body. A shooting star needs an uptrend context. | Shooting star gives clearer signals. Doji needs more confirmation. Wait for the next candle. |
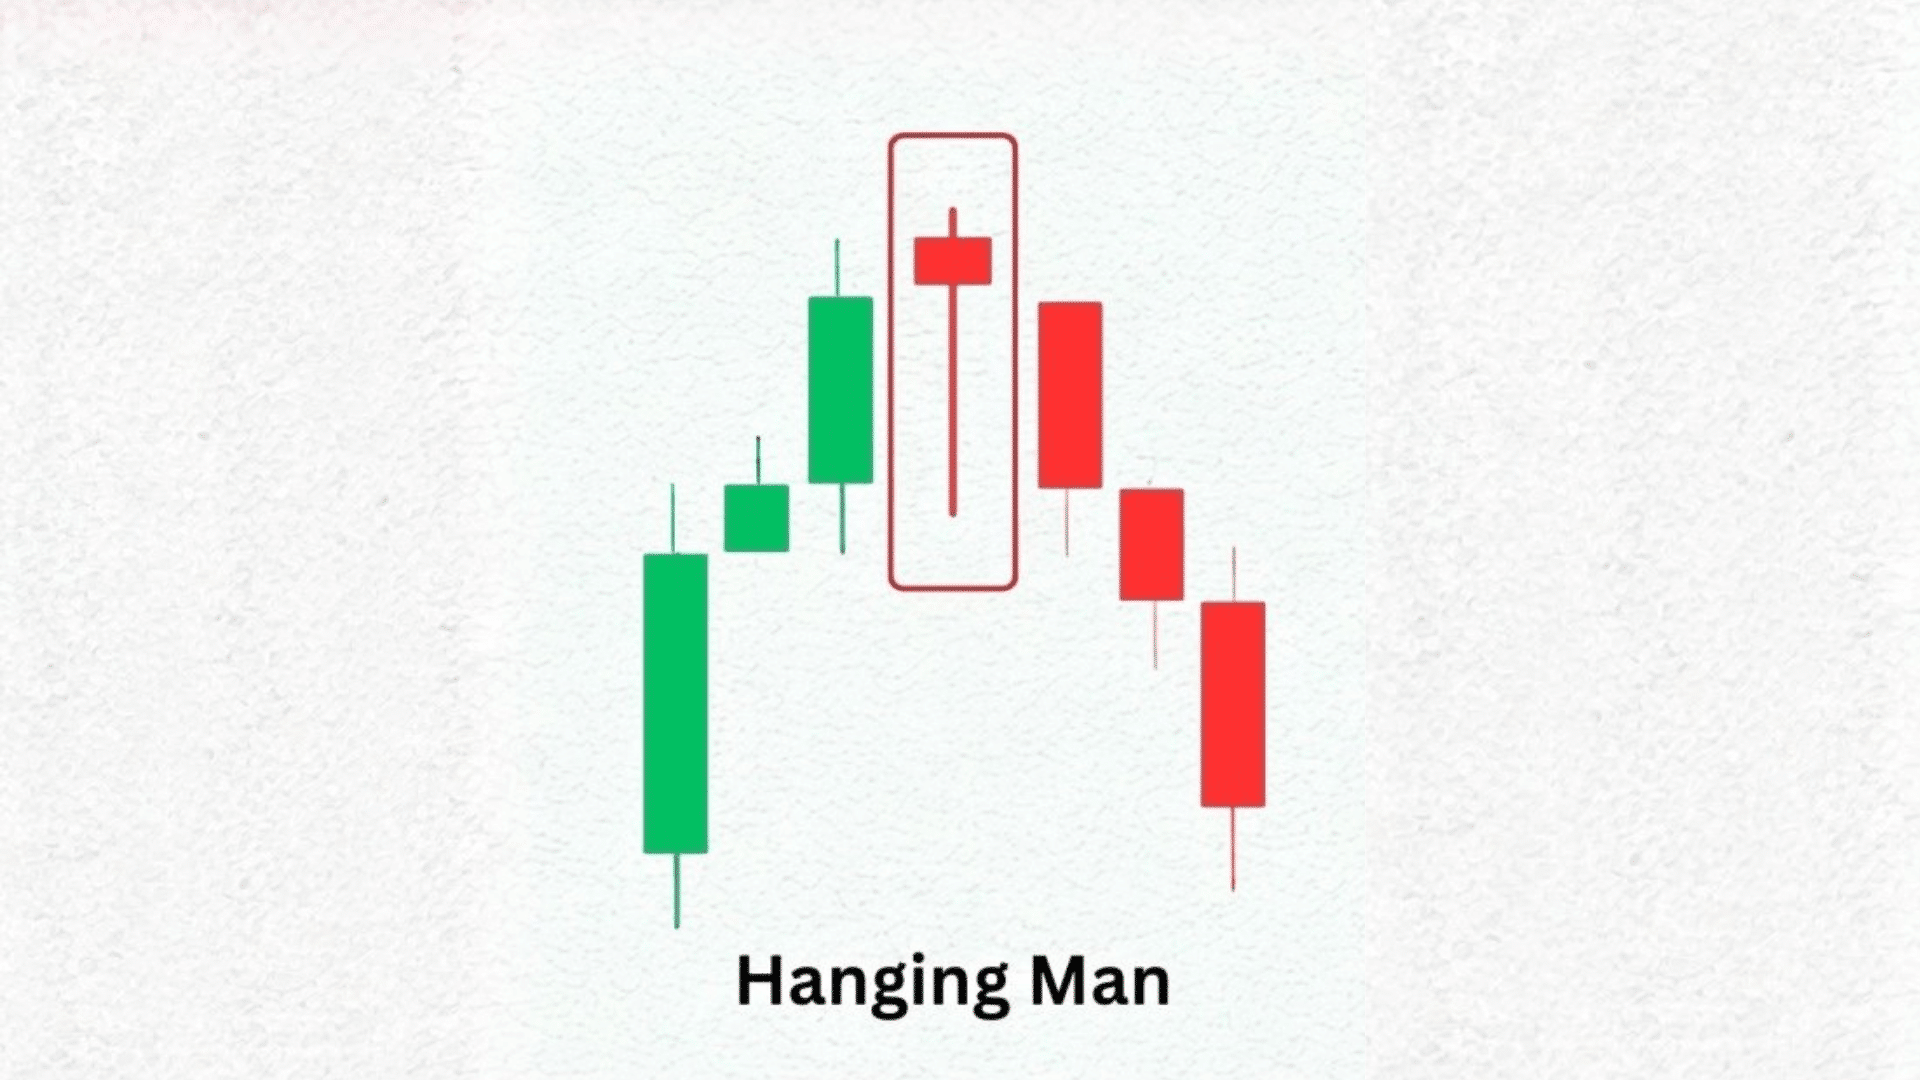
| Shooting Star vs Hanging Man | Both have small bodies. Both have long upper shadows. Shape appears similar. | Shooting star follows uptrends. Hanging man follows downtrends. Both predict bearish moves. | Shooting star exits bull runs. Hanging man warns rallies will fail. Check what came before. |
Context is everything. The same shape means different things in different spots.
Real-World Application: How to Screen for Shooting Star Pattern Stocks
Manually searching for shooting star patterns wastes time. Use screening tools to find them automatically in seconds.
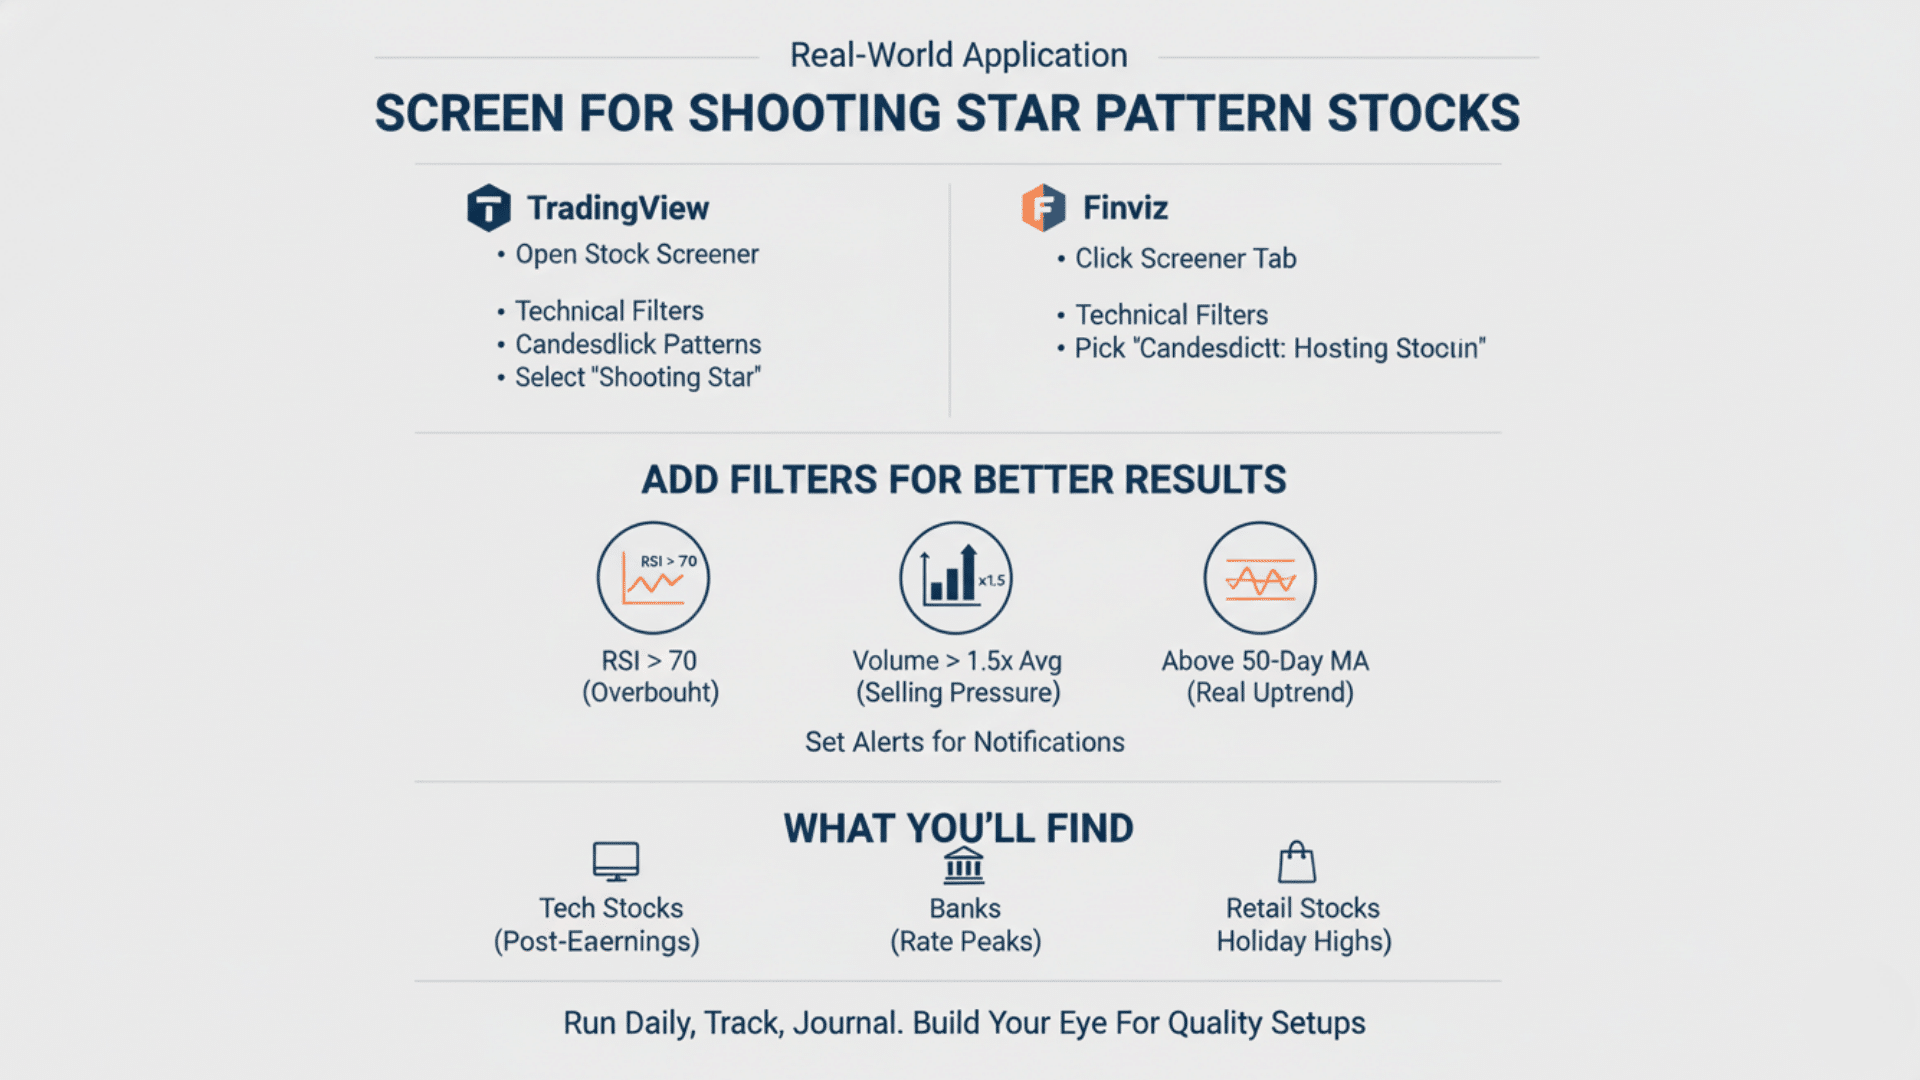
1. Set Up Your Stock Screener
TradingView and Finviz make pattern scanning easy. Open the Stock Screener on TradingView. Go to technical filters. Select “Candlestick Patterns” and choose “Shooting Star.” The platform scans thousands of stocks instantly.
Finviz works the same way but is simpler. Click the screener tab. Go to technical filters. Pick “Candlestick: Shooting Star.” You get a list right away. Save these screens to run them daily.
2. Add Filters for Better Results
Don’t rely on the pattern alone. Add RSI above 70 to catch overbought stocks. Set volume above 1.5 times the average. This confirms real selling pressure.
Include a 50-day moving average filter. Only show stocks above this line. You want patterns in real uptrends, not weak stocks. Set alerts to get notified automatically. No need to check charts all day.
3. What You’ll Find
Tech stocks often show shooting stars after earnings pops. Banks display them near rate decision peaks. Retail stocks form them after the holiday season highs.
Run your screener daily. Check which patterns confirmed with next-day bearish closes. Track which ones failed. Keep notes in a trading journal. This builds your eye for quality setups over time.
Final Thoughts
The shooting star pattern gives you a clear edge in trading reversals. But remember, it’s a signal, not a guarantee. The pattern works best when you wait for confirmation and use proper risk management.
Always combine the shooting star with volume analysis and technical indicators. Check RSI for overbought conditions. Look for the next day’s bearish close. Set your stop loss above the pattern’s high. Never skip these steps.
Start practicing on paper trades first. Build your confidence before risking real money. Use stock screeners to find fresh setups daily. Keep a journal of your trades.
What’s your experience with shooting star patterns? Have you spotted one recently? Share your thoughts in the comments below.