
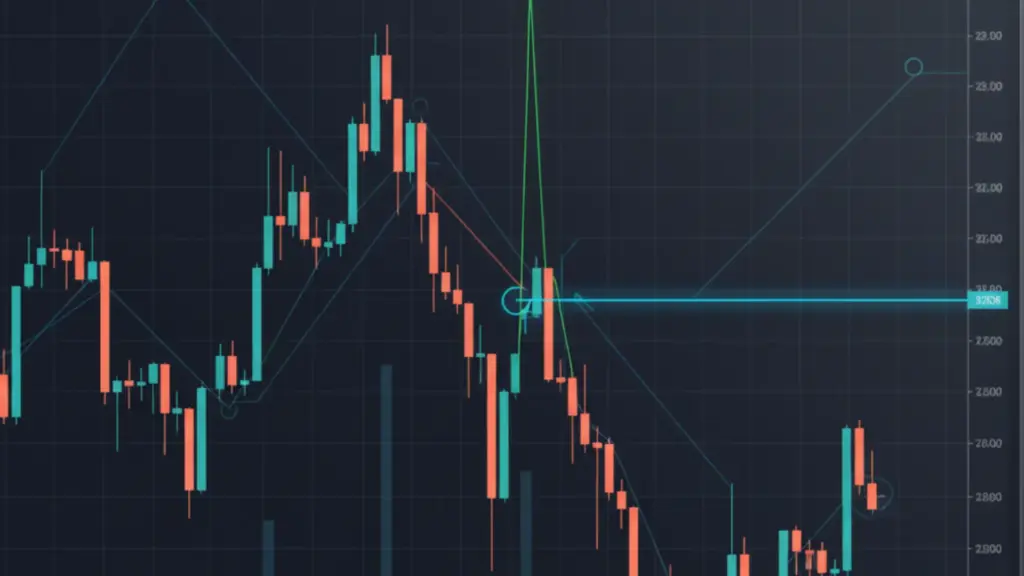
Have you ever watched the market hit your stop-loss, only to see it reverse seconds later? I know how frustrating that feels. It’s not bad luck; it’s what traders call a liquidity sweep.
So, what is a liquidity sweep really? It’s when big players or algorithms push prices beyond key levels, triggering stop-losses and collecting the liquidity they need to place huge trades.
It looks like a breakout, but it’s often a setup to trap retail traders like you and me.
I’ll break down how liquidity sweeps work, why they happen, and how you can spot them before they happen. By the end, you’ll know how to avoid these traps and even use them to your advantage.
| Pattern Type | Bullish or Bearish (context-dependent) |
| Best Timeframe | 15 minutes to 4 hours, confirmed against the daily structure |
| Signal | Stops cleared beyond a key level, followed by a reversal |
| Reliability | Moderate to high, but only after a confirmed structure shift |
| Confirmation Indicator | Displacement candle plus a market structure shift, ideally with above-average volume |
| ⚠️ Disclaimer: This article is for educational purposes only and does not constitute financial or investment advice. Trading involves substantial risk of loss and is not suitable for all investors. Always consult a qualified financial advisor before making investment decisions. |
What a Liquidity Sweep Looks Like on the Chart
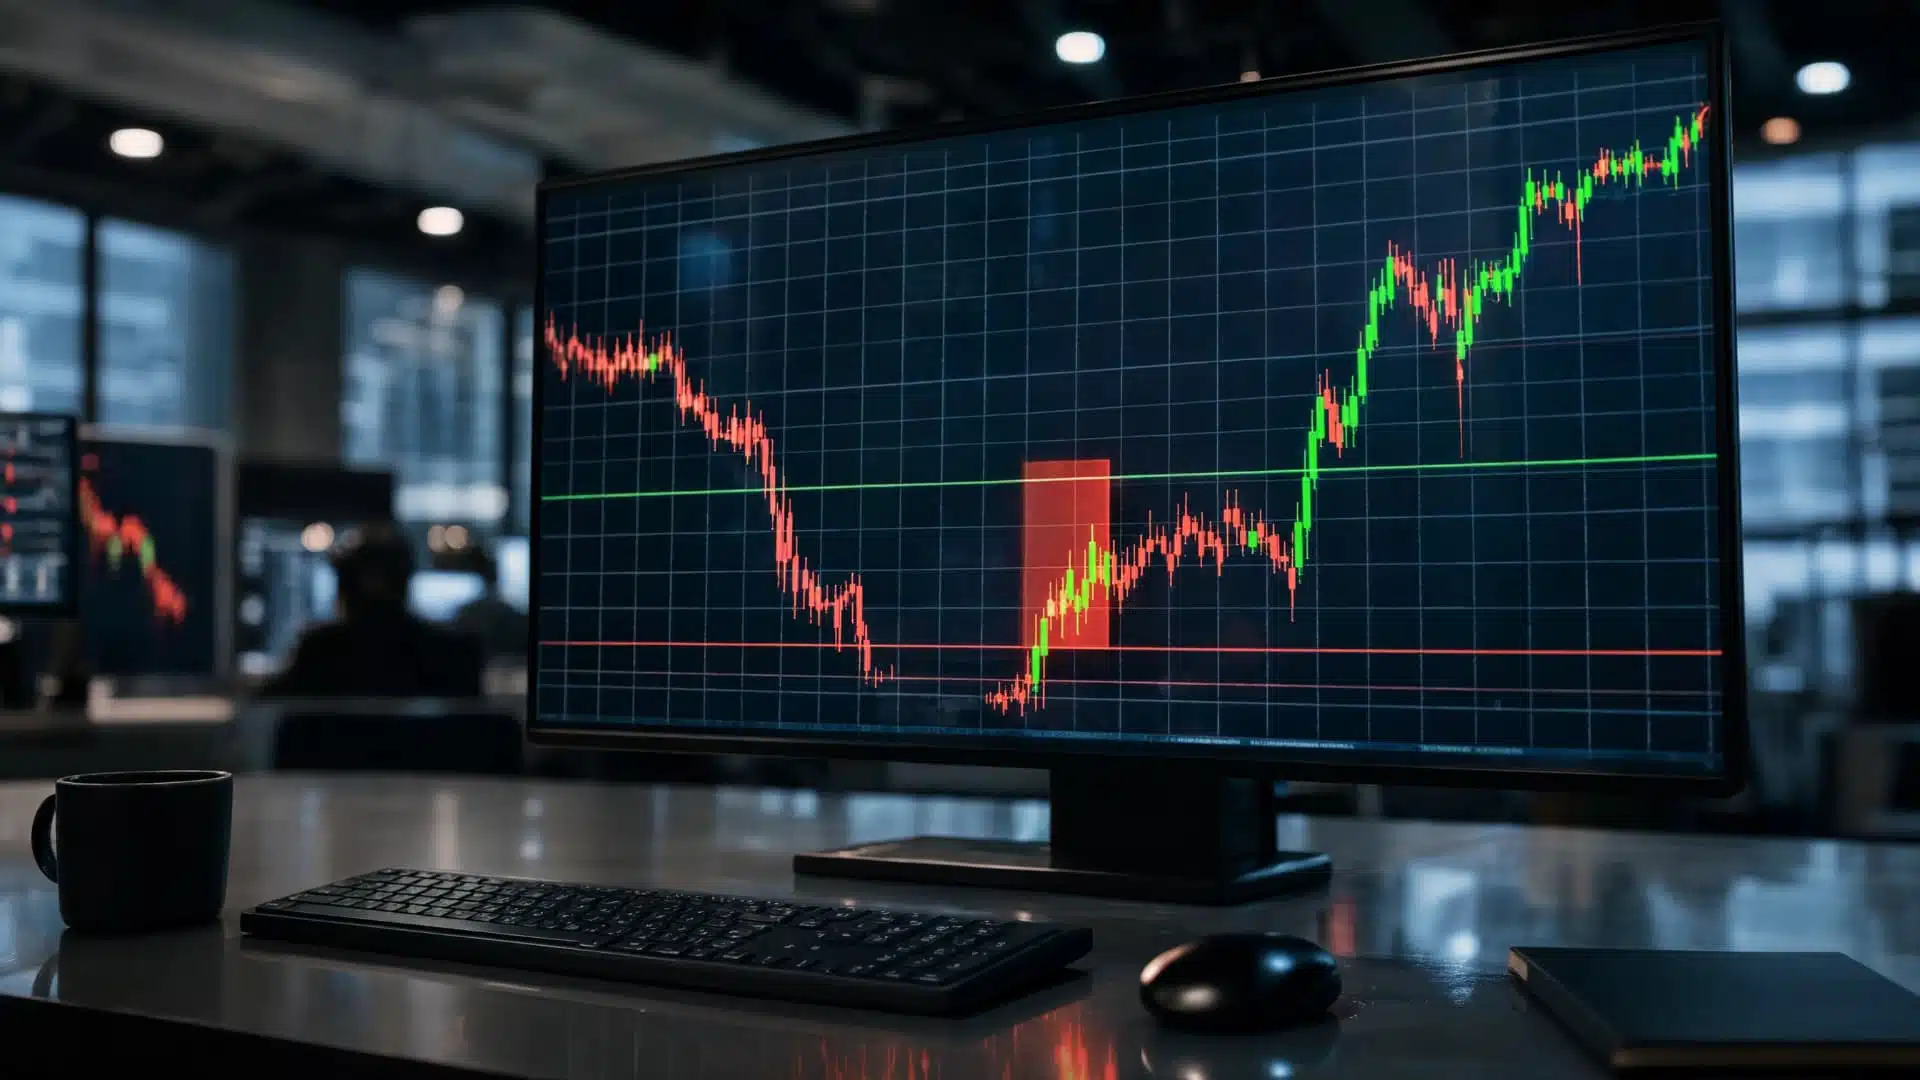
Picture a swing low that’s held for a few sessions. Price drifts down, pokes a few pips or points below that low, and every stop-loss sitting there fires at once. Then, instead of continuing lower, the price snaps back up through the level it just broke.
That wick, the sharp poke followed by an immediate reversal, is the signature of a sweep. A real breakout closes and holds above the level, usually with rising volume. A sweep touches the level, takes the liquidity, and leaves.
The reason this happens comes down to how institutions build large positions without moving the market against themselves. A hedge fund trying to buy a large position can’t just place one massive market order; it would spike the price before the order fills.
Instead, it needs sellers, and the same logic applies to supply and demand zones, where clusters of resting orders wait for the price to reach them. The easiest place to find a wall of ready sell orders is just below a well-known swing low, where retail traders have stacked their stop-losses.
Step-by-Step: How to Identify a Liquidity Sweep
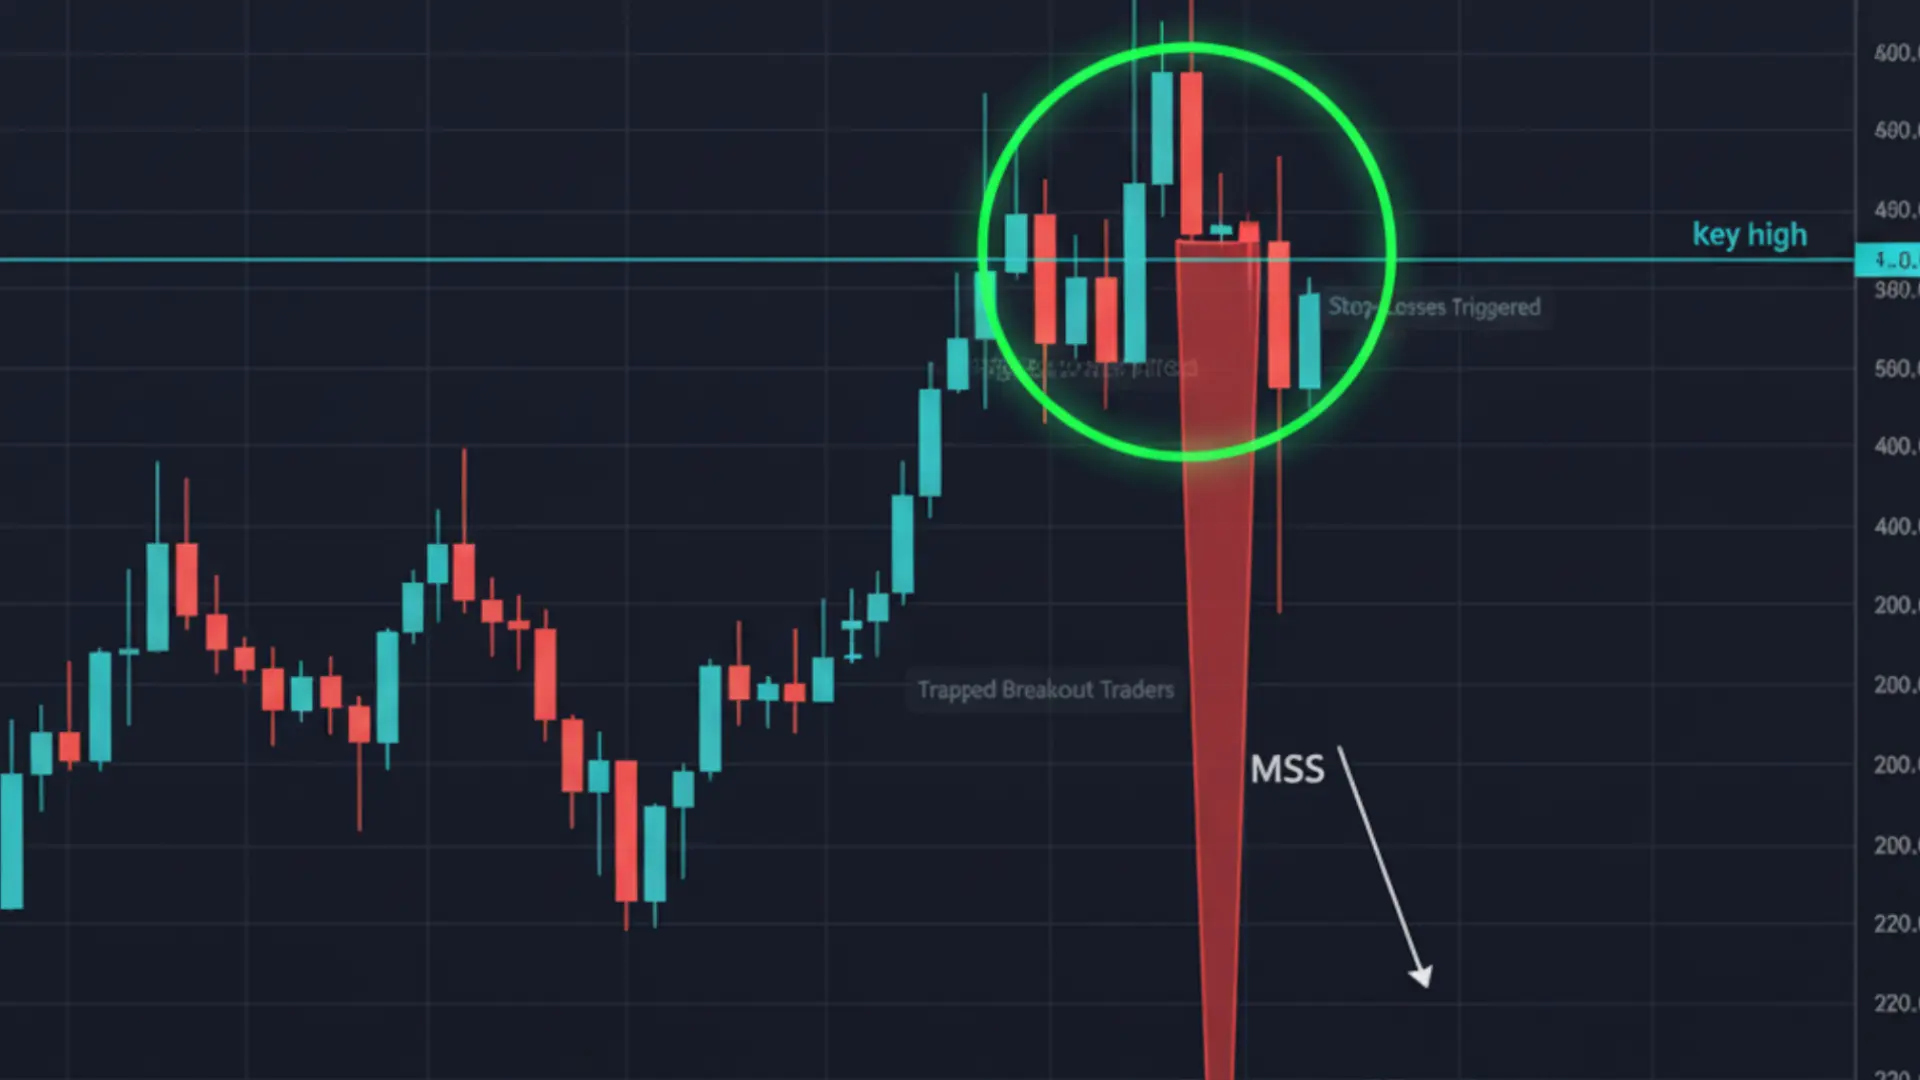
Mark the obvious levels first. Prior day, week, and session highs and lows. Equal highs or equal lows. These are the “clean” levels where retail stops cluster, and they’re exactly where market makers look.
- Watch for a sharp, fast move through the level. Not a grind. A sweep usually appears as one or two candles that spike through the level at an unusually high speed relative to the preceding price action.
- Check that the move fails to hold. If price closes back inside the prior range within a candle or two, that’s your first clue.
- Look for a displacement candle in the opposite direction. This is a large-bodied candle that moves fast and covers more ground than the recent average. It shows real participation, not just stopping to get cleared.
- Confirm with a market structure shift (MSS). After the sweep, price needs to break the most recent opposing swing point to confirm control has actually changed hands. Without this step, you’re just guessing that the sweep will reverse.
- Cross-check the session. Sweeps during the London or New York session carry more weight than ones at 3 a.m. during the Asian session, when volume is thin and moves are easier to fake.
This same trap shows up across familiar intraday setups, where a false break through support or resistance pulls traders in before price reverses hard the other way.
For example, if EUR/USD has held above 1.0850 for three sessions and then wicks down to 1.0838 before closing back above 1.0850 on a strong bullish candle, that’s a textbook sweep of sell-side liquidity, not the start of a new downtrend.
Entry, Stop Loss, and Target
Entry: Don’t enter on the wick itself. Wait for the displacement candle to close and, ideally, for a retest of the broken level, a nearby order block, or one of the gap-fill entry zones the price left behind. This gives you a defined risk point instead of chasing the reversal candle.
Stop Loss: Place your stop just beyond the extreme of the sweep, not at the level itself. If the sweep wicked to 1.0838, your stop belongs a few pips below that wick, not at 1.0850, where a retest could tag you out before the real move develops.
Target: Aim for the next liquidity pool, meaning the next visible swing high or low where the opposite side’s stops are resting. A 1:2 risk-to-reward ratio is a reasonable floor; many sweep setups offer more once the structure shift confirms direction.
Getting this right depends less on the setup itself and more on disciplined position sizing techniques, since a sweep that goes wrong still needs a stop that protects the account rather than one placed out of hope.
Common Mistakes Traders Make:
|
How This Plays Out on a Live Chart
Say gold has been ranging with a clear swing low near $2,015 for several days. During the New York AM session, price spikes down to $2,011, clears out a batch of stop-losses sitting below $2,015, and closes back above $2,018 on a large bullish candle within the same hour.
Fifteen minutes later, price breaks above the prior swing high that had been capping the range, confirming a bullish market structure shift.
A trader watching for this would enter on a retest of the $2,015-$2,018 zone, place a stop below $2,011, and target the next higher resistance cluster. That’s the sweep, the displacement, and the structure shift working together, not a lucky guess.
Compare that to a genuine breakout: if gold had instead closed and held below $2,015 for several candles with rising volume, that’s not a sweep; it’s a real break of structure, and the correct read (and trade direction) is the opposite.
Timeframe context matters too. A move that looks like a clean sweep on the 15-minute chart can just be noise inside a larger breakout on the 4-hour chart, so always check the higher timeframe before committing.
Liquidity Sweep vs. Liquidity Grab and Break of Structure
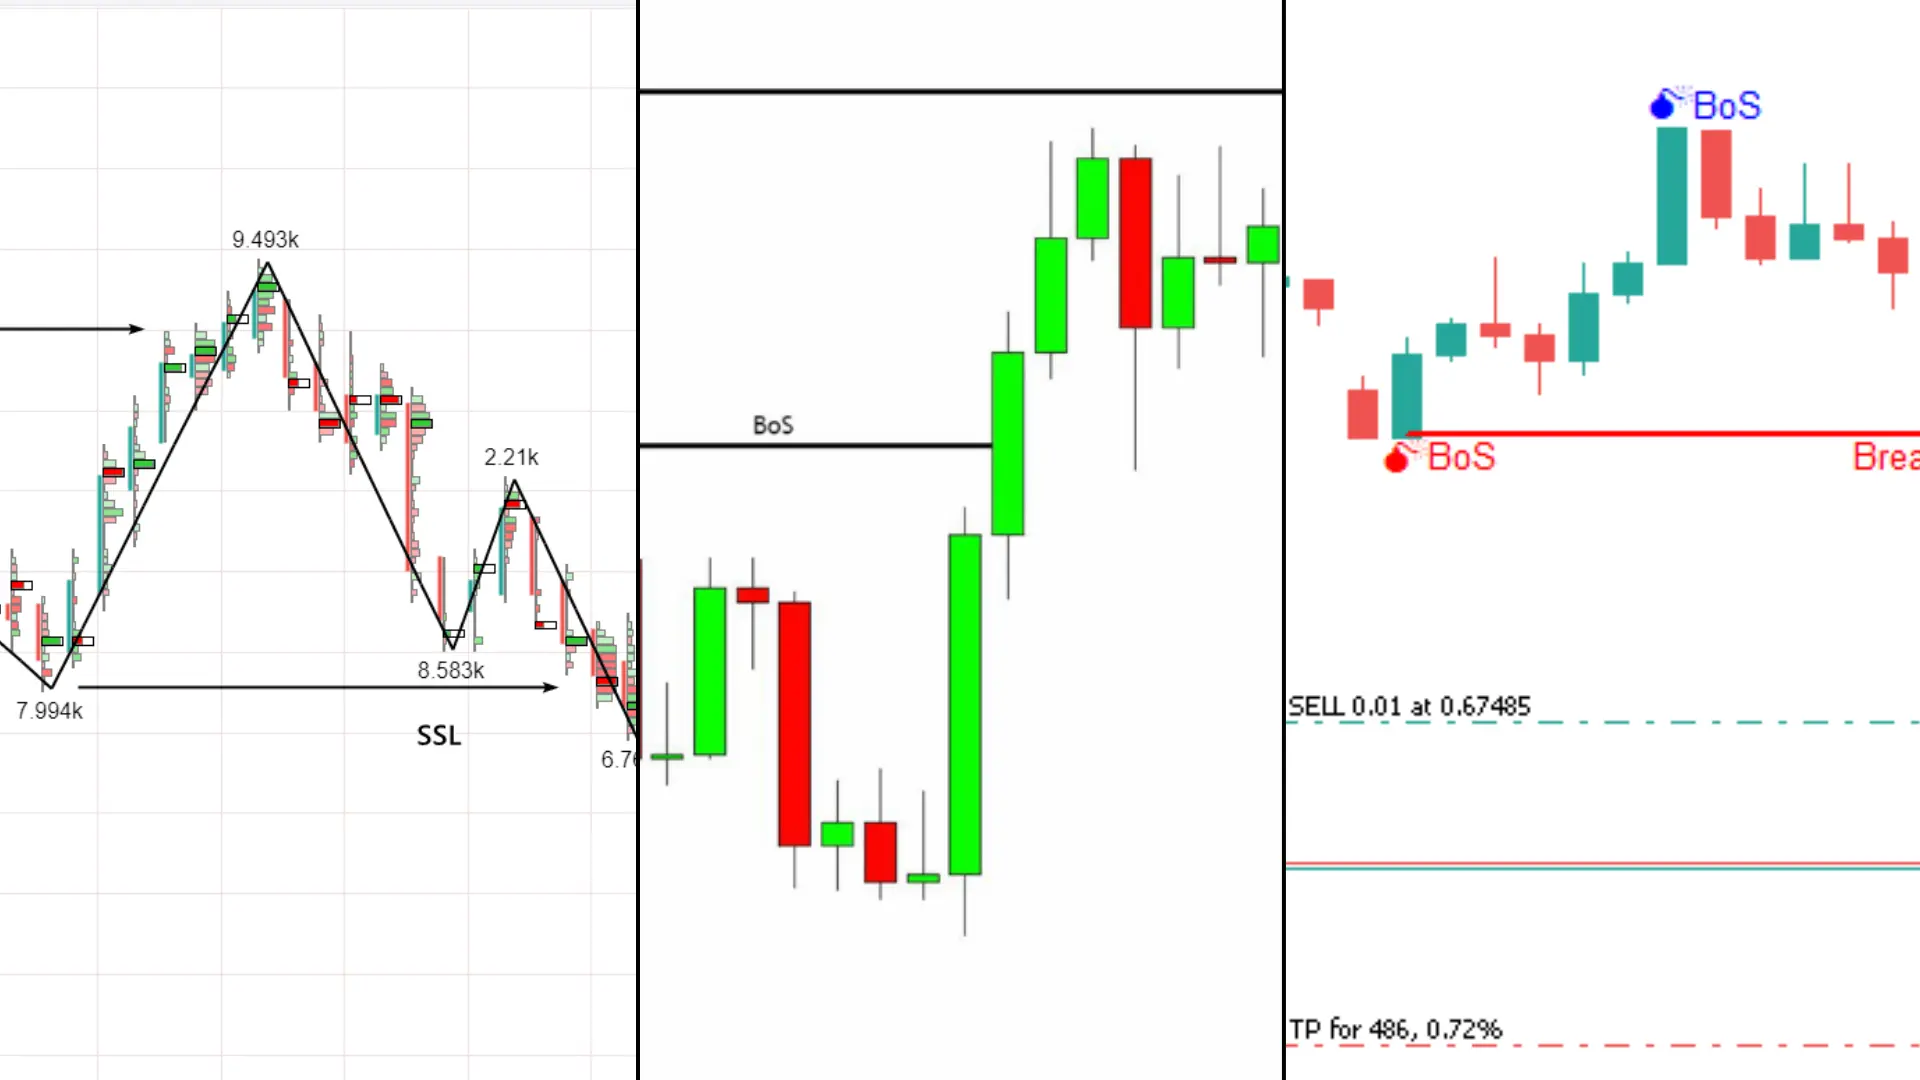
The same principle carries over into other reversal setups, including a bullish reversal neckline setup, where the neckline plays the same role as a swing low plays here. Here’s how the three related terms differ.
| Term | What It Looks Like | What It Signals |
|---|---|---|
| Liquidity Sweep | Price runs beyond a high or low, fills orders, then stalls or reverses | Institutions collecting liquidity before the real move |
| Liquidity Grab | A single fast wick that snaps back almost immediately | A short-lived hunt, usually resolved within one or two candles |
| Break of Structure (BOS) | Price closes beyond a swing point and holds | A genuine shift or continuation, not a trap |
Why This Keeps Happening: Trader Psychology
Most retail stop-losses sit in the same handful of places: just above resistance, just below support, or beyond an obvious double top or bottom. That predictability is the whole reason sweeps work.
When you see a “perfect” breakout that everyone on social media is piling into at the same time, that crowding is often exactly what smart money is using as an exit or entry point.
The fix isn’t to stop using stop-losses. It’s to give trades more room and think in terms of swing-style trade planning, rather than reacting to every wick that shows up intraday or waiting for confirmation before chasing the first move you see.
Frequently Asked Questions
How many confirmations should I wait for after a liquidity sweep?
Wait for at least two confirmations before entering: a strong displacement candle and a shift in market structure. A retest of the swept level or nearby order block can add more confidence. Entering too early can turn a valid-looking sweep into a losing trade.
Can beginners trade liquidity sweeps safely?
Beginners can study liquidity sweeps, but they should practice on demo charts before using real money. The setup requires patience, higher-timeframe context, and strict risk control. Without confirmation, beginners may confuse normal volatility with a genuine sweep.
What indicators work well with liquidity sweep setups?
Volume, moving averages, session markers, and market structure tools can support liquidity sweep analysis. Volume helps confirm stronger participation, while session markers show whether the sweep happened during active trading hours. Indicators should support price action, not replace it.
Why do liquidity sweeps happen before major moves?
Liquidity sweeps often happen because large traders need enough buy or sell orders to enter positions efficiently. Obvious highs and lows attract stop-losses and pending orders, creating liquidity. Once those orders are filled, the price may move in the intended direction.
Should I trade every liquidity sweep I see?
No. Not every sweep is worth trading. Low-volume sweeps, unclear structure, and weak reversals should usually be avoided. The best setups happen near important highs or lows, align with higher-timeframe structure, and show clear confirmation after the sweep.
Final Sweep
So now you know what’s really happening during those sudden spikes and fake breakouts: they’re often liquidity sweeps engineered by big players to grab stop orders before reversing price.
Once you start spotting these setups, trading feels more predictable and less stressful. You’ll begin to see where institutions enter and where retail traders get trapped.
I’ve found that patience and observation make all the difference. Watch how price reacts around major highs and lows, and you’ll start catching these sweeps before they catch you.
Have you noticed a liquidity sweep on your own charts lately? Share your experience or thoughts below; I’d love to hear how you’ve spotted one in action.